


文章目录
prometheus + grafana 初体验
在本机体验,所有的版本选择的都是Windows版本。监控的数据为本机的Window系统的数据,使用的
windows_exporter 作为监控数据采集器。
prometheus 部署
下载
下载页面: https://prometheus.io/download/
下载的版本:prometheus-2.37.0.windows-386.zip
部署
- 解压到本地任意目录
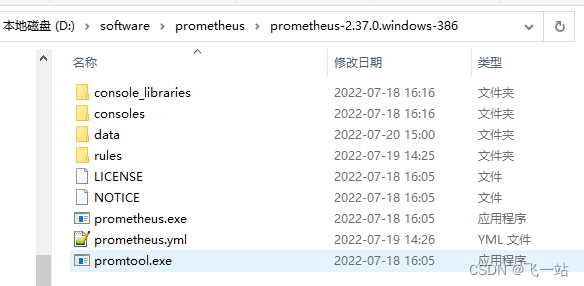
- 运行
prometheus.exe完成默认的方式启动
访问
访问prometheus 控制面板: http://localhost:9090/
grafana 部署
下载
下载: https://grafana.com/grafana/download?platform=windows
下载的版本:grafana-enterprise-9.0.4.windows-amd64.zip
部署
- 解压到本地任意目录
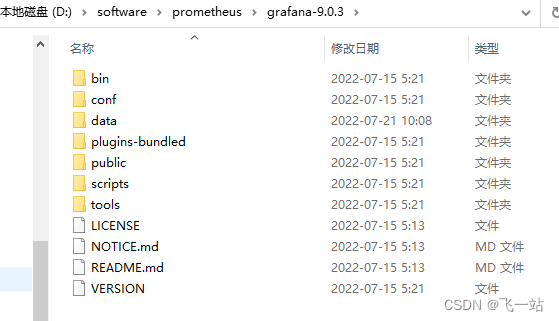
- 运行
grafana-server.exe完成默认的方式启动
访问
访问:http://localhost:3000/,默认用户密码均为admin
windows_exporter 部署
windows_exporter 是一个开源的prometheus的exporter。exporter 可以 理解为一个数据的提供者,通常一个exporter 都是集成采集和输出一体的,输出是指提供一个标准的metrics 接口供prometheus 这里数据收集加工的服务使用的接口。prometheus 会按照配置定时去调用提供的接口,将获取到的数据存入自己的默认的时序数据库。
对于不想提供接口给外部,想主动推送数据个prometheus 的,也可以使用Pushgateway,数据采集方将数据推送到这个公共的exporter再由prometheus 去这个 exporter定时拉取数据。
windows_exporter 的开源github地址:
https://github.com/prometheus-community/windows_exporter
本次使用的windows_exporter 是0.18.1版本
下载
下载: https://github.com/prometheus-community/windows_exporter/releases/tag/v0.18.1
下载的版本:windows_exporter-0.18.1-386.exe
部署
-
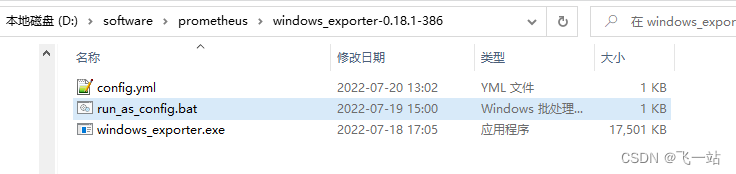
新建个目录,将下载好的文件重名为
windows_exporter.exe并放入该目录 -
新建一个
run_as_config.bat文件作为启动脚本,用于设置启动参数,内容如下:
windows_exporter.exe --config.file=config.yml
- 新建一个
config.yml文件,配置需要采集的数据,内容如下:
collectors:
  enabled: cache,cpu,cpu_info,cs,logical_disk,logon,memory,netframework_clrexceptions,netframework_clrinterop,netframework_clrjit,netframework_clrloading,netframework_clrlocksandthreads,netframework_clrmemory,netframework_clrremoting,netframework_clrsecurity,net,os,process,remote_fx,service,tcp,time
collector:
  service:
    services-where: "Name='windows_exporter'"
log:
  level: warn
- 最终目录结构如下
- 双击运行
run_as_config.bat文件启动
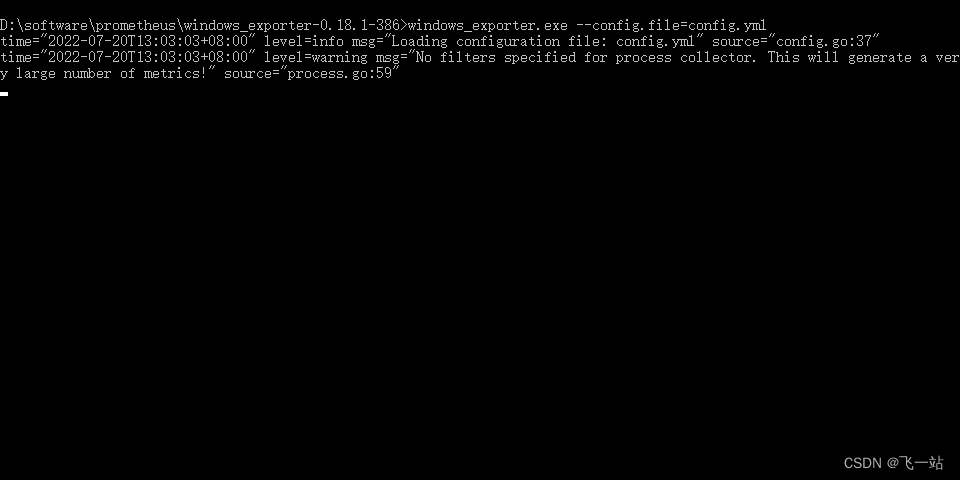
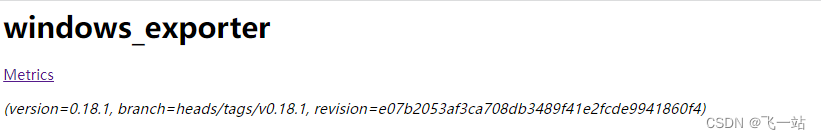
访问http://127.0.0.1:9182 能看到如下页面
prometheus 收集 windows_exporter 的数据
修改 prometheus 的配置文件
- 修改
prometheus目录下prometheus.yml文件,增加监控Window的配置,内容如下:
# my global config
global:
  scrape_interval: 15s # Set the scrape interval to every 15 seconds. Default is every 1 minute.
  evaluation_interval: 15s # Evaluate rules every 15 seconds. The default is every 1 minute.
  # scrape_timeout is set to the global default (10s).

# Alertmanager configuration
alerting:
  alertmanagers:
    - static_configs:
        - targets:
          # - alertmanager:9093

# Load rules once and periodically evaluate them according to the global 'evaluation_interval'.
rule_files:
  # - "first_rules.yml"
  # - "second_rules.yml"

# A scrape configuration containing exactly one endpoint to scrape:
# Here it's Prometheus itself.
scrape_configs:
  # The job name is added as a label `job=<job_name>` to any timeseries scraped from this config.
  - job_name: "prometheus"

    # metrics_path defaults to '/metrics'
    # scheme defaults to 'http'.

    static_configs:
      - targets: ["localhost:9090"]
  # 监控windows机器
  - job_name: 'Windows10'
    static_configs:
    - targets: ['localhost:9182']
重启prometheus
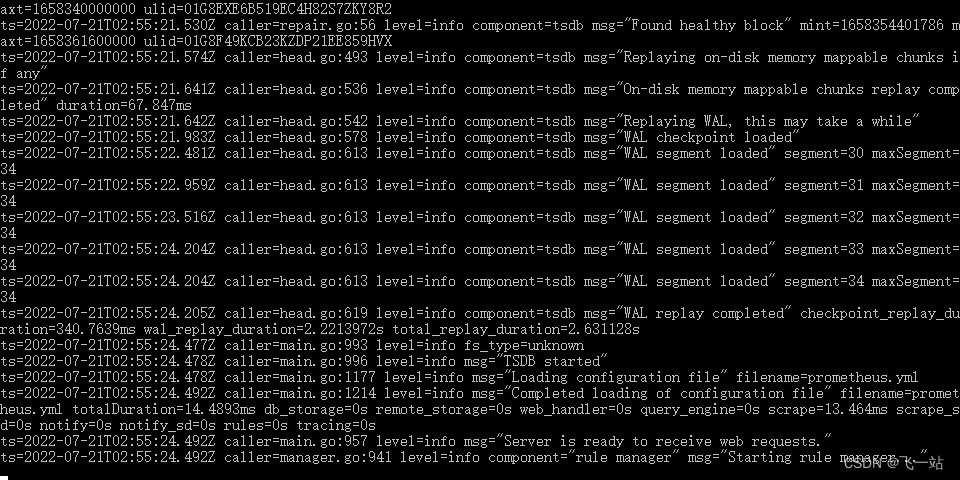
用CTRL+C 键关闭 prometheus.exe的进程,再重新运行prometheus.exe.
访问 prometheus 控制面板验证 windows_exporter 的数据
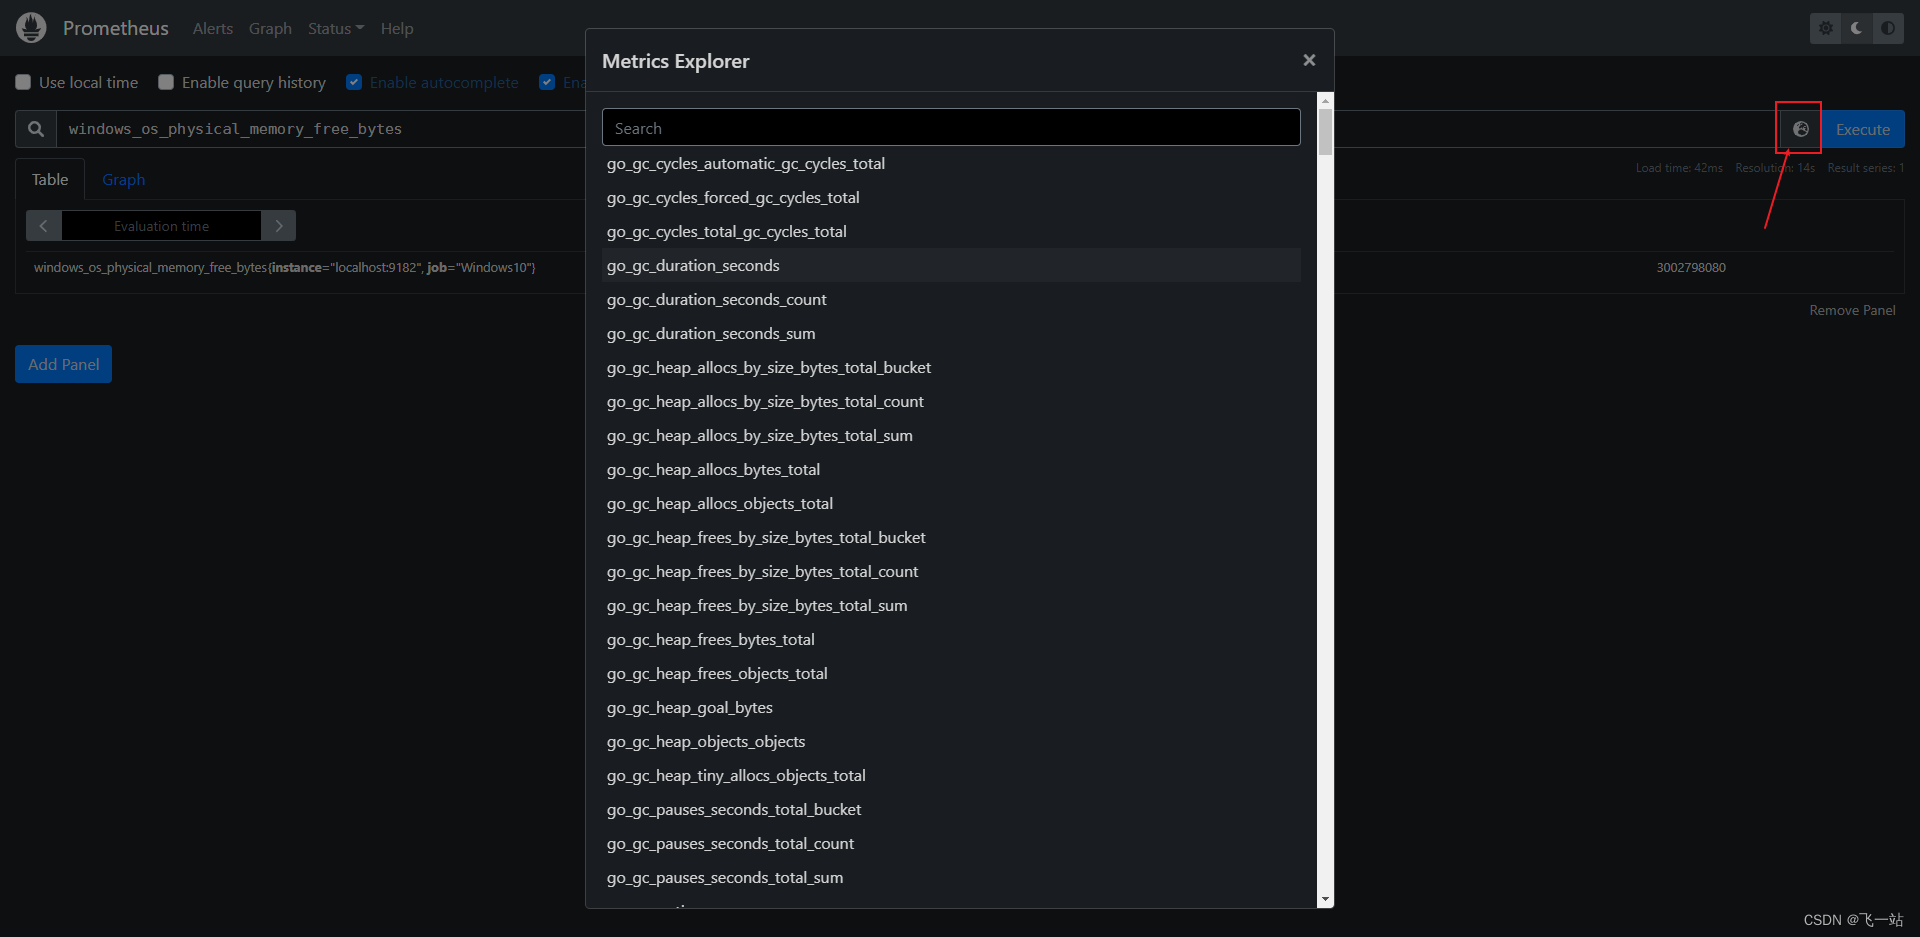
访问prometheus 控制面板: http://localhost:9090/
能看到一堆Windows 开头的指标就说明数据收集到了。
使用 grafana 显示 prometheus 收集windows_exporter 数据
grafana 配置 prometheus数据源
- 访问
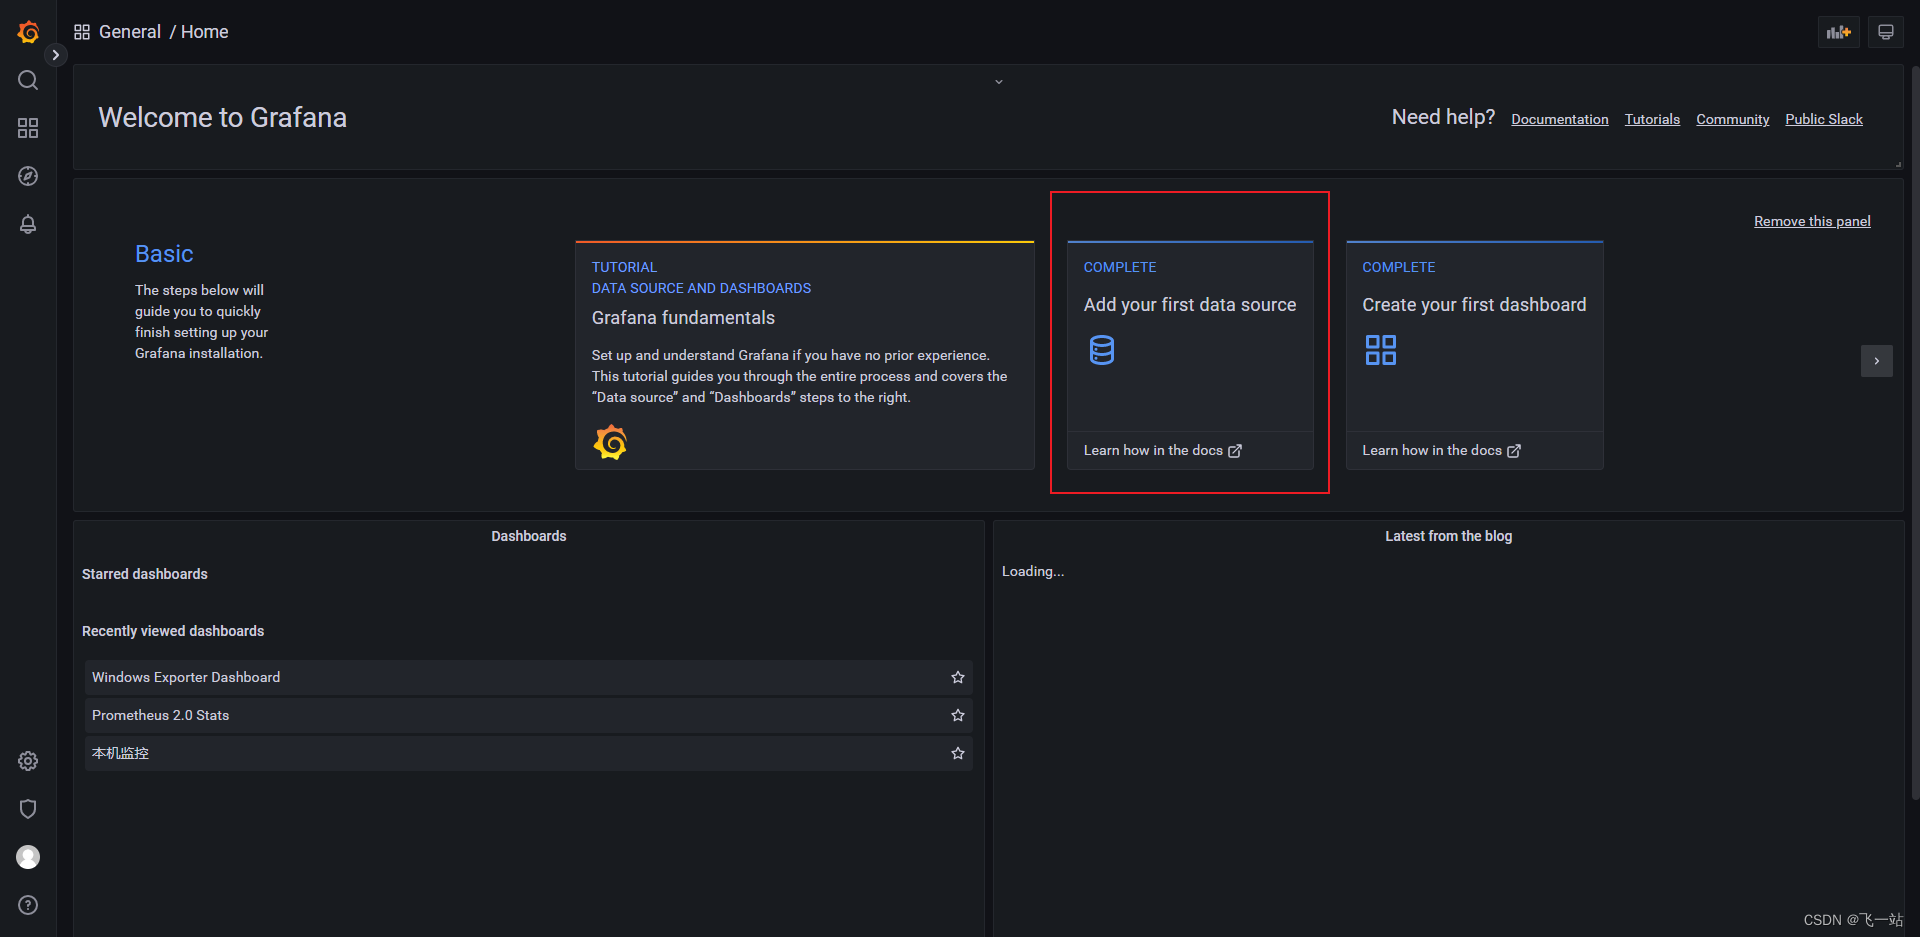
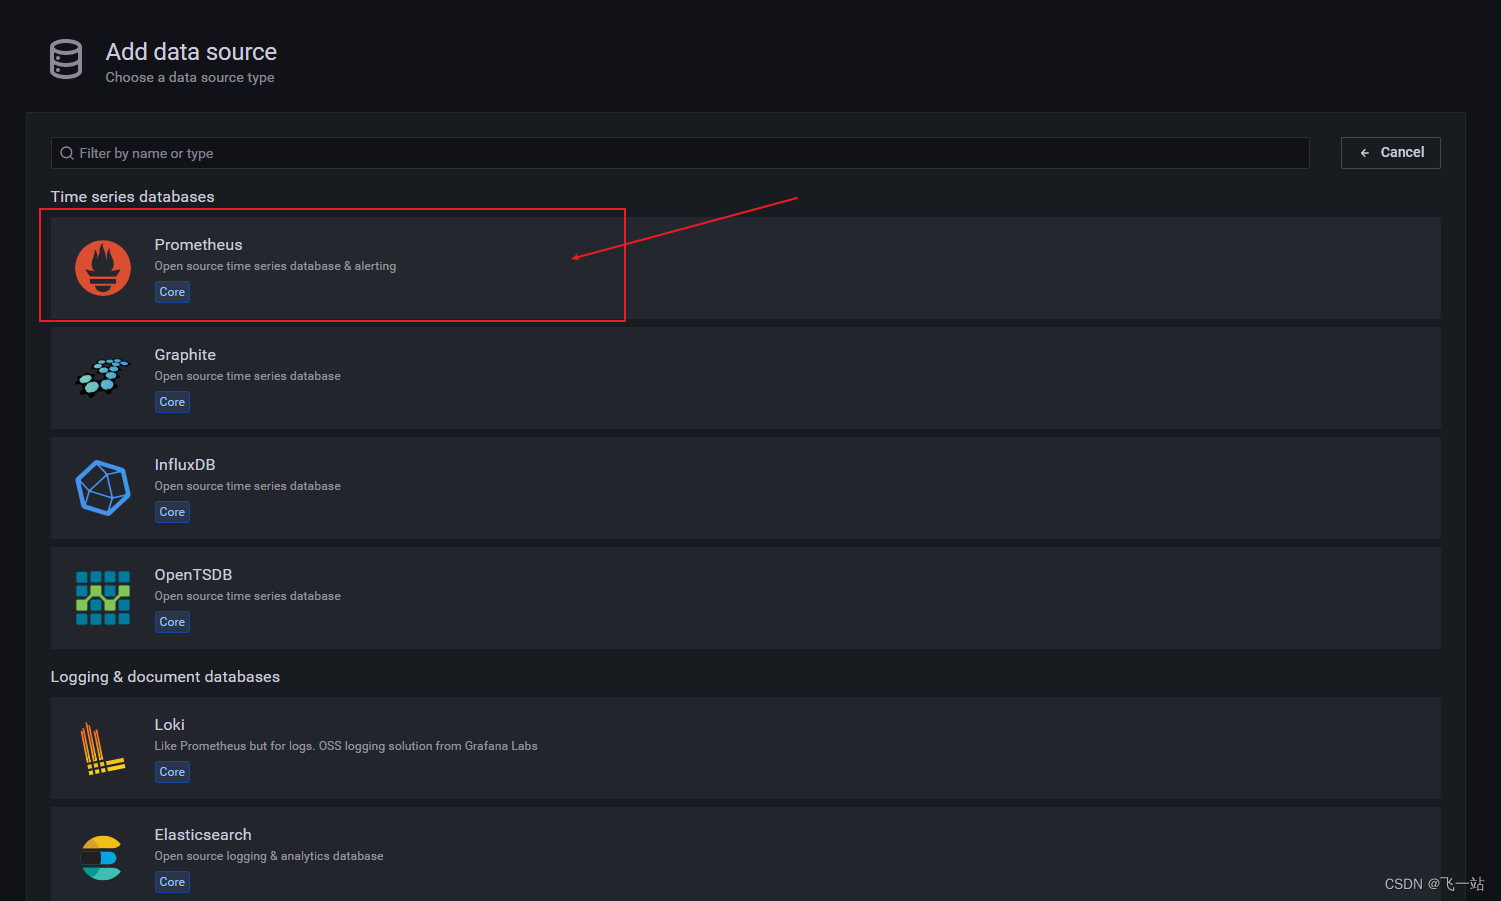
grafana的控制台:http://localhost:3000/,默认用户密码均为admin,选择Add your first data source
- 选择
prometheus数据源
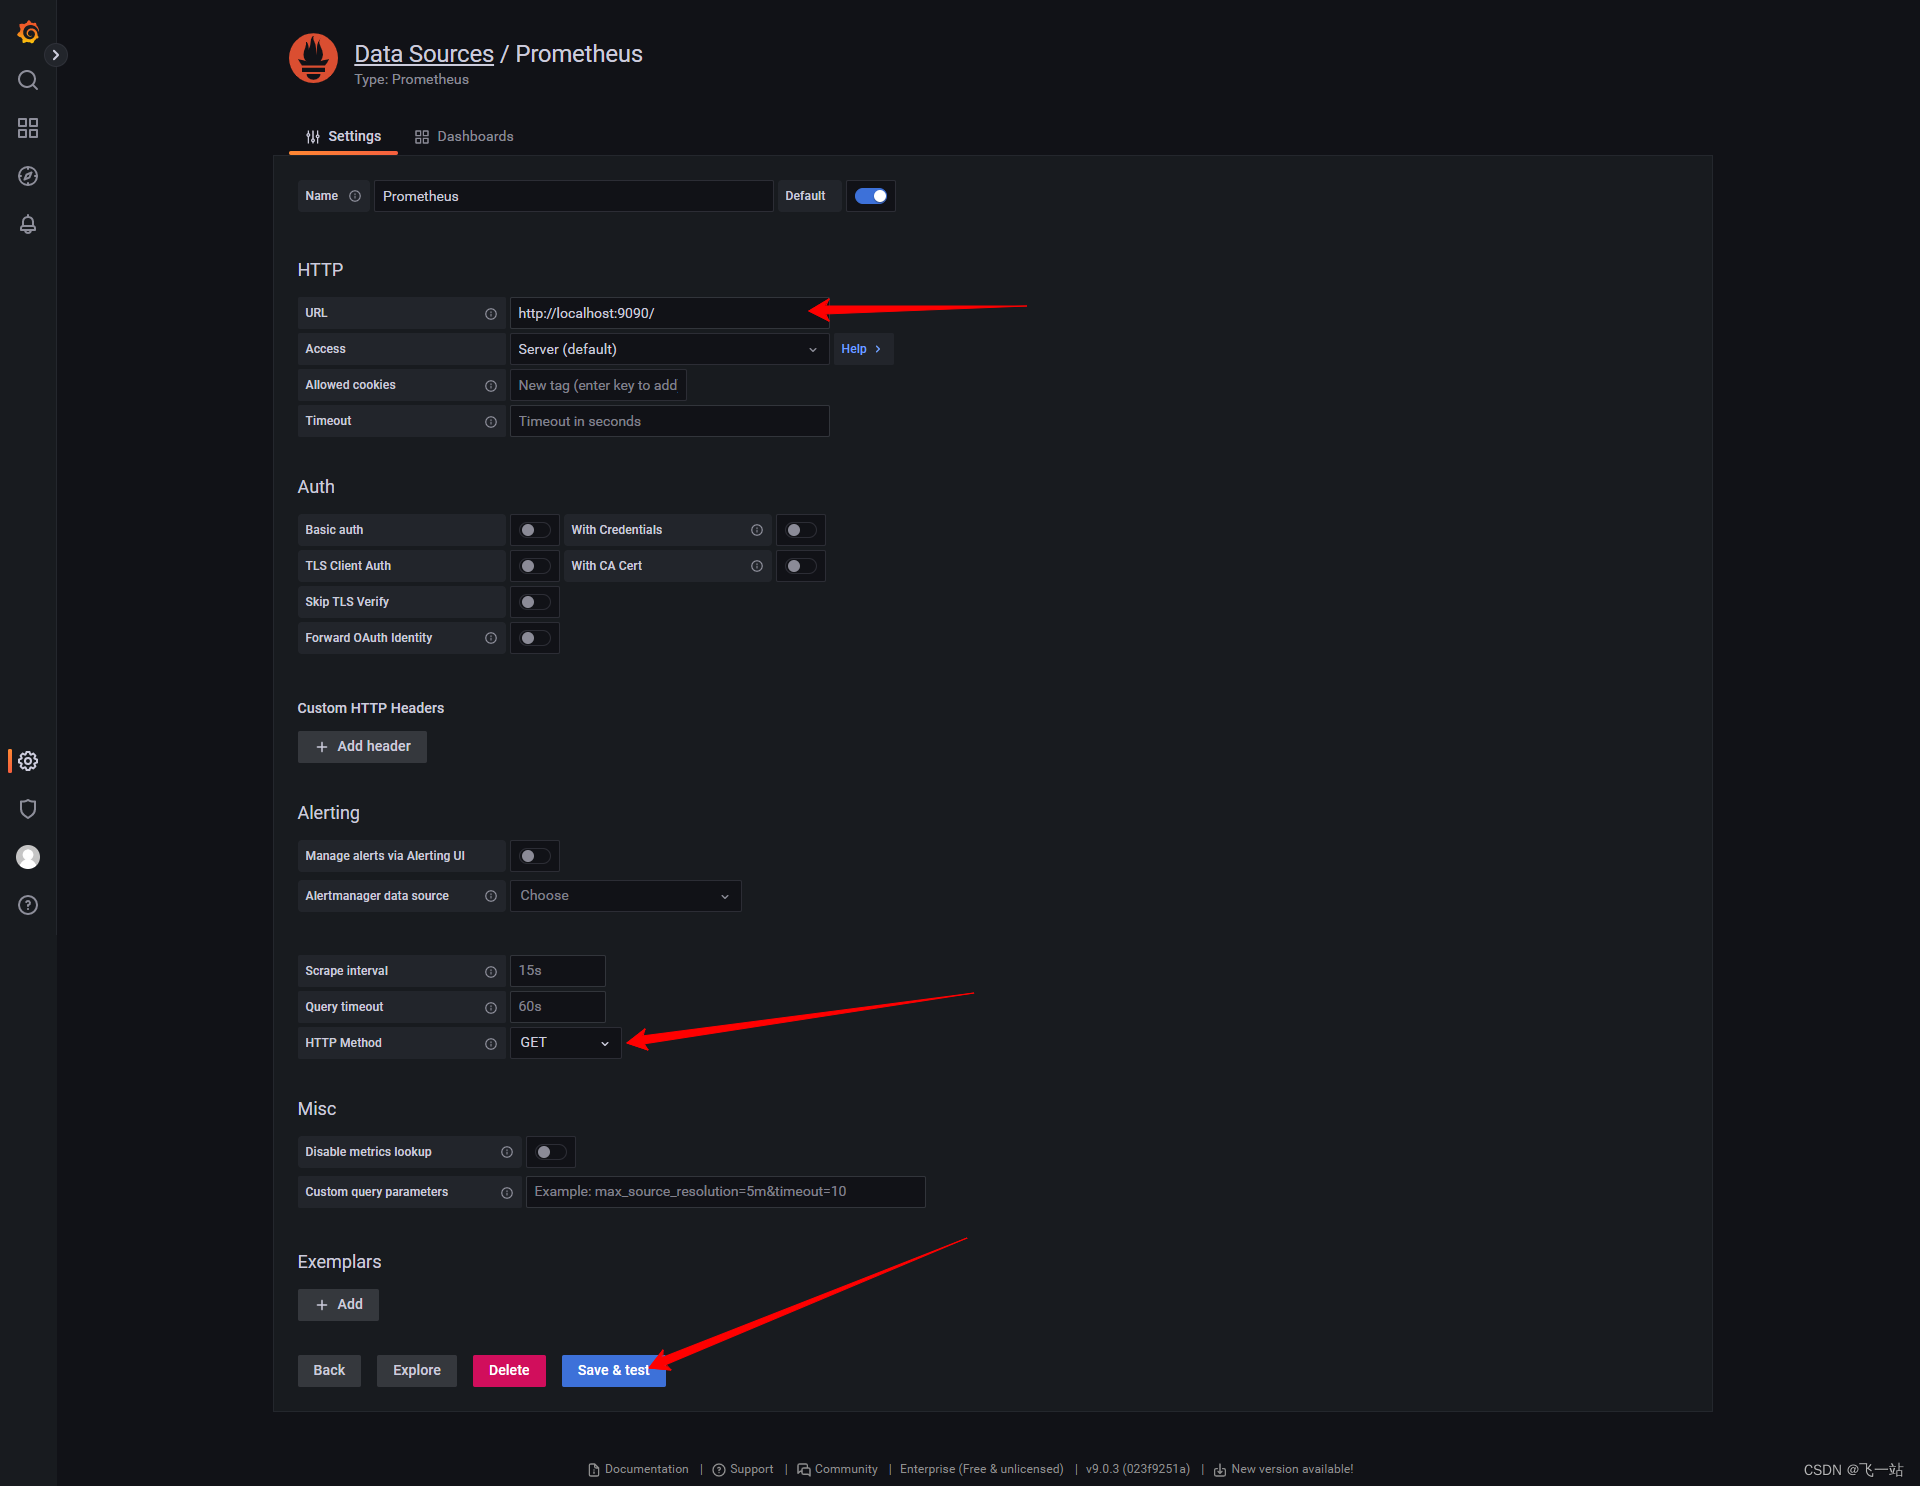
- 配置
prometheus数据源,保存并测试
grafana 配置 Dashboards
grafana 的 Dashboards 可以手动配置,也可以直接导入别人配置好的。相关的Dashboards 可以在https://grafana.com/grafana/dashboards/ 这个网址搜索到。
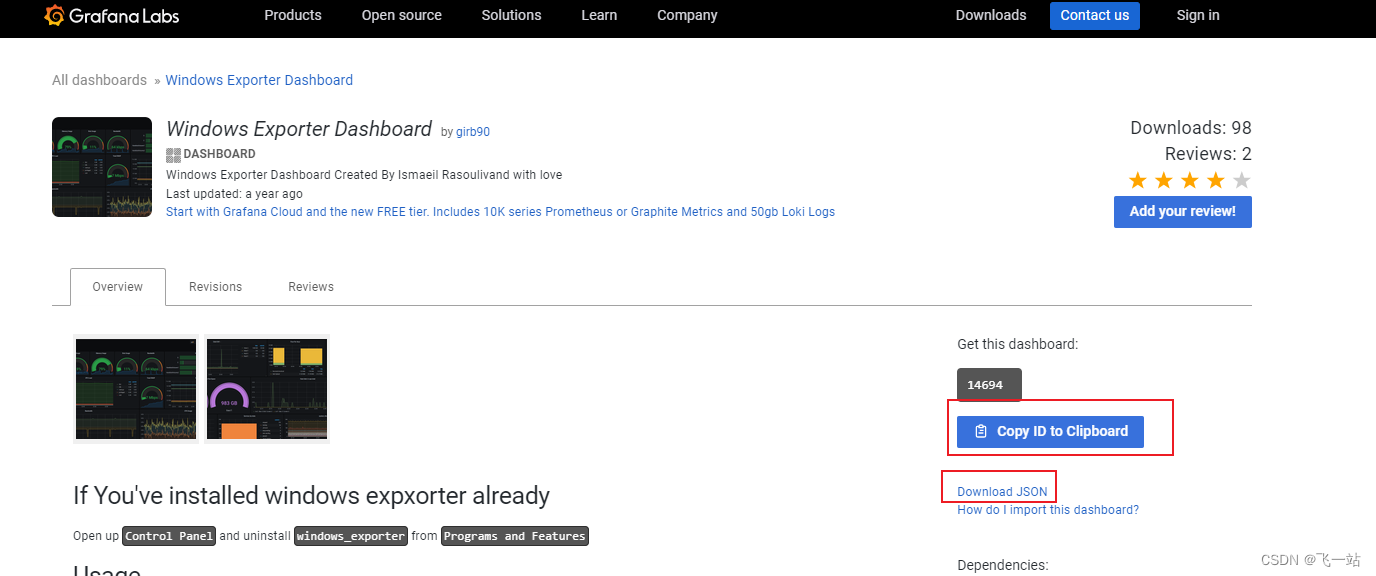
例如windows_exporter 就有配置好的Dashboards。
Windows Exporter Dashboard :https://grafana.com/grafana/dashboards/14694
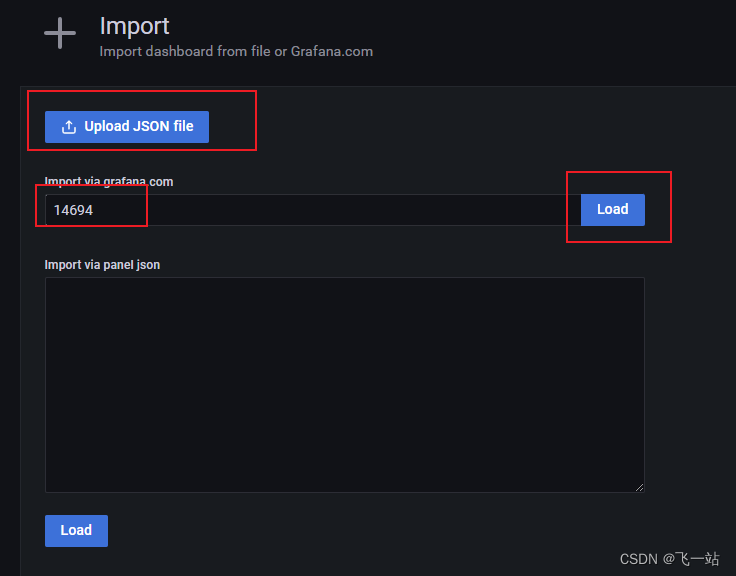
导入Windows Exporter Dashboard 到 grafana
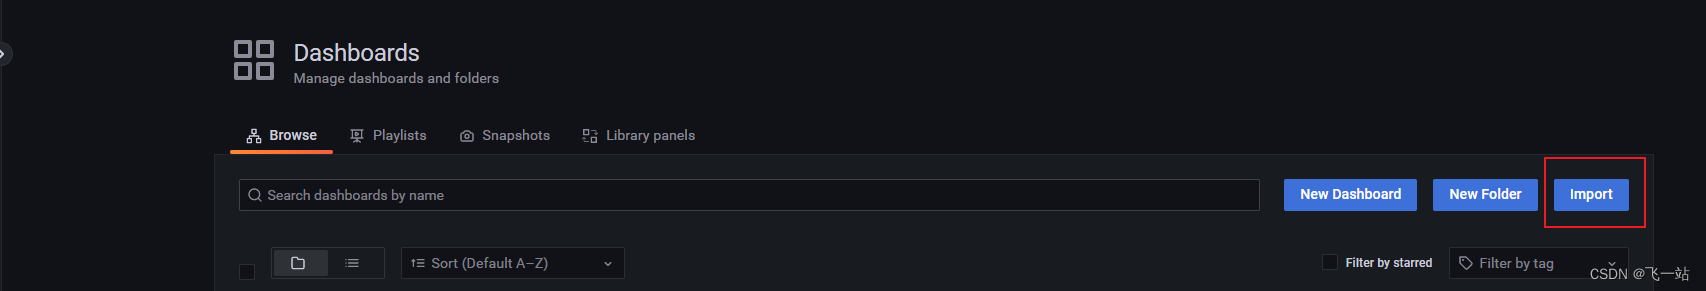
可以选择输入https://grafana.com/grafana/dashboards 网站的Dashboard ID ,也可以选择上传下载好的JSON文件。
修改导入Windows Exporter Dashboard 配置
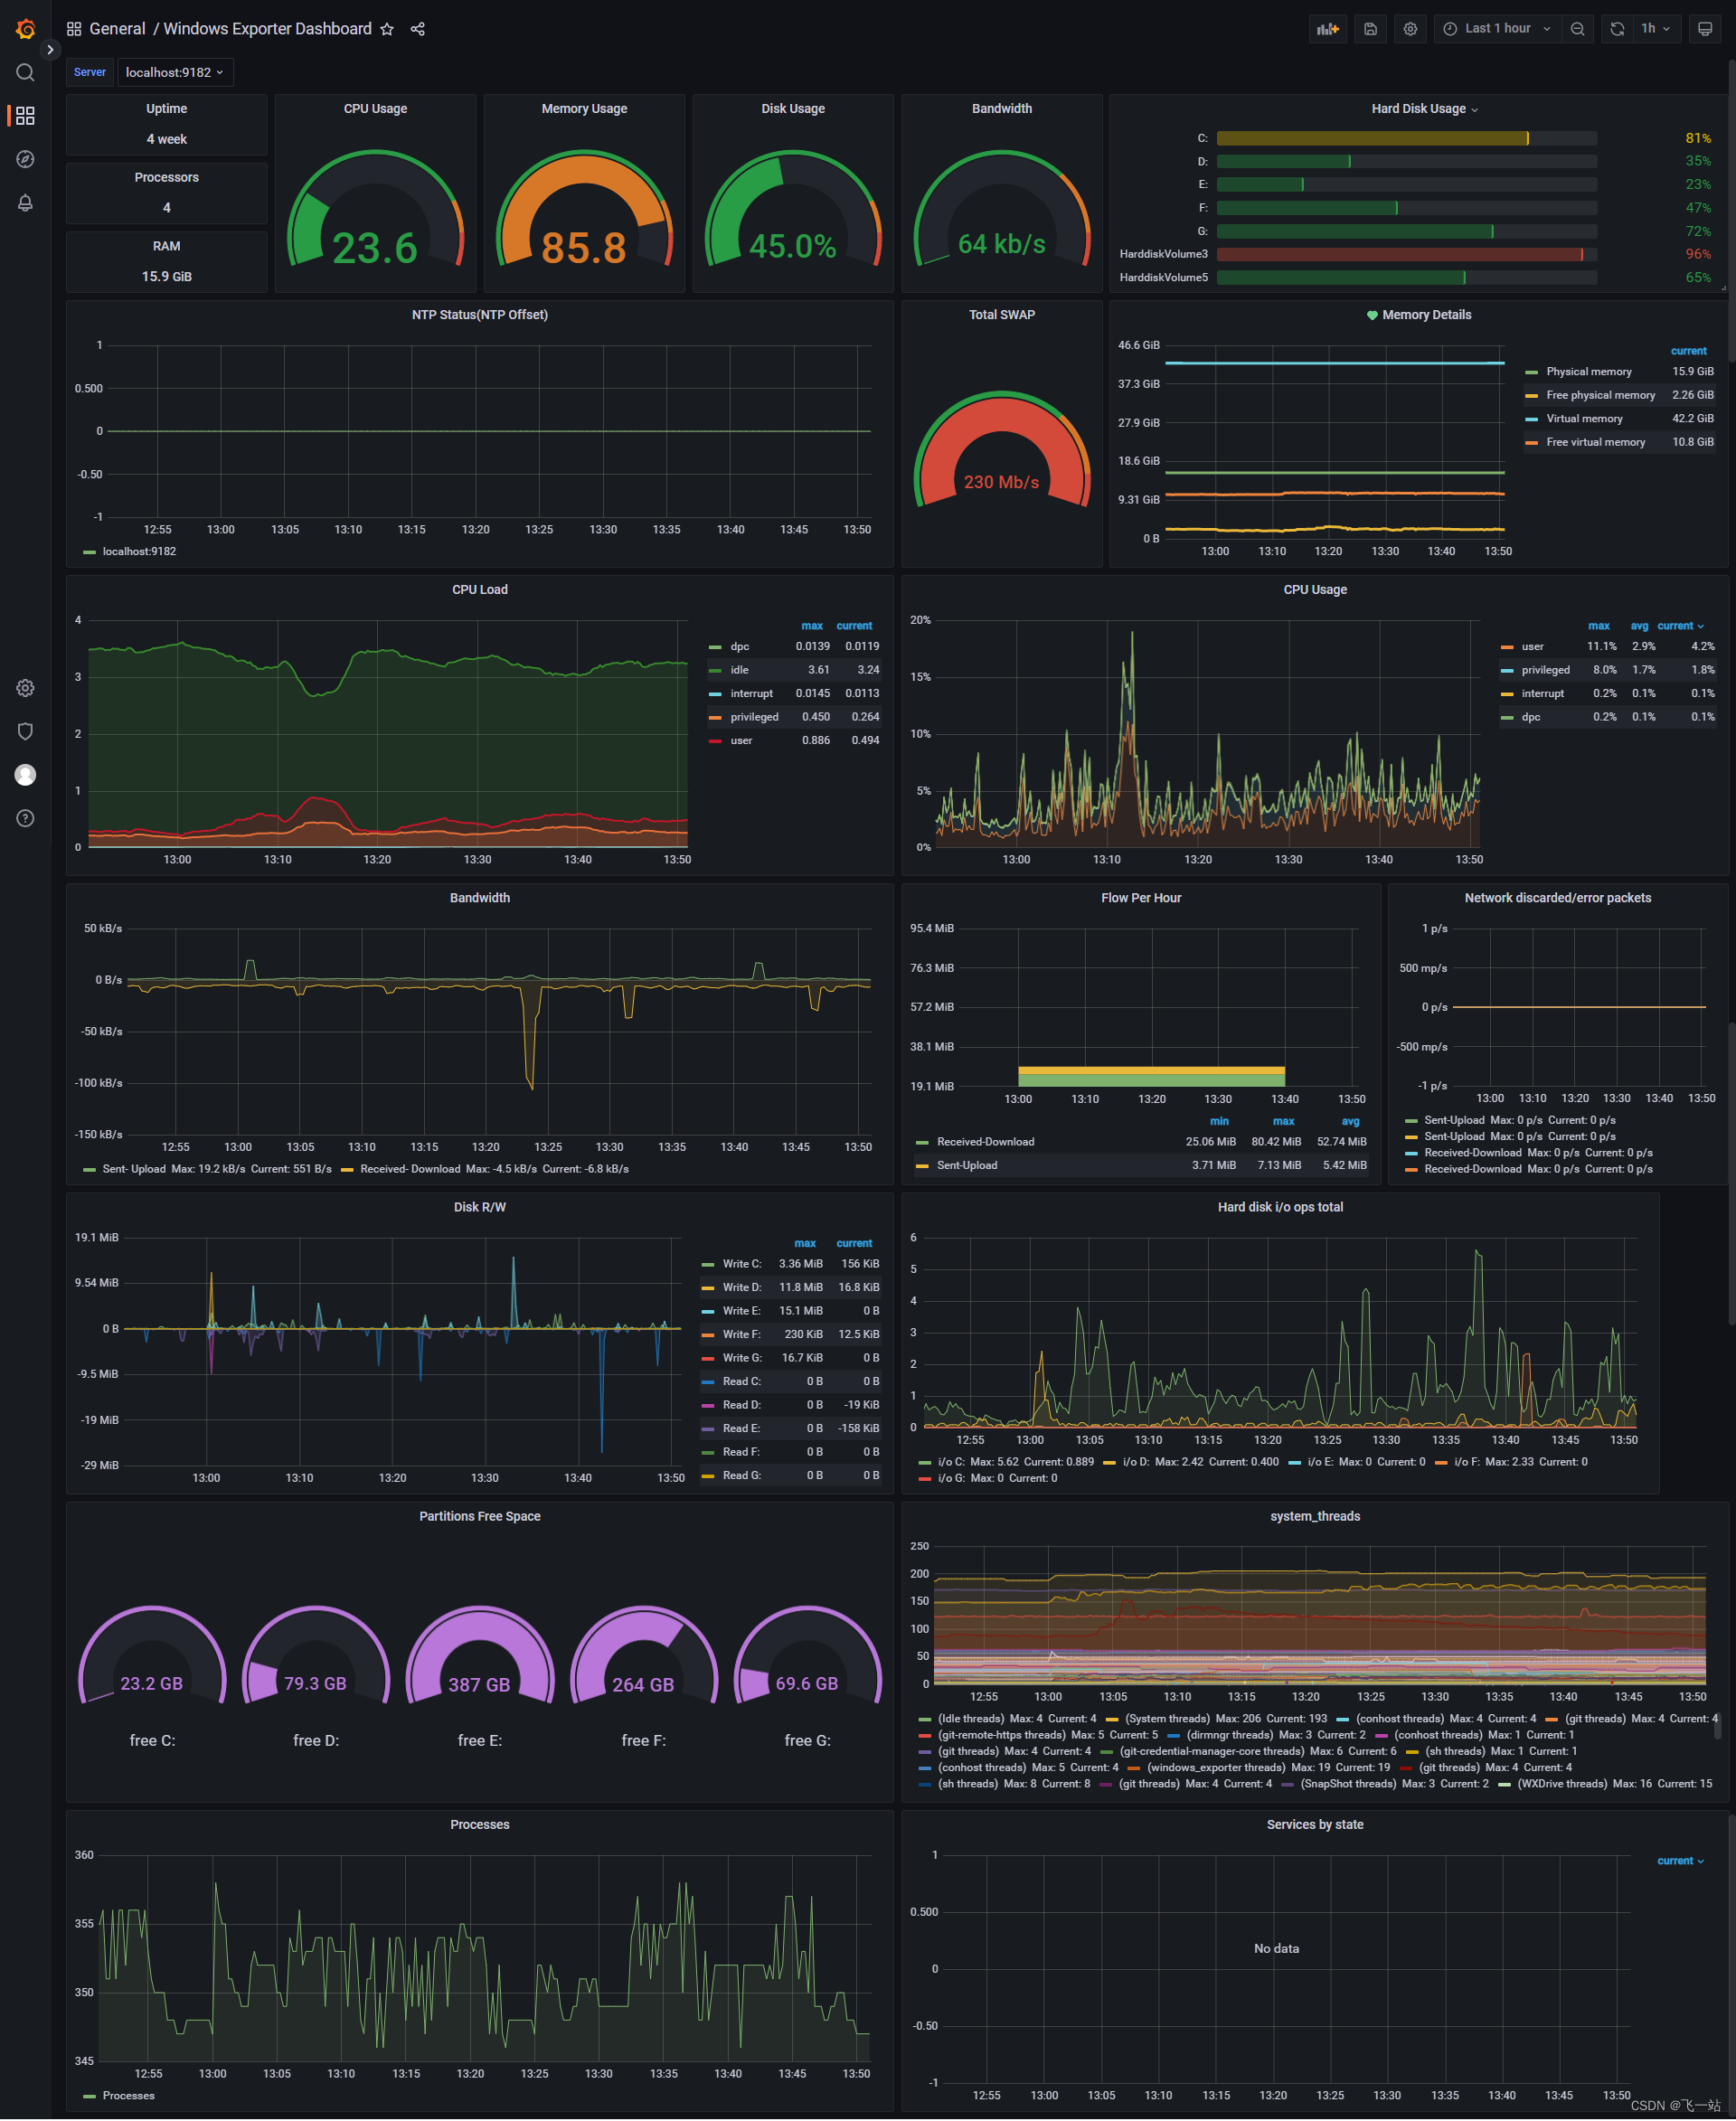
Windows Exporter Dashboard 导入后的效果如下,
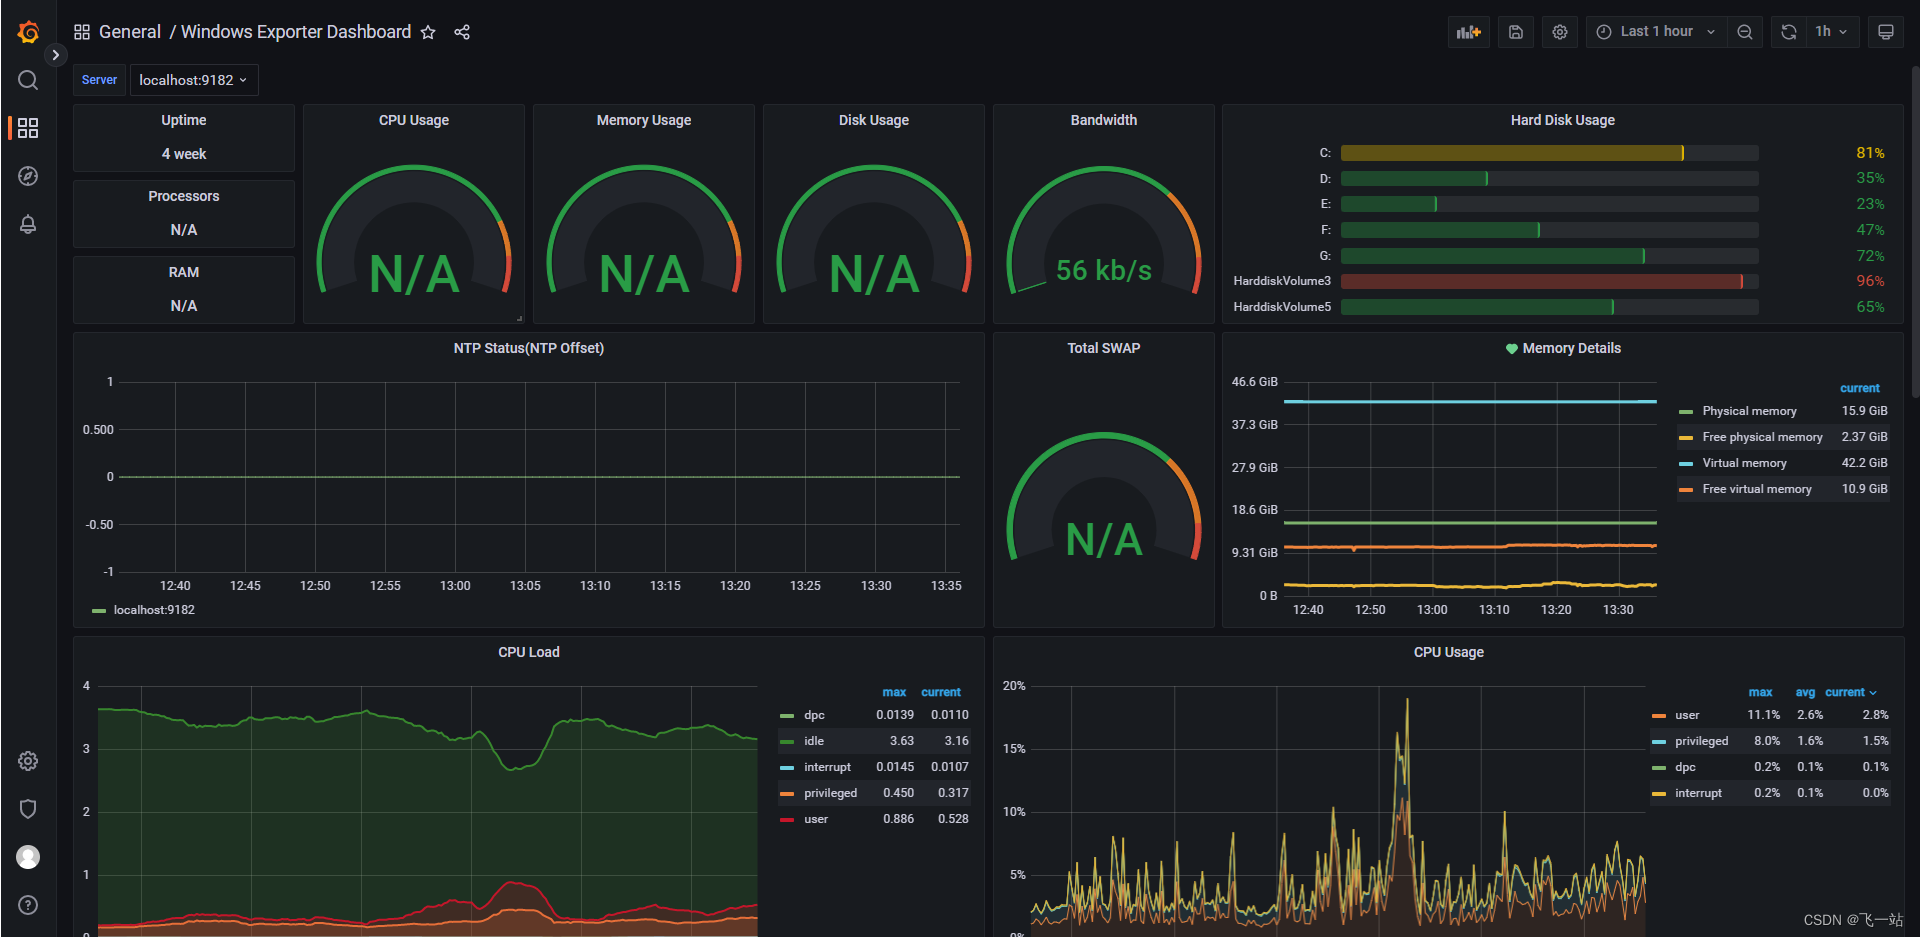
大部分panel都无法显示正常的数据,这是因为Windows Exporter Dashboard 大部分默认的panel 为192.168.xxx.xx 的一个IP,需求修改为你本机的IP,修改方式如下:
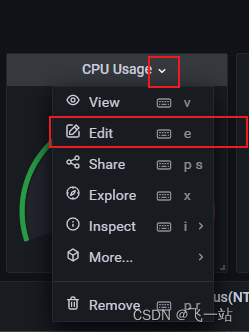
- 选择这个
panel点击标题右边的下拉箭头,选择edit菜单,以CPU Usage这个panel举例
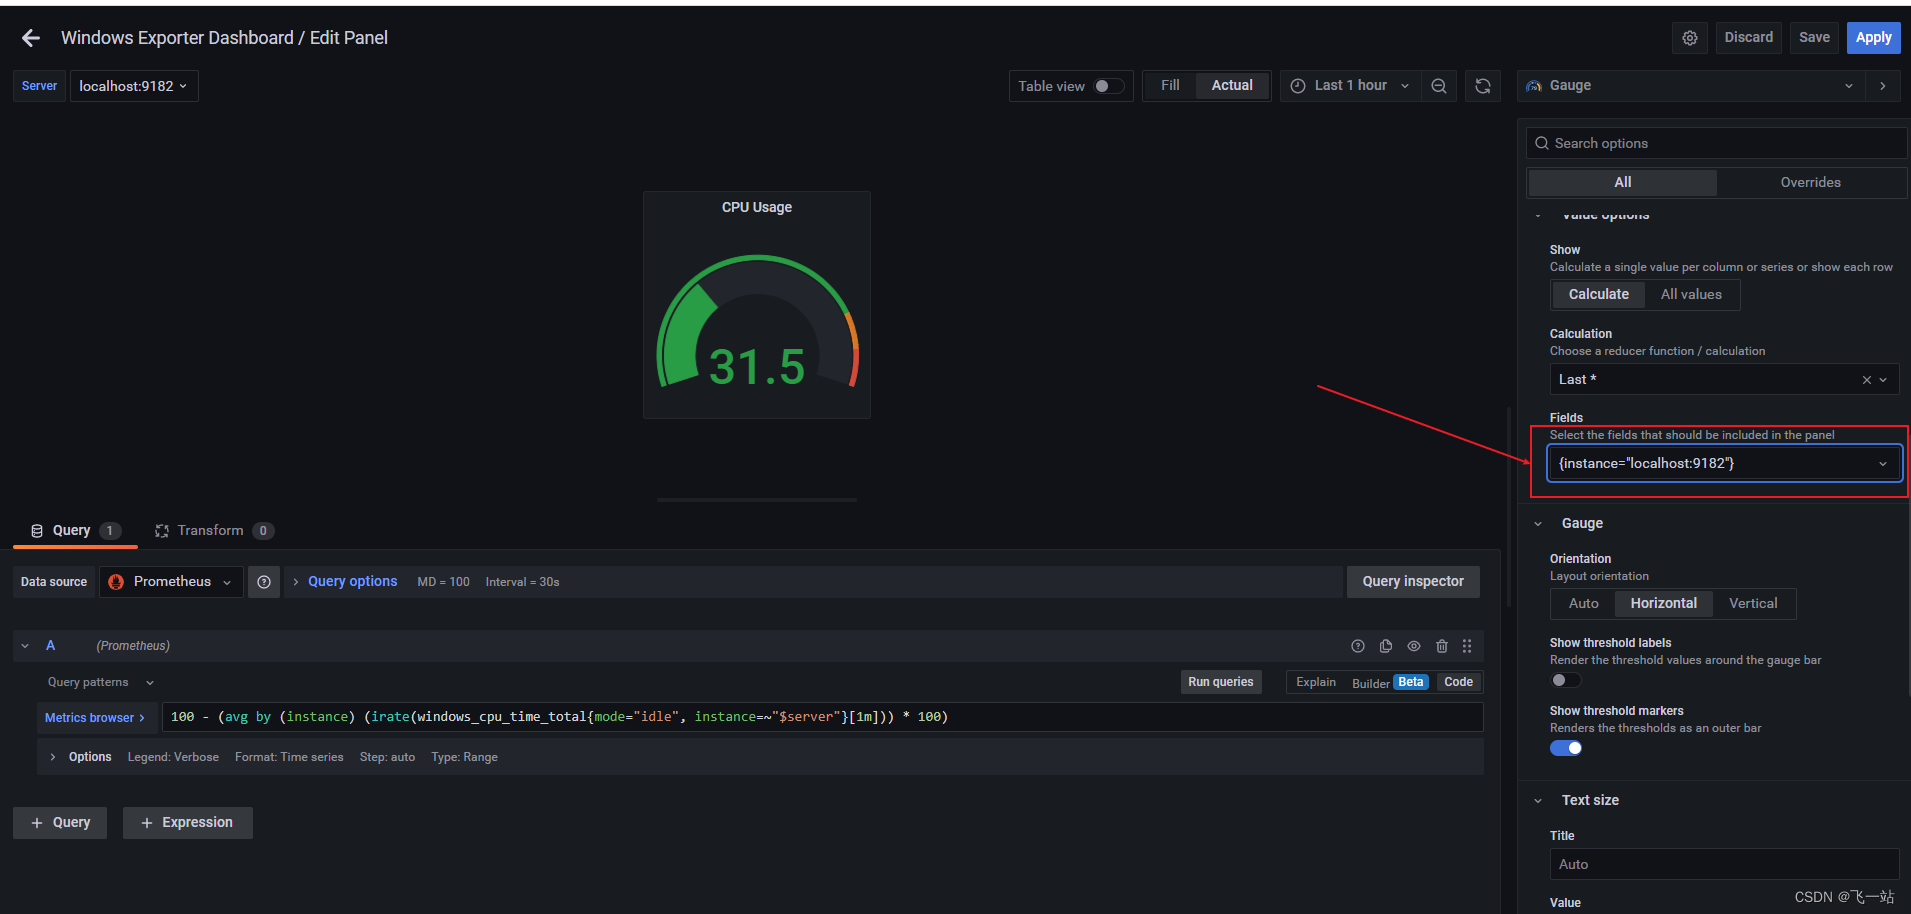
- 修改右边的
Value options下的Fields的值,下拉修改为当前本机的信息,这个时候就能看到panel正常显示了
- 点击右上角的
Save按钮,二次确认Save保存修改。点击左上角的←返回Dashboard
其他的panel 也一样修改,最终效果如下:
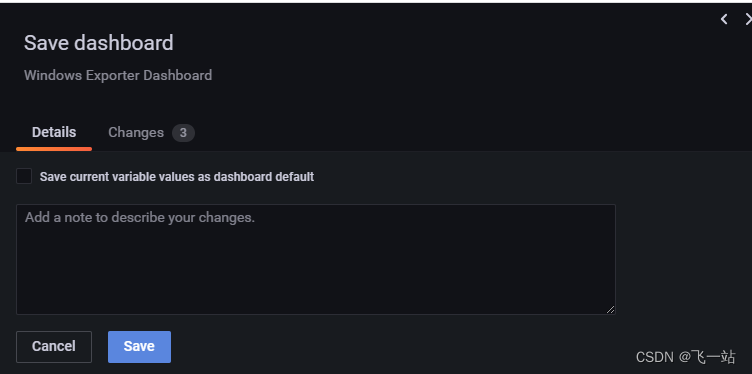
- 点击右上角的
保存按钮,保存Dashboard的修改

使用 grafana 的Alert 做一个简单的预警功能
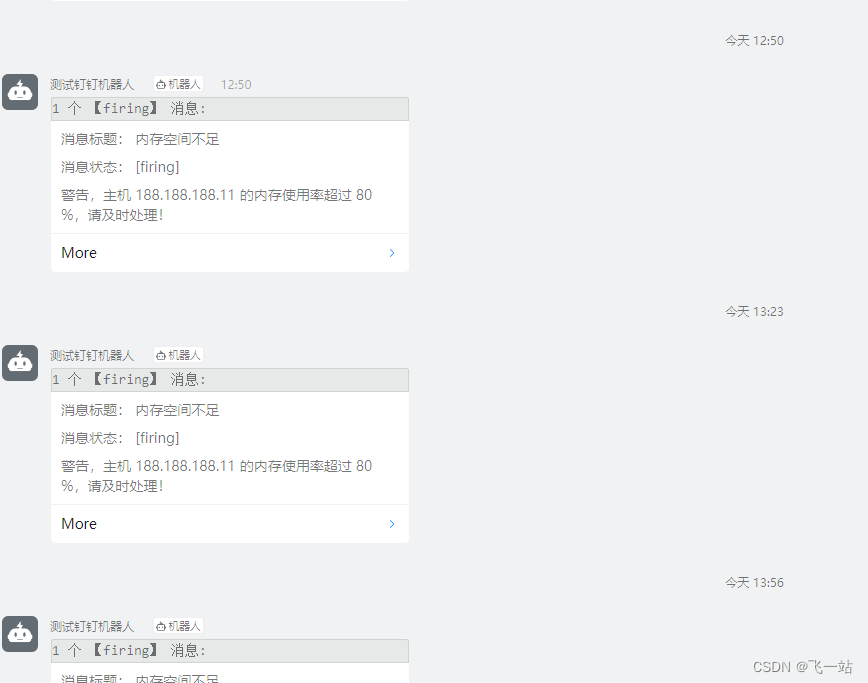
实现的效果为监听内存使用率,超过80%就通过钉钉的群机器人发送一条告警消息。
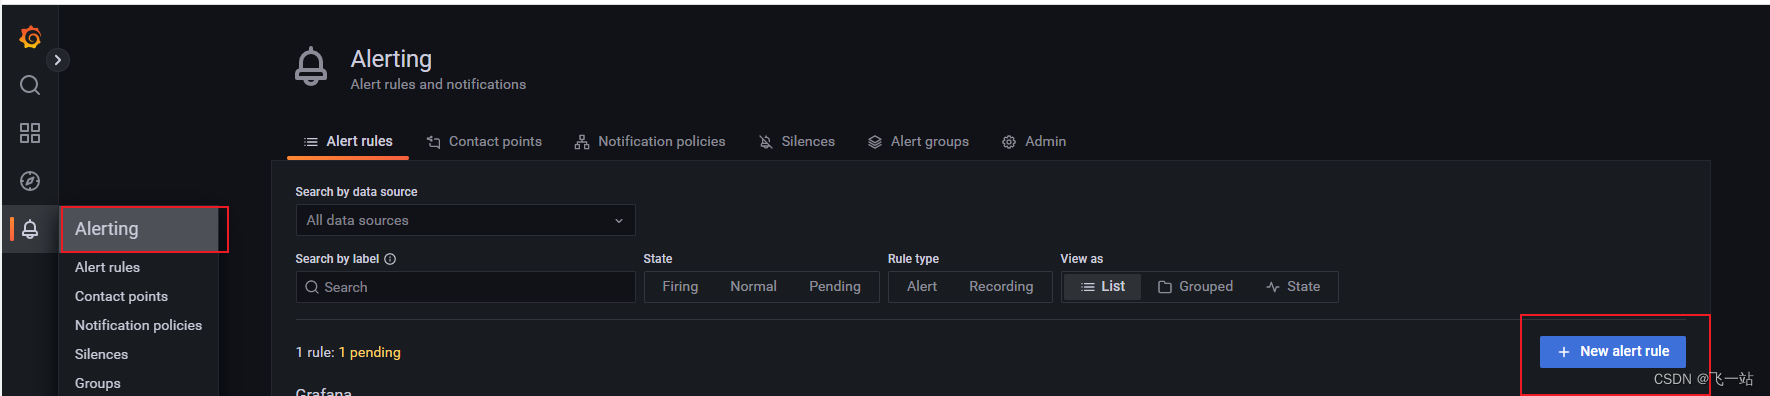
配置警告规则
- 新增一个警告规则
- 配置规则和详情如下:
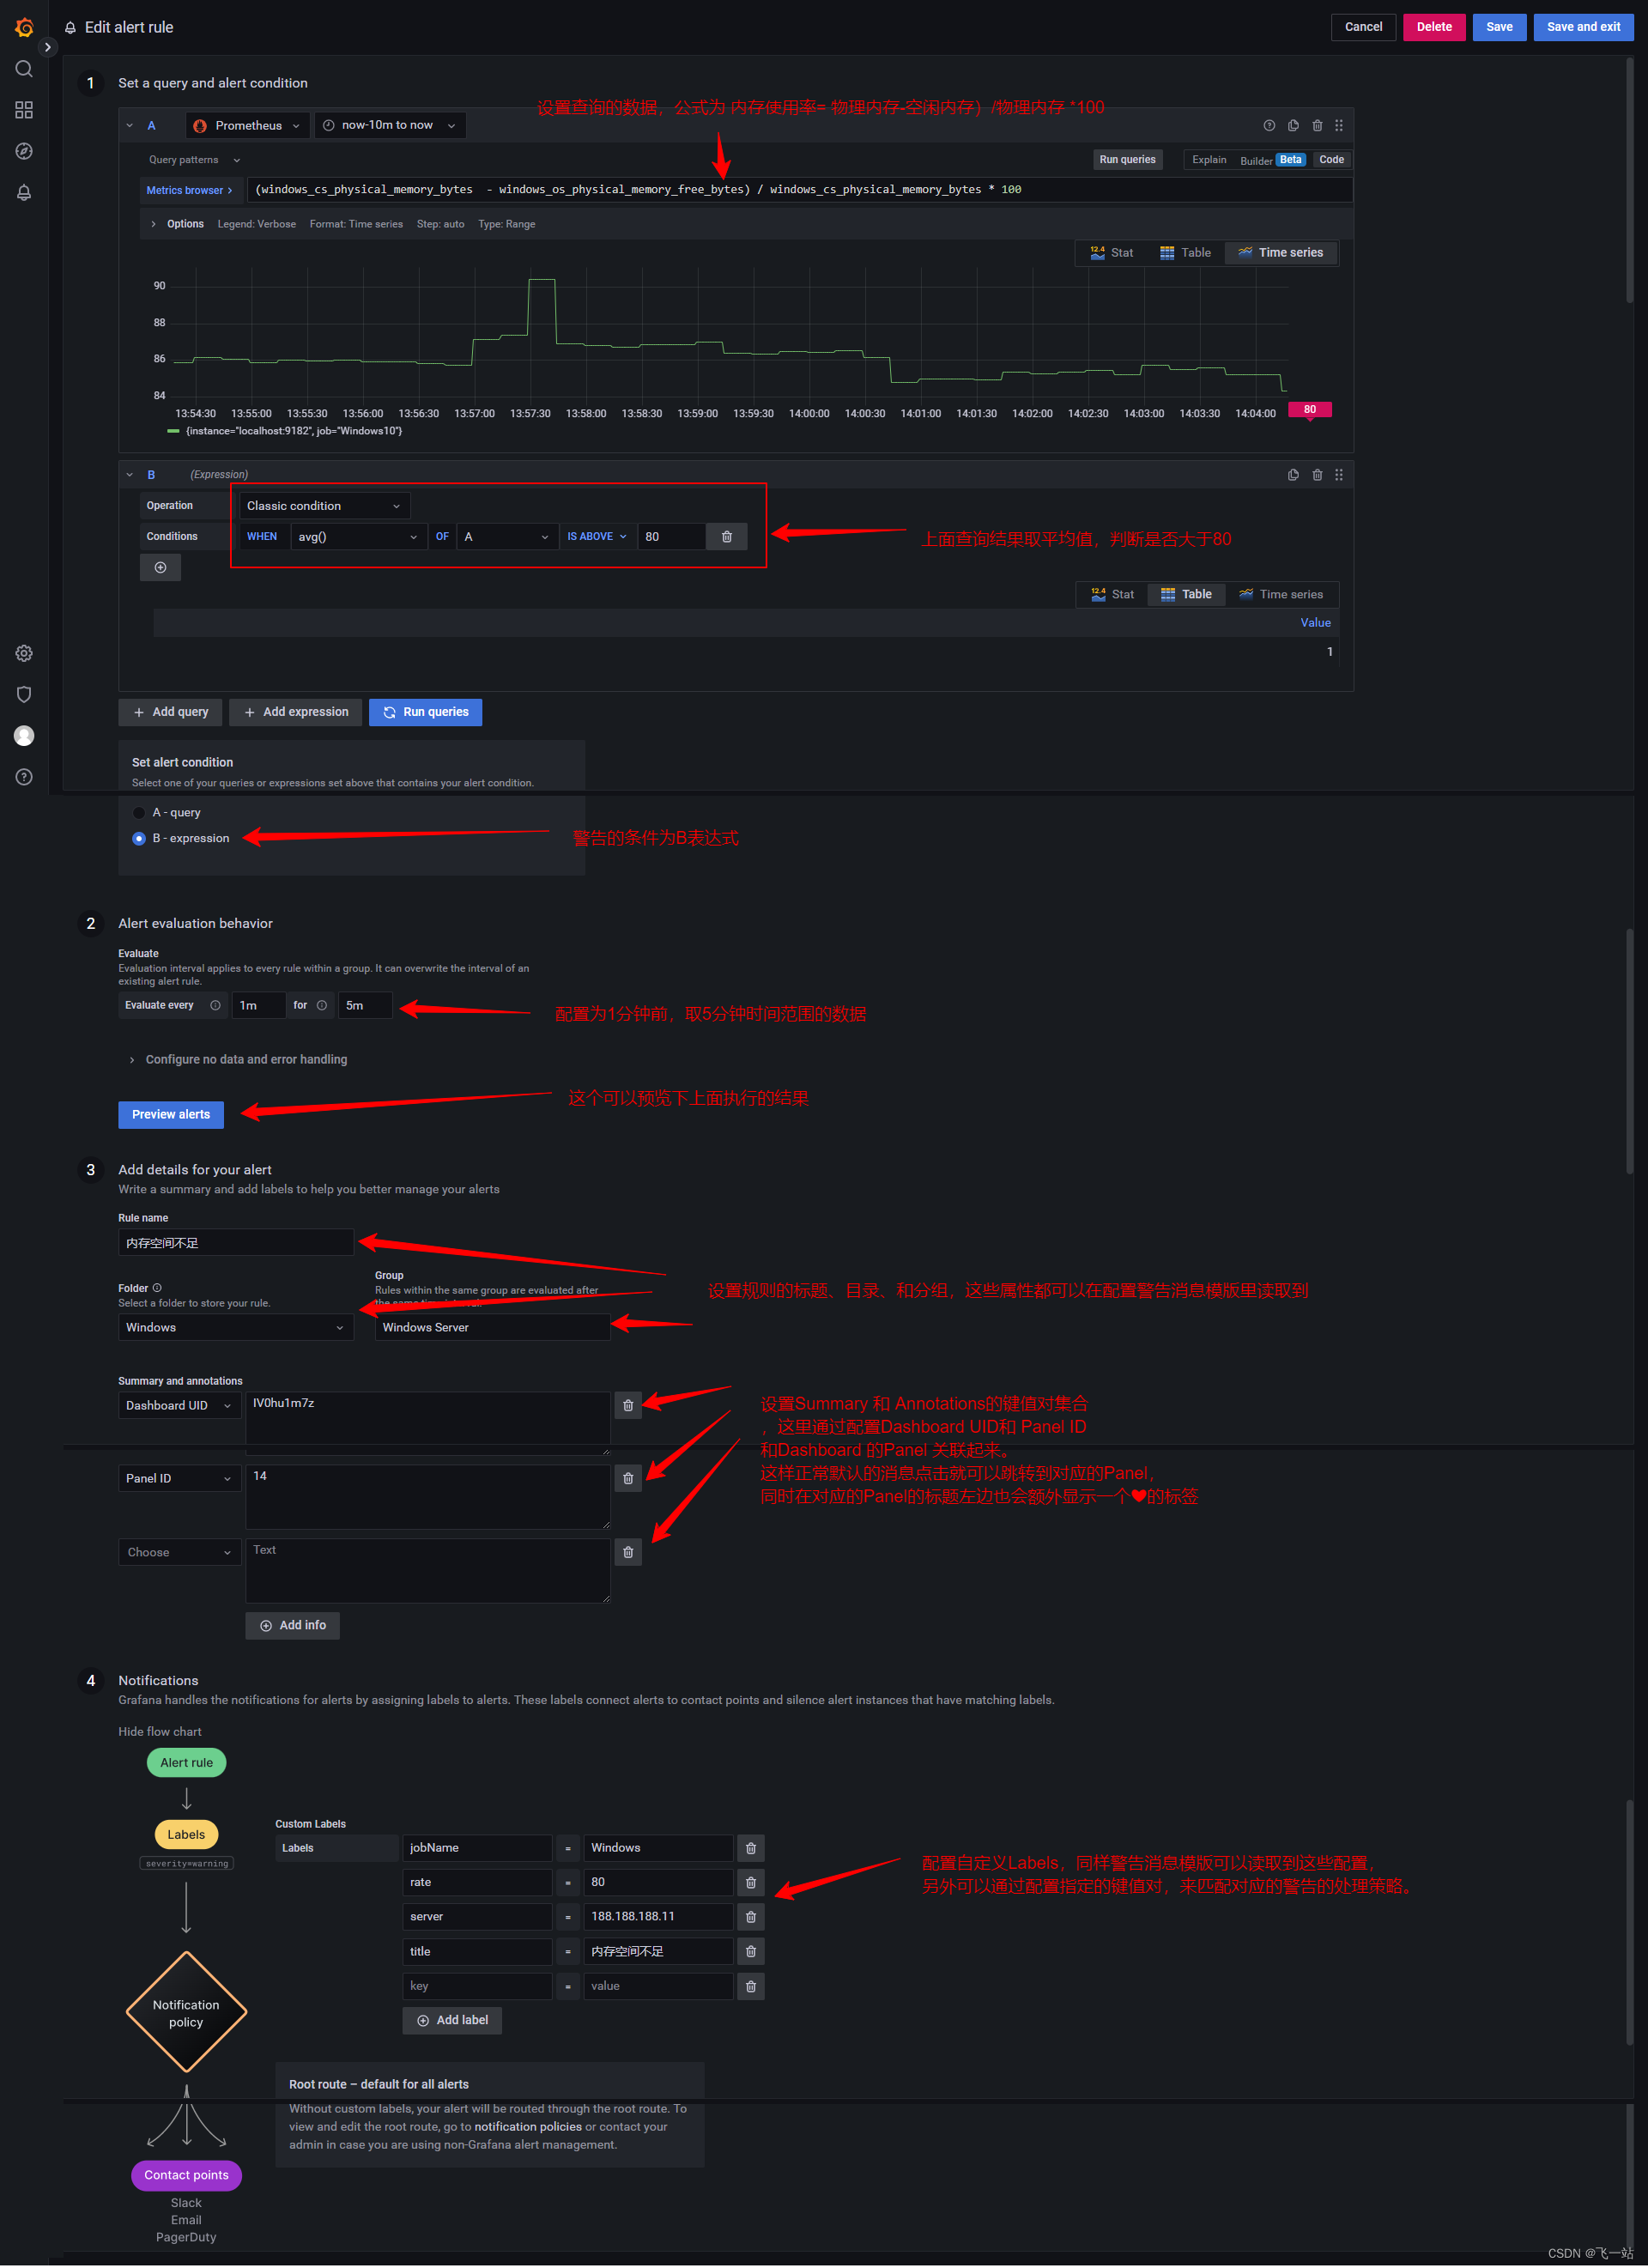
- 点击右上角的保存并退出完成警告规则的配置
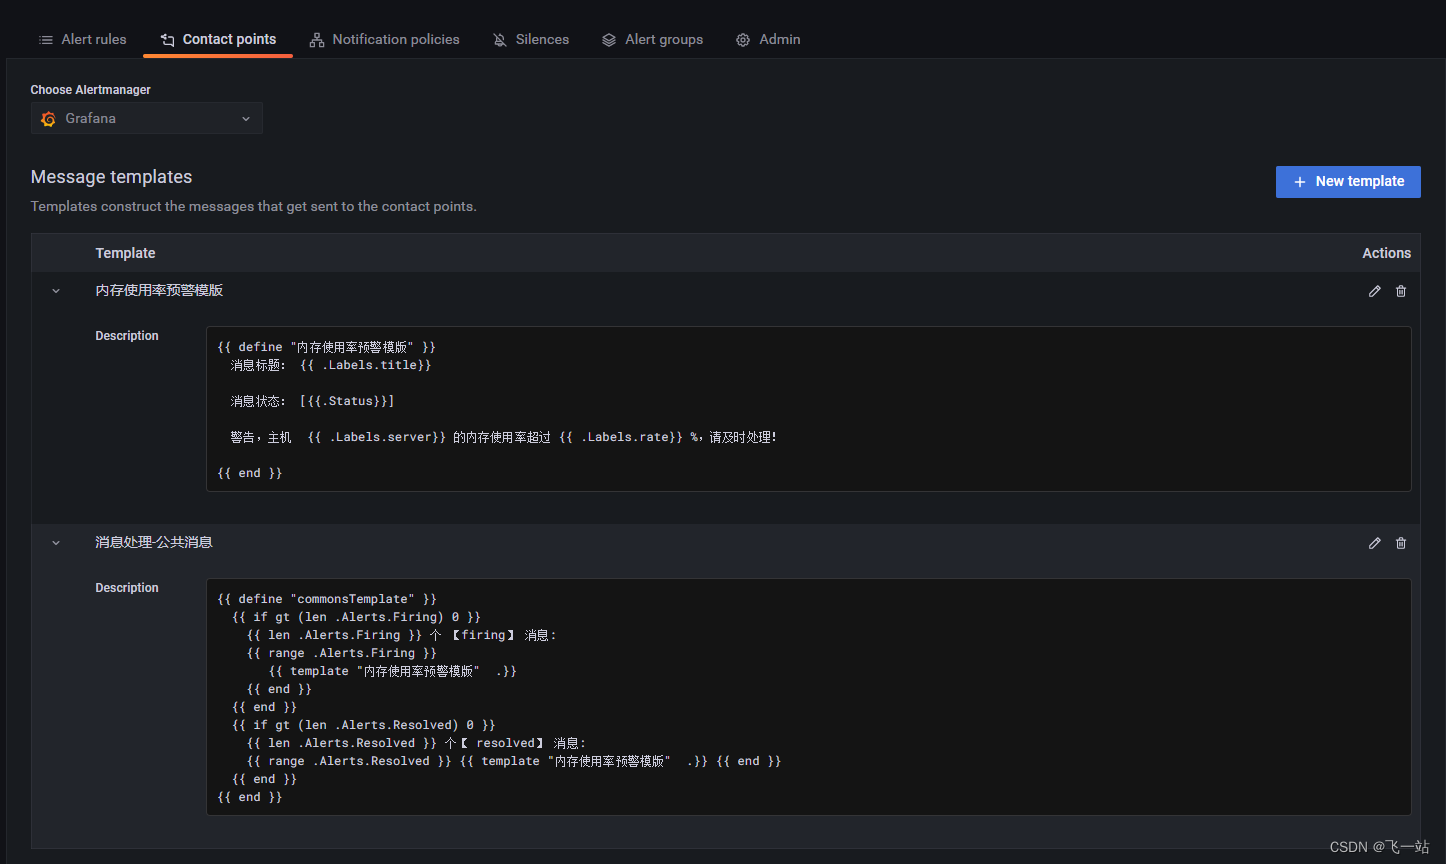
配置警告消息模版 Message templates
配置两个消息模版,模版的语法为go。
语法参考网站:https://pkg.go.dev/text/template
简单的例子:https://grafana.com/docs/grafana/latest/alerting/contact-points/message-templating/example-template/
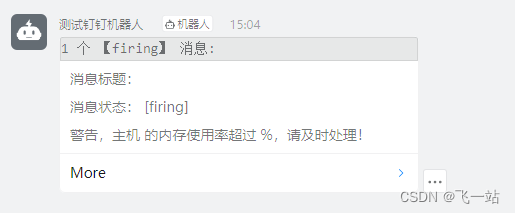
{{ define "内存使用率预警模版" }}
  消息标题: {{ .Labels.title}}

  消息状态: [{{.Status}}]

  警告,主机  {{ .Labels.server}} 的内存使用率超过 {{ .Labels.rate}} %,请及时处理!

{{ end }}
{{ define "commonsTemplate" }}
  {{ if gt (len .Alerts.Firing) 0 }}
    {{ len .Alerts.Firing }} 个 【firing】 消息:
    {{ range .Alerts.Firing }}
       {{ template "内存使用率预警模版"  .}}
    {{ end }}
  {{ end }}
  {{ if gt (len .Alerts.Resolved) 0 }}
    {{ len .Alerts.Resolved }} 个【 resolved】 消息:
    {{ range .Alerts.Resolved }} {{ template "内存使用率预警模版"  .}} {{ end }}
  {{ end }}
{{ end }}
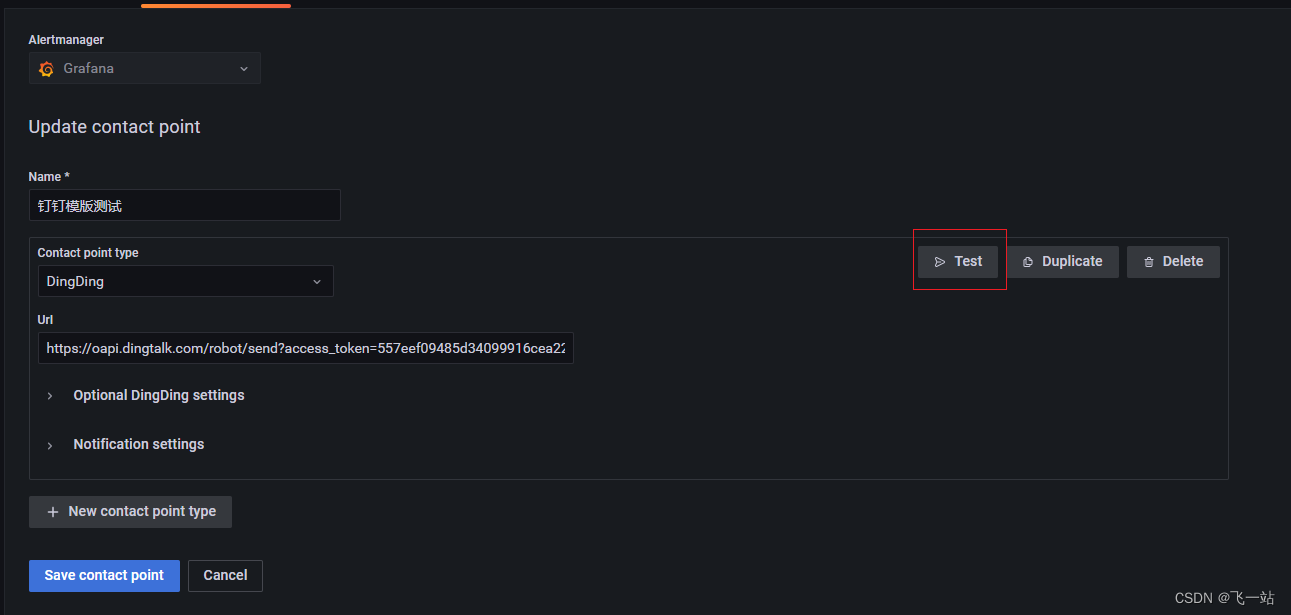
配置一个钉钉通知的方式 Contact points
- 点击
New contact point新增一个通知的方式

- 配置规则如下,点击保存完成配置
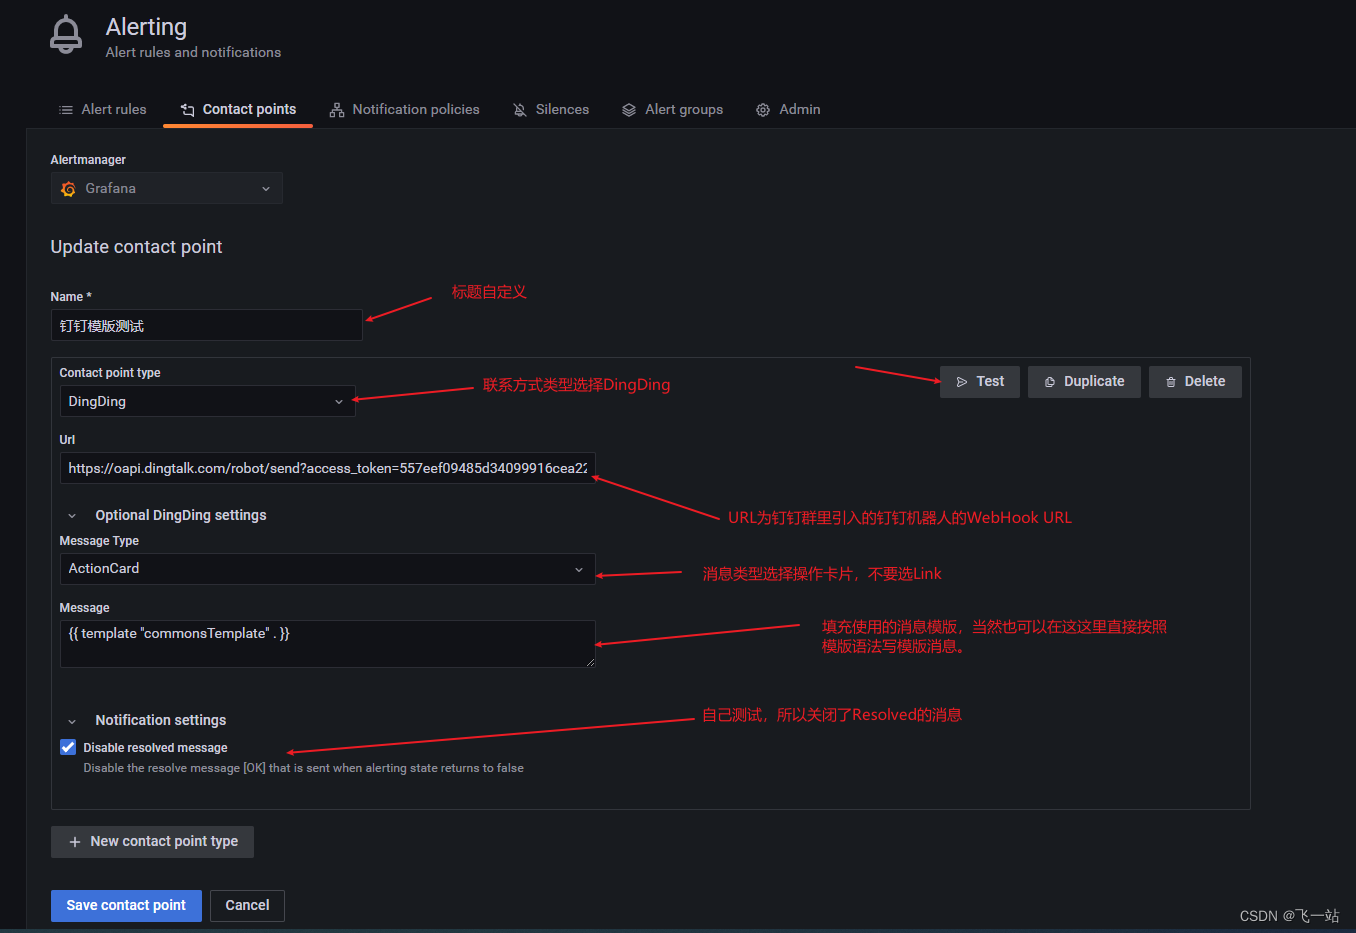
钉钉配置的URL为钉钉群机器人的的WebHook URL ,URL 获取的方式如下
钉钉群的机器人引入处理
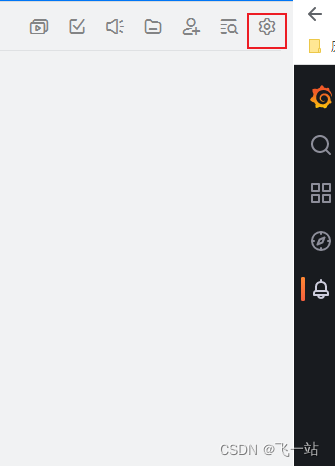
随便找一个钉钉群(最好新建一个),然后在PC端操作。
- 点击群设置
- 点击智能群助手

- 点击添加机器人

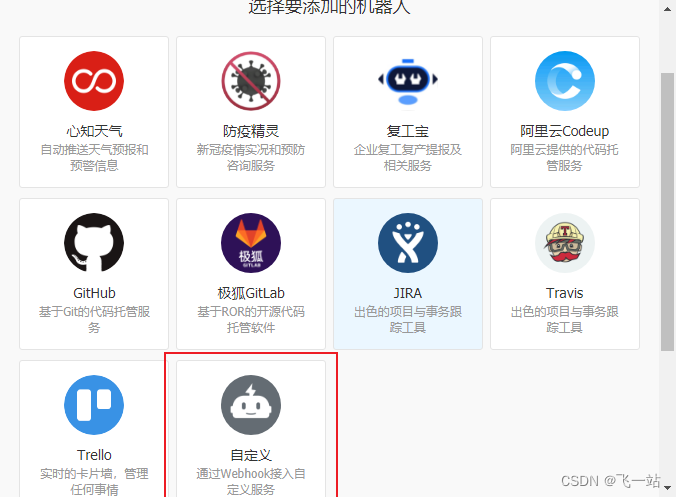
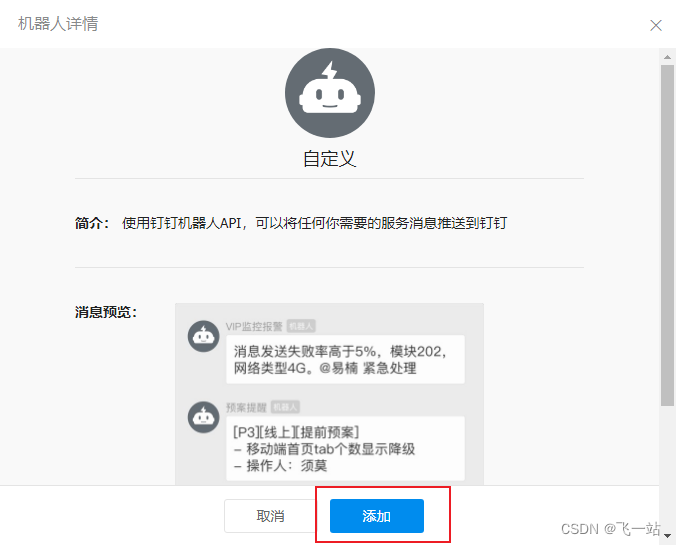
- 选择添加机器人

- 选择
自定义的机器人
- 点击添加
- 填写好机器人的配置,点击完成就添加好了机器人了
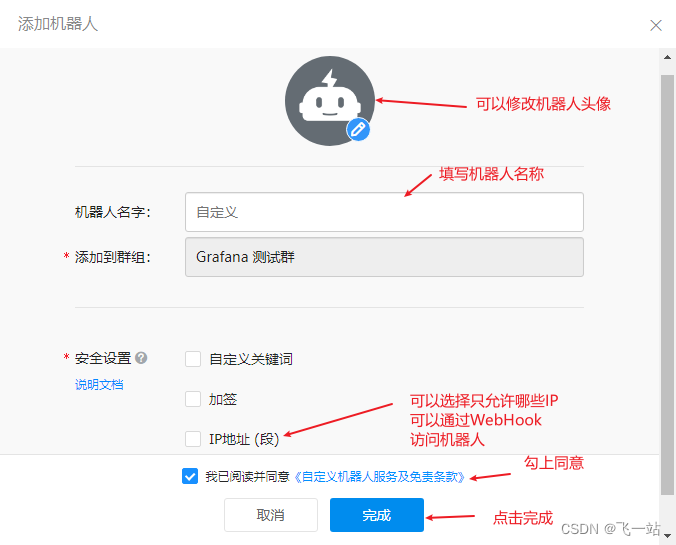
- 复制 机器人的WebHook地址。没复制也没关系,后面可以在群机器人里看到。

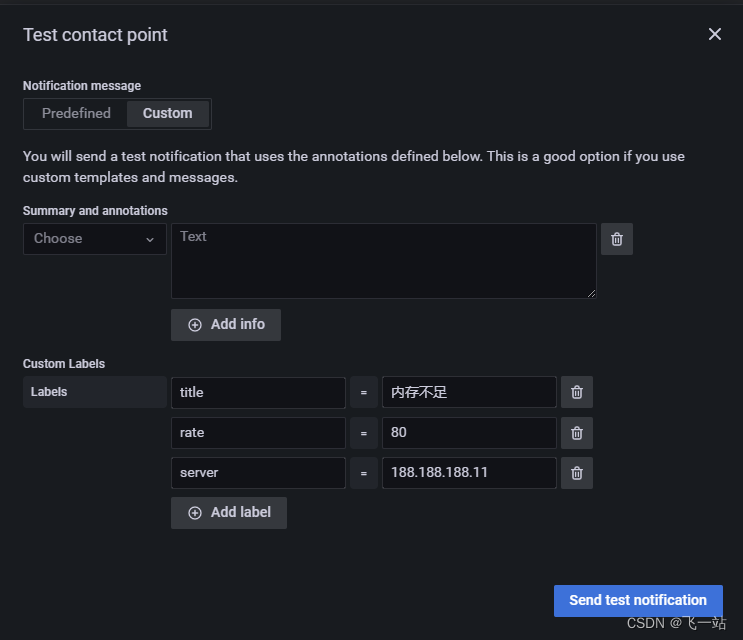
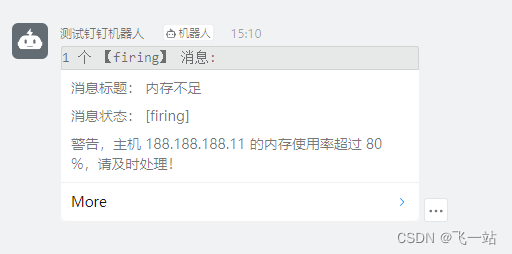
测试联系方式的有效性
点击Test 按钮,打开联系方式的测试界面
可以测试发送预定义的消息
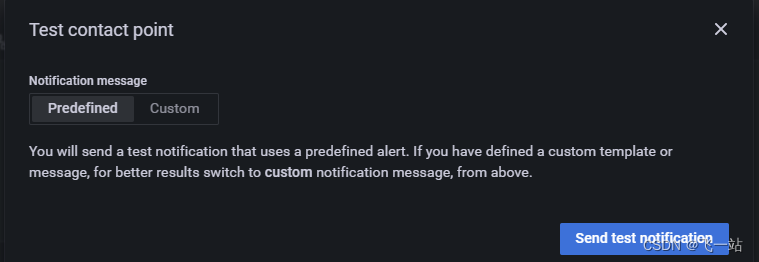
也可以测试自定义的消息,也就是可以填写Summary and annotations 和Custom Lables
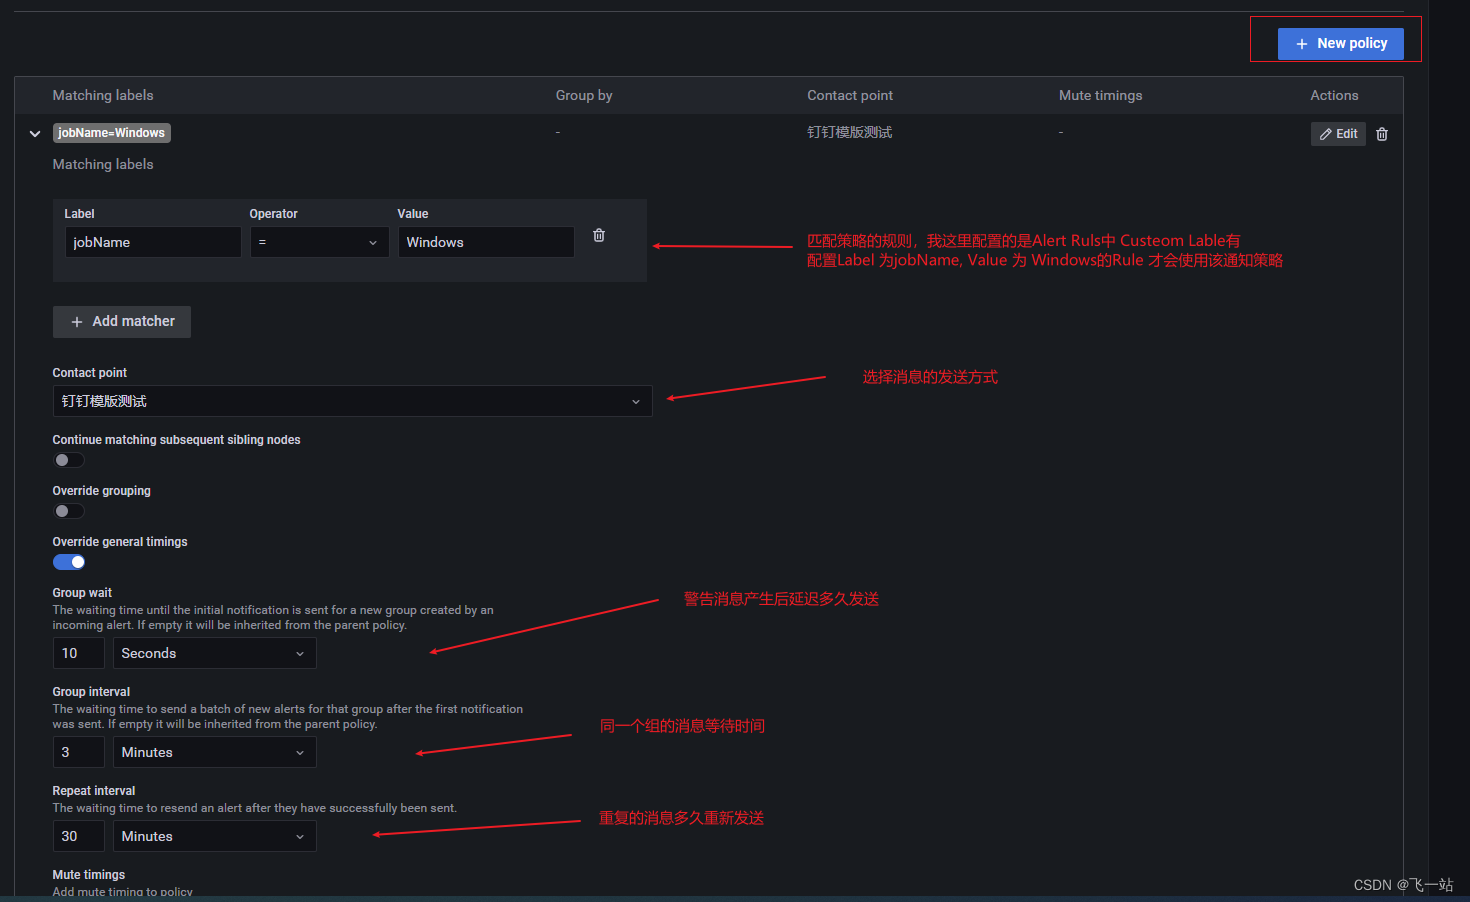
配置一个通知策略Notification policies
两种方式:
1、直接修改默认针对所有警告的策略Root policy - default for all alerts,
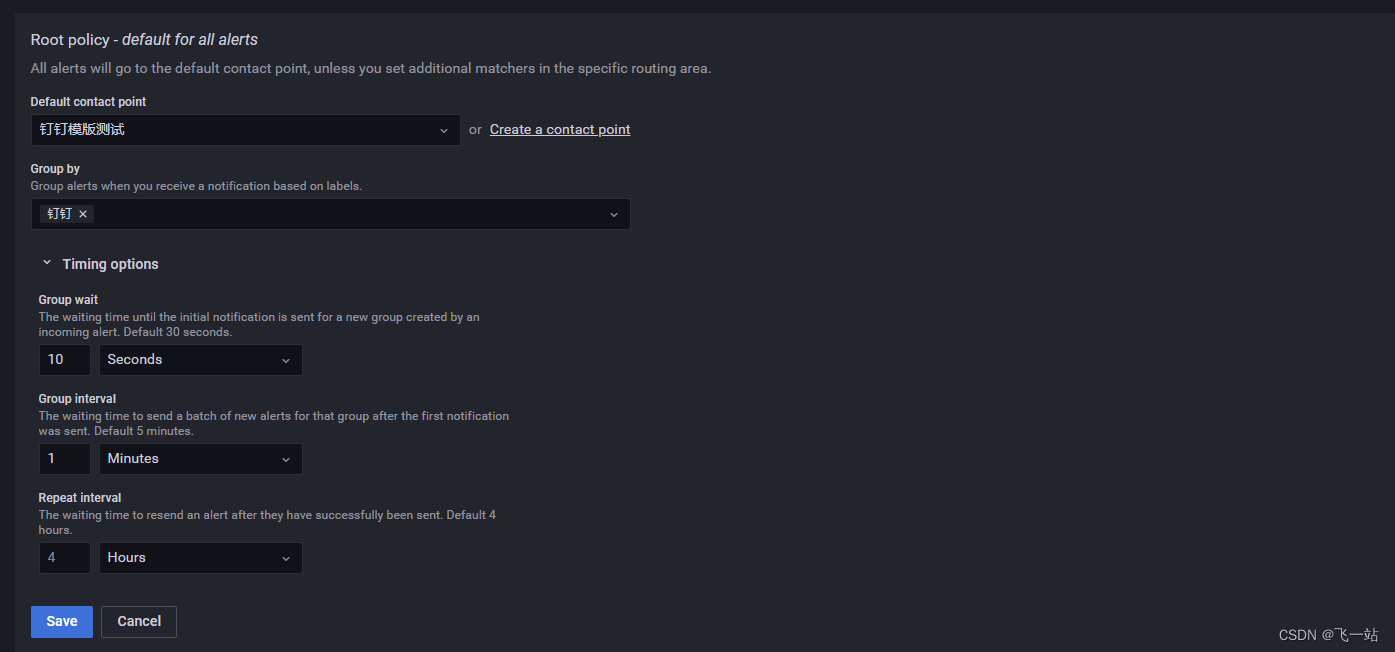
2、自定义策略New Policy,通过匹配警告规则的配置的自定义的Labels来决定使用哪个策略。
验证最后的效果
后续待处理的事项
- 使用
prometheus的alertmanager来实现报警功能 - 报警功能的参数根据数据动态获取,比如服务器实例名称
- 怎么临时关闭报警功能?
- 自定义业务
Exporter来走一遍以上的流程 - 使用
Pushgateway来处理不能被动拉取,只能主动推送的场景。 prometheus数据落地
相关网站
prometheus 下载中心(包括prometheus 、alertmanager、一些常用的exporter): https://prometheus.io/download/
windows_exporter : https://github.com/prometheus-community/windows_exporter
Prometheus Monitoring Community: https://github.com/prometheus-community
Awesome Prometheus alerts: https://awesome-prometheus-alerts.grep.to/alertmanager
grafana download: https://grafana.com/grafana/download?platform=windows
grafana dashboard:https://grafana.com/grafana/dashboards/
grafana plugins:https://grafana.com/plugins


 411
411

 被折叠的 条评论
为什么被折叠?
被折叠的 条评论
为什么被折叠?
 到【灌水乐园】发言


