


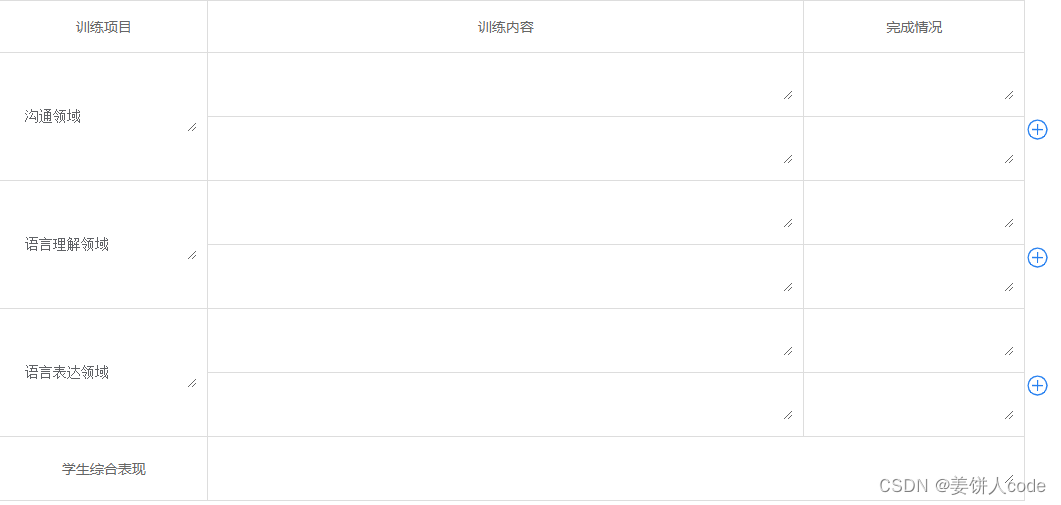
效果图如下:
后端给的数据结构如下:
child: [
          {
            type: "沟通领域",
            narrateOne: null,
            completeType: null, //完成情况
          },
          {
            type: "沟通领域",
            narrateOne: null,
            completeType: null, //完成情况
          },
          {
            type: "语言理解领域",
            narrateOne: null,
            completeType: null, //完成情况
          },
          {
            type: "语言理解领域",
            narrateOne: null,
            completeType: null, //完成情况
          },
          {
            type: "语言表达领域",
            narrateOne: null,
            completeType: null, //完成情况
          },
          {
            type: "语言表达领域",
            narrateOne: null,
            completeType: null, //完成情况
          },
        ],
处理函数如下:
//util.js中
//渲染表格传list,新增行传list和row
export function projectTargetList(list, row) {
    let newList = []
    if (row) {
        list.push(row)
    }
    // 按照 type 属性分类
    let classifiedObject = list.reduce(function (acc, obj) {
        let key = obj.type;
        if (!acc[key]) {
            acc[key] = { type: key, child: [] };
        }
        acc[key].child.push(obj);
        return acc;
    }, {});
    let tempList = Object.values(classifiedObject);
    // console.log(tempList);
    //计算startRow和endRow值
    let tempList2 = tempList.reduce(function (acc, obj, index) {
        let startRow = (index == 0) ? 0 : acc[index - 1].endRow; // 计算 startRow
        let endRow = startRow + obj.child.length; // 计算 endRow
        let rows = obj.child.length
        obj.startRow = startRow;
        obj.endRow = endRow;
        obj.rows = rows
        acc.push(obj);
        return acc;
    }, []);
    // console.log(tempList2);
    tempList2.forEach((item, index) => {
        item.child.forEach((citem, cindex) => {
            citem.startRow = item.startRow
            citem.endRow = item.endRow
            citem.rows = item.rows
            newList.push(citem)
        })
    })
    // console.log(newList);
    return newList
}
使用:
//目标vue页面中
<template>
<table border="0" cellspacing="0" cellpadding="0">
        <tr>
          <td>训练项目</td>
          <td>训练内容</td>
          <td>完成情况</td>
        </tr>
        <tr v-for="(item, index) in targetList" :key="index">
          <td v-if="item.startRow == index" :rowspan="item.rows">
            <el-input type="textarea" v-model="item.type" autosize></el-input>
          </td>
          <td>
            <el-input
              type="textarea"
              v-model="item.narrateOne"
              autosize
            ></el-input>
          </td>
          <td>
            <el-input
              type="textarea"
              v-model="item.completeType"
              autosize
            ></el-input>
          </td>
          <div v-if="item.endRow - 1 == index" @click="addrow(item, index)">
            <img
              src="../../../../assets/images/addrows.svg"
              alt=""
              style="width: 25px"
            />
          </div>
        </tr>
      </table>
</template>
import { projectTargetList } from "@utils/func";
data() {
    return {
     targetList:[],
    };
},
created() {
//child为请求获取的数据
const child=[
          {
            type: "沟通领域",
            narrateOne: null,
            completeType: null, //完成情况
          },
          {
            type: "沟通领域",
            narrateOne: null,
            completeType: null, //完成情况
          },
          {
            type: "语言理解领域",
            narrateOne: null,
            completeType: null, //完成情况
          },
          {
            type: "语言理解领域",
            narrateOne: null,
            completeType: null, //完成情况
          },
          {
            type: "语言表达领域",
            narrateOne: null,
            completeType: null, //完成情况
          },
          {
            type: "语言表达领域",
            narrateOne: null,
            completeType: null, //完成情况
          },
        ]
   this.targetList=projectTargetList(child,null)
  },
methods: {
//新增行
addrow(item, index) {
      let crow = {
        type: item.type,
        narrateOne: null,
        completeType: null,
      };
      this.targetList= projectTargetList(this.targetList, crow);
    },
}
学习笔记:
根据type合并表格,核心思想是计算出该类type的开始合并行(startRow)、结尾合并行(endRow)、该type的数据条数(rows),再结合v-if,rowspan进行渲染。欢迎交流指教~


 646
646

 被折叠的 条评论
为什么被折叠?
被折叠的 条评论
为什么被折叠?
 到【灌水乐园】发言


