


 如图
如图
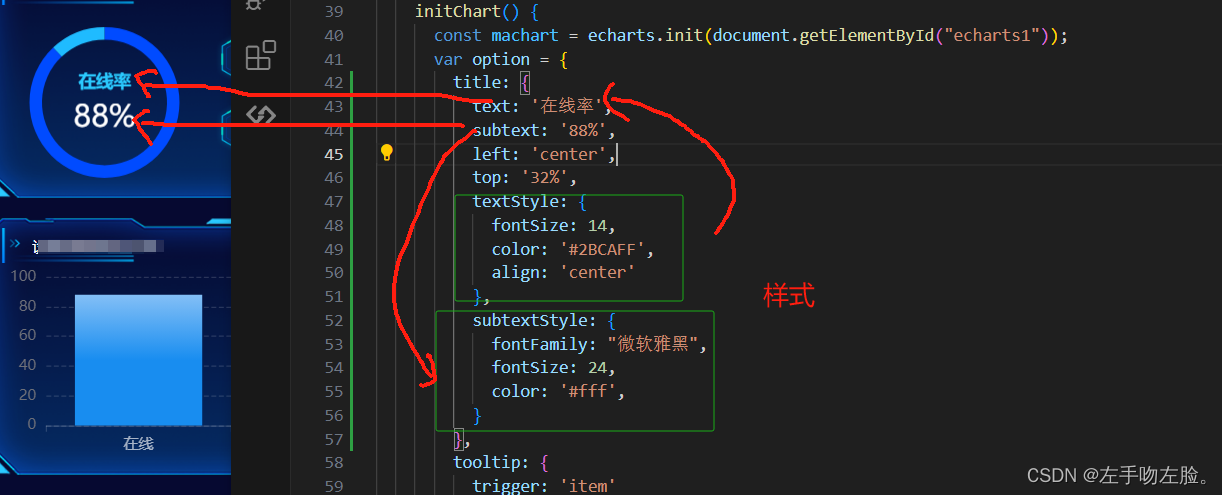
一、添加title
 var option = {
        title: {
          text: '在线率',
          subtext: '88%',
          left: 'center',
          top: '32%',
          textStyle: {
            fontSize: 14,
            color: '#2BCAFF',
            align: 'center'
          },
          subtextStyle: {
            fontFamily: "微软雅黑",
            fontSize: 24,
            color: '#fff',
          }
        },
}
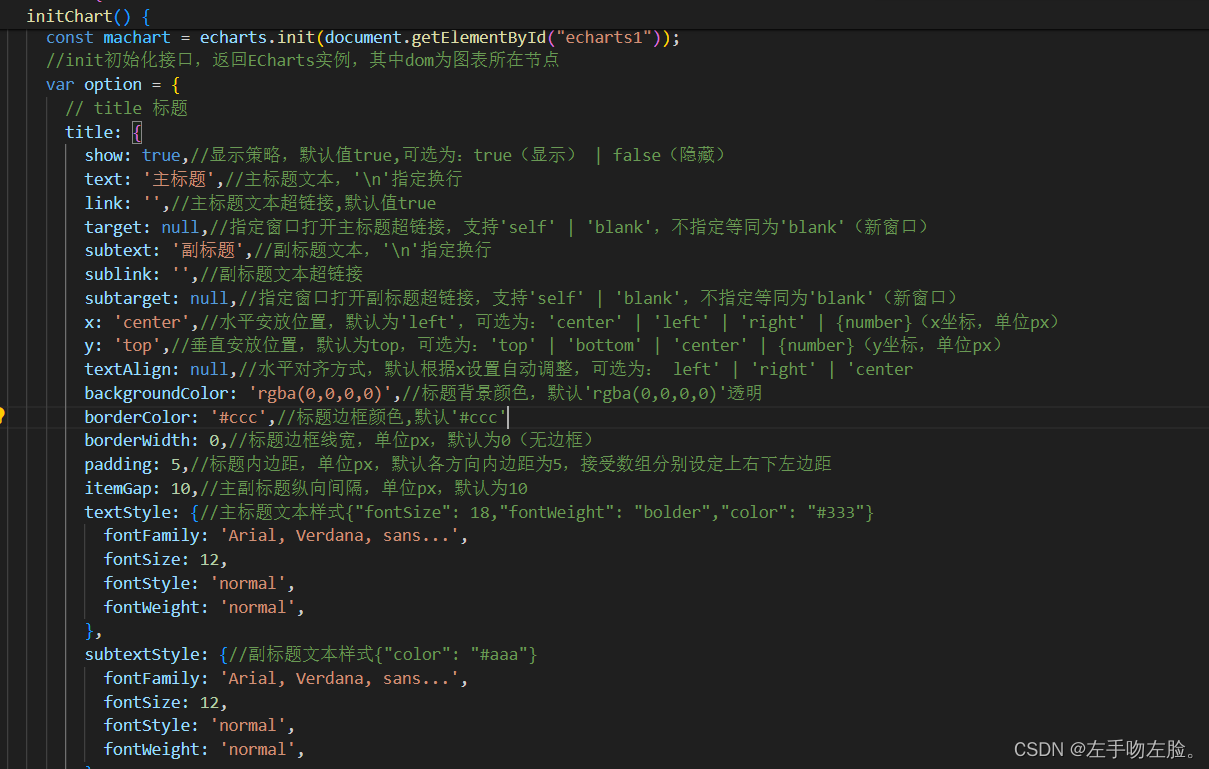
下图是 title配置:
<template>
  <div id="echarts1"></div>
</template>

<script>
import * as echarts from 'echarts';
export default {

  data() {
    return {
      echartList: [
        {
          name: '在线',
          value: '88',
        },
        {
          name: '离线',
          value: '12',
        }
      ],

    };
  },
  mounted() {
    this.initChart()
  },
  methods: {
    initChart() {
      const machart = echarts.init(document.getElementById("echarts1"));
      //init初始化接口,返回ECharts实例,其中dom为图表所在节点
      var option = {
        // title 标题
        title: {
          show: true,//显示策略,默认值true,可选为:true(显示) | false(隐藏)
          text: '主标题',//主标题文本,'\n'指定换行
          link: '',//主标题文本超链接,默认值true
          target: null,//指定窗口打开主标题超链接,支持'self' | 'blank',不指定等同为'blank'(新窗口)
          subtext: '副标题',//副标题文本,'\n'
最低0.47元/天 解锁文章


 991
991

 被折叠的 条评论
为什么被折叠?
被折叠的 条评论
为什么被折叠?
 到【灌水乐园】发言


