


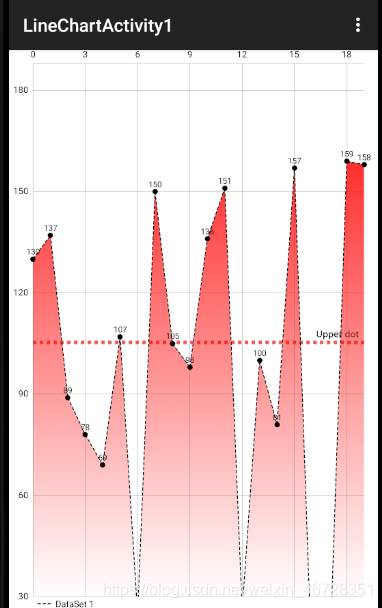
效果图:
MPAndroidChart绘图库新手教程,直接复制使用,内容自己消化。
1、准备工作
添加依赖,把下面两句话分别放在两个build.gradle中的详细位置。
allprojects {
 maven { url "https://jitpack.io"      //根目录下的build.gradle
}
dependencies {
    implementation 'com.github.PhilJay:MPAndroidChart:v3.0.3'   //APP目录下的build.gradle
}
MPAndroidChart-v3.0.3.jar 文件的优快云下载,有需要的也可以自己去找
https://download.youkuaiyun.com/download/weixin_46728351/15634047
2、在布局中引入一个绘图控件,开始绘图
<?xml version="1.0" encoding="utf-8"?>
<LinearLayout xmlns:android="http://schemas.android.com/apk/res/android"
    xmlns:app="http://schemas.android.com/apk/res-auto"
    xmlns:tools="http://schemas.android.com/tools"
    android:layout_width="match_parent"
    android:layout_height="match_parent"
    android:orientation="vertical">
<com.github.mikephil.charting.charts.LineChart
    android:layout_width="wrap_content"
    android:layout_height="wrap_content">
</com.github.mikephil.charting.charts.LineChart>
</LinearLayout>
3、创建相应变量,绑定控件进行操作。
 private LineChart chart;
 chart = findViewById(R.id.chart1);
	LineChartDraw lineChartDraw=new LineChartDraw(chart,getContext());
	lineChartDraw.linechart_draw(list,list.size());
下面是封装好的类,直接给值就可以 素材比较简单可以自己设置属性
   /**
     * list 绘图内部使用变量FLoat型,更改为其他类型需要改chart变量类型
     *count 显示个数
     */
 public class LineChartDraw {
    private LineChart chart;
    private Context context;

    /**
     *
     * @param lineChart  绑定ID后的变量
     * @param context    当前上下文
     */
    public LineChartDraw(LineChart lineChart, Context context){
        this.chart=lineChart;
        this.context=context;
    }
 /**
     *
     * @param value  数据集
     * @param count  size
     */
    public void linechart_draw(List <Float> value, int count)
    {
        Float[] ss=new Float[value.size()];
        value.toArray(ss);
        for(int j=1;j<ss.length;j++){
            if(ss[0]>ss[j]){
                ss[0]=ss[j];
            }
            if(ss[1]<ss[j]){
                ss[1]=ss[j];
            }
        }
        //演示绑定可删
        // background color
        chart.setBackgroundColor(Color.WHITE);
        // disable description text
        chart.getDescription().setEnabled(false);
        // enable touch gestures
        chart.setTouchEnabled(true);

        chart.setDrawGridBackground(false);
        // create marker to display box when values are selec

        // enable scaling and dragging
        chart.setDragEnabled(true);
        chart.setScaleEnabled(true);
        // chart.setScaleXEnabled(true);
        // chart.setScaleYEnabled(true);

        // force pinch zoom along both axis
        chart.setPinchZoom(true);


        XAxis xAxis;
        // // X-Axis Style // //
        xAxis = chart.getXAxis();

        // vertical grid lines


        YAxis yAxis;
        // // Y-Axis Style // //
        yAxis = chart.getAxisLeft();

        // disable dual axis (only use LEFT axis)
        chart.getAxisRight().setEnabled(false);

        // horizontal grid lines


        // axis range
        yAxis.setAxisMaximum(ss[1]);
        yAxis.setAxisMinimum(ss[0]);


        // // Create Limit Lines // //
        LimitLine ll1 = new LimitLine(ss[1]*2/3, "Upper dot");
        ll1.setLineWidth(4f);
        ll1.enableDashedLine(10f, 10f, 0f);
        ll1.setLabelPosition(LimitLine.LimitLabelPosition.RIGHT_TOP);
        ll1.setTextSize(10f);
        ll1.setTypeface(Typeface.SERIF);

        LimitLine ll2 = new LimitLine(ss[0]*3/2, "Lower dot");
        ll2.setLineWidth(4f);
        ll2.enableDashedLine(10f, 10f, 0f);
        ll2.setLabelPosition(LimitLine.LimitLabelPosition.RIGHT_BOTTOM);
        ll2.setTextSize(10f);
        ll2.setTypeface(Typeface.DEFAULT);

        // draw limit lines behind data instead of on top
        yAxis.setDrawLimitLinesBehindData(true);
        xAxis.setDrawLimitLinesBehindData(true);

        // add limit lines
        yAxis.addLimitLine(ll1);
        yAxis.addLimitLine(ll2);
        //xAxis.addLimitLine(llXAxis);

        setData(count, value);

        // draw points over time
        chart.animateX(0);

        // get the legend (only possible after setting data)
        Legend l = chart.getLegend();

        // draw legend entries as lines
        l.setForm(Legend.LegendForm.LINE);
    }

    private void setData(int count, List <Float> values) {
        ArrayList <Entry> list=new ArrayList<>();
        for(int i=0;i<count;i++)
        {
            list.add(new Entry(i,values.get(i)));
        }

        LineDataSet set1;

        if (chart.getData() != null &&
                chart.getData().getDataSetCount() > 0) {
            set1 = (LineDataSet) chart.getData().getDataSetByIndex(0);
            set1.setValues(list);
            set1.notifyDataSetChanged();
            chart.getData().notifyDataChanged();
            chart.notifyDataSetChanged();
        } else {
            // create a dataset and give it a type
            set1 = new LineDataSet(list, "DataSet 1");

            set1.setDrawIcons(false);

            // draw dashed line
            set1.enableDashedLine(10f, 5f, 0f);

            // black lines and points
            set1.setColor(Color.BLACK);
            set1.setCircleColor(Color.BLACK);

            // line thickness and point size
            set1.setLineWidth(1f);
            set1.setCircleRadius(3f);

            // draw points as solid circles
            set1.setDrawCircleHole(false);

            // customize legend entry
            set1.setFormLineWidth(1f);
            set1.setFormLineDashEffect(new DashPathEffect(new float[]{10f, 5f}, 0f));
            set1.setFormSize(15.f);

            // text size of values
            set1.setValueTextSize(9f);

            // draw selection line as dashed
            set1.enableDashedHighlightLine(10f, 5f, 0f);

            // set the filled area
            set1.setDrawFilled(true);
            set1.setFillFormatter(new IFillFormatter() {
                @Override
                public float getFillLinePosition(ILineDataSet dataSet, LineDataProvider dataProvider) {
                    return chart.getAxisLeft().getAxisMinimum();
                }
            });
            // set color of filled area
            ArrayList<ILineDataSet> dataSets = new ArrayList<>();
            dataSets.add(set1); // add the data sets
            // create a data object with the data sets
            LineData data = new LineData(dataSets);
            // set data
            chart.setData(data);
        }
    }
}


 被折叠的 条评论
为什么被折叠?
被折叠的 条评论
为什么被折叠?
 到【灌水乐园】发言


