


 本文介绍了如何在 Echarts 图表中处理横轴标签过长导致的文字重叠问题,通过设置 Echarts 的配置项实现横轴文字自动换行,确保图表的清晰易读。
let option = {
xAxis: {
type: 'category',
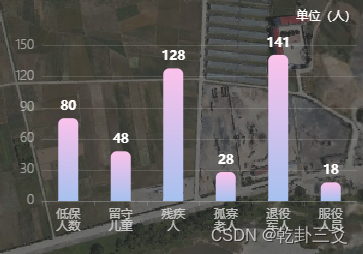
data: ['低保人数', '留守儿童', '残疾人', '孤寡老人', '退役军人', '服役人员'],
axisLine: {
lineStyle: {
color: "rgba(225, 225, 225, 0.15)"
}
},
axisLabel: {
interval: 0,
color: "rgba(225, 225, 225, 0.8)",
formatter: function (value) {
var ret = "";//拼接加\n返回的类目项
var maxLength = 2;//每项显示文字个数
var valLength = value.length;//X轴类目项的文字个数
var rowN = Math.ceil(valLength / maxLength); //类目项需要换行的行数
if (rowN > 1)//如果类目项的文字大于5,
{
for (var i = 0; i < rowN; i++) {
var temp = "";//每次截取的字符串
var start = i * maxLength;//开始截取的位置
var end = start + maxLength;//结束截取的位置
//这里也可以加一个是否是最后一行的判断,但是不加也没有影响,那就不加吧
temp = value.substring(start, end) + "\n";
ret += temp; //凭借最终的字符串
}
return ret;
}
else {
return value;
}
}
}
},
grid: {
top: "6%",
left: "10%",
right: "0",
bottom: "20%"
},
yAxis: {
type: 'value',
splitLine: { //网格线
show: true,
lineStyle: {
// 使用深浅的间隔色
color: "rgba(225, 225, 225, 0.15)"
}
},
axisLine: {
lineStyle: {
color: "rgba(225, 225, 225, 0.6)"
}
},
axisLabel: {
color: "rgba(225, 225, 225, 0.6)",
fontSize: ".12rem",
fontWeight: '300'
}
},
series: [
{
data: [80, 48, 128, 28, 141, 18],
type: 'bar',
// 设置柱子颜色
barWidth: 20,
color: {
type: 'linear',
x: 0, //右
y: 0, //下
x2: 0, //左
y2: 1, //上
colorStops: [
{
offset: 0,
color: '#fbc2eb' // 0% 处的颜色
},
{
offset: 1,
color: '#a6c1ee' // 100% 处的颜色
}
]
},
// 在柱子上面设置相对应的数字,
itemStyle: {
normal: {
label: {
show: true,
position: 'top',
// 文字的颜色,字体大小,字体加深
textStyle: {
color: '#fff',
fontSize: '0.12rem',
fontWeight: 'bold'
}
},
barBorderRadius: [6, 6, 0, 0]
}
},
}
]
}
let charts = echarts.init(document.getElementById('industryCharts'));
charts.setOption(option);
window.addEventListener("resize", () => {
charts.resize();
});


 被折叠的 条评论
为什么被折叠?
被折叠的 条评论
为什么被折叠?
 到【灌水乐园】发言


