


今天python学习了条形图,博主健忘,所以更新到博客来.
# 条形图--->bar
# 导入绘图包
import matplotlib.pyplot as plt
import numpy as np
# 正常显示中文字符
plt.rcParams['font.sans-serif'] = ['SimHei']
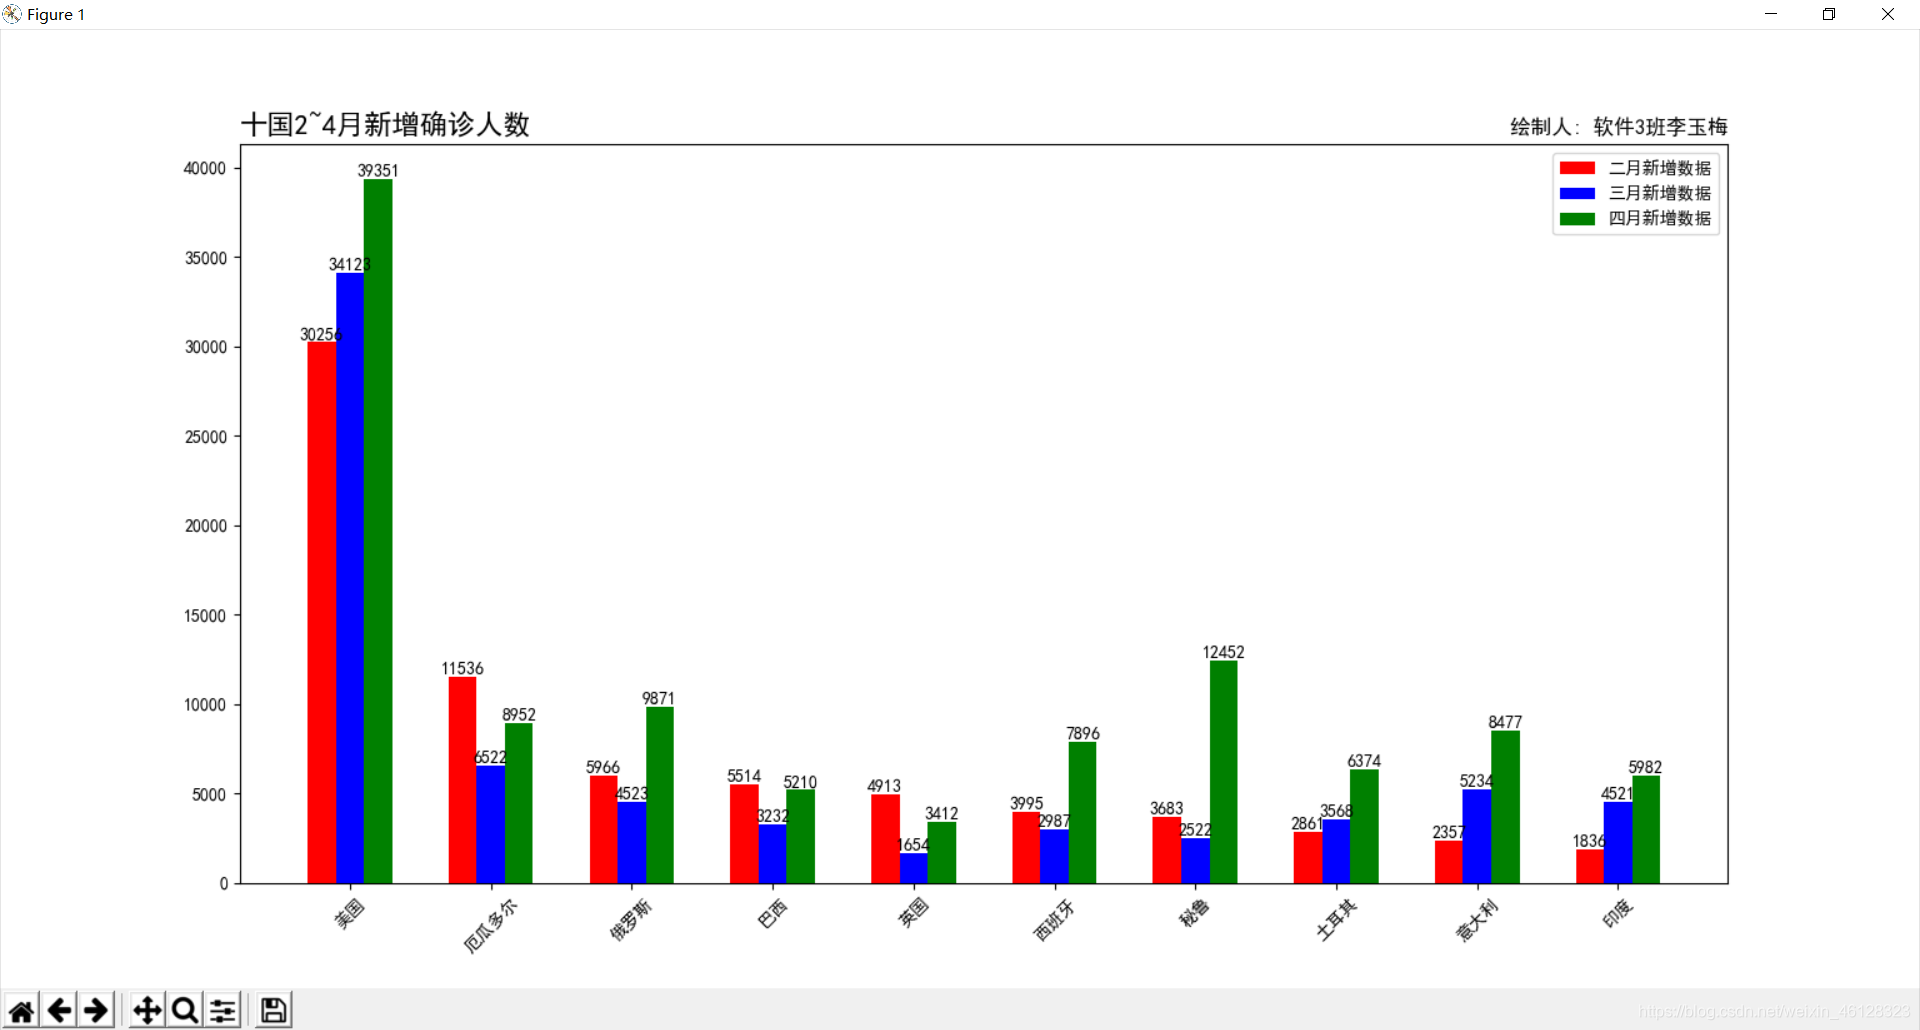
x = ['美国', '厄瓜多尔', '俄罗斯', '巴西', '英国', '西班牙', '秘鲁', '土耳其', '意大利', '印度']
month_2 = [30256, 11536, 5966, 5514, 4913, 3995, 3683, 2861, 2357, 1836]
month_3 = [34123, 6522, 4523, 3232, 1654, 2987, 2522, 3568, 5234, 4521]
month_4 = [39351, 8952, 9871, 5210, 3412, 7896, 12452, 6374, 8477, 5982]
# 等份划分x轴
x1 = np.arange(len(x))
# 显示2-4月份
plt.bar(x1 - 0.2, month_2, width=0.2, color='red', label='二月新增数据')
plt.bar(x1, month_3, width=0.2, color='blue', label='三月新增数据')
plt.bar(x1 + 0.2, month_4, width=0.2, color='green', label='四月新增数据')
# 设置条形位置居中
plt.xticks(x1, x, rotation=45, fontsize=10)
# 显示图例
plt.legend()
# 序列解包
for a, b in zip(x1 - 0.2, month_2):
plt.text(a, b + 0.1, '%.0f' % b, ha='center', va='bottom')
for a, b in zip(x1, month_3):
plt.text(a, b + 0.1, '%.0f' % b, ha='center', va='bottom')
for a, b in zip(x1 + 0.2, month_4):
plt.text(a, b + 0.1, '%.0f' % b, ha='center', va='bottom')
# 设置标题
plt.title('十国2~4月新增确诊人数', loc='left', fontsize=16)
plt.title('绘制人: 软件3班李玉梅', loc='right', fontsize=12)
plt.show()
执行结果:
声明:鉴于上一篇博文被抄袭严重(好气哦),拿去参考参考或练习没关系 .
但是如果要复制到其他网站发表,请务必标明出处,谢谢大嘎!!!(委屈脸)
# 数据是瞎编的,此代码仅为参考. (为了方便写序列解包的那段代码,所以改进了一下)
# 若有错误,或者更好的代码,欢迎指出与分享!


 被折叠的 条评论
为什么被折叠?
被折叠的 条评论
为什么被折叠?
 到【灌水乐园】发言


