


 本文介绍了在R语言中如何绘制多条线并添加图例。方法一是通过lines和points函数,方法二是使用plot函数的add参数。图例的添加则通过legend函数完成,调整其位置、标签、线条类型、字体大小和散点样式等属性。
R画图
1.一幅图中多条线
方法一 用lines、points函数
超实用画图
方法二
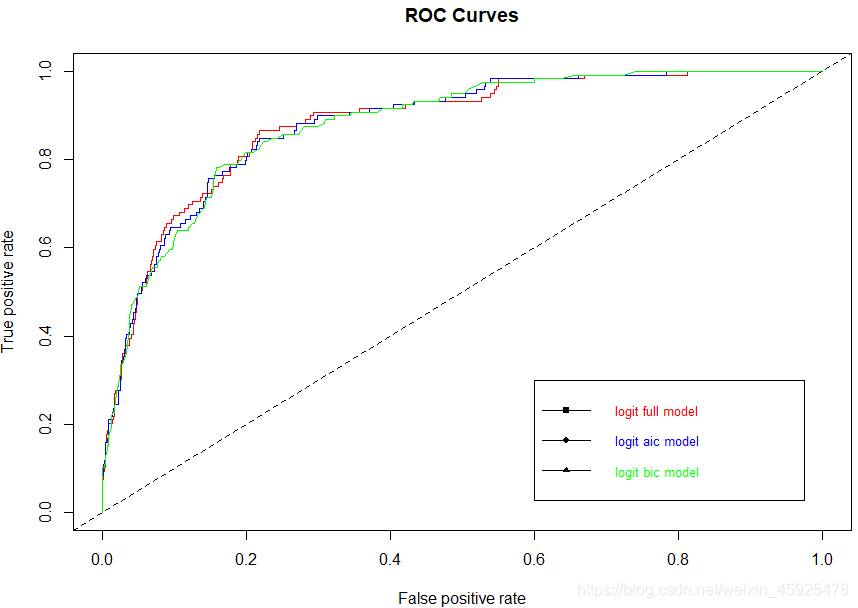
在第二个plot函数中添加参数 add=T
plot(performance(pred1, "tpr", "fpr"), col="red", lwd = 1.5, main = "ROC Curves",lty=1,pch=15)
plot(performance(pred2, "tpr", "fpr"), add = T, col = "blue", lwd = 1.5,lty=1,pch=16)
plot(performance(pred3, "tpr", "fpr"), add = T, col = "green", lwd = 1.5,lty=1,pch=17)
 2.添加图例
legend()函数
legend(0.6,0.3,c("logit full model","logit aic model","logit bic model"),
                 lty=1,cex = 0.8,pch=c(15:17),text.col = c("red","blue","green"))
数字0.6,0.3表示左边、上边的边界
c(“logit full model”,“logit aic model”,“logit bic model”) 标签
lty 线条类型
cex 字体大小
pch 散点样式
text.col 文本颜色


 被折叠的 条评论
为什么被折叠?
被折叠的 条评论
为什么被折叠?
 到【灌水乐园】发言


