


 文章介绍了地图数据可视化的一些关键设置,包括点数据的显示与隐藏、颜色和大小的设定,以及使用颜色函数根据速度数据动态调整颜色。此外,还涉及了多边形和圆的使用,如编辑功能、标签文本、工具提示以及颜色和透明度的配置。这些设置允许用户基于数据自定义地图元素的展示方式。
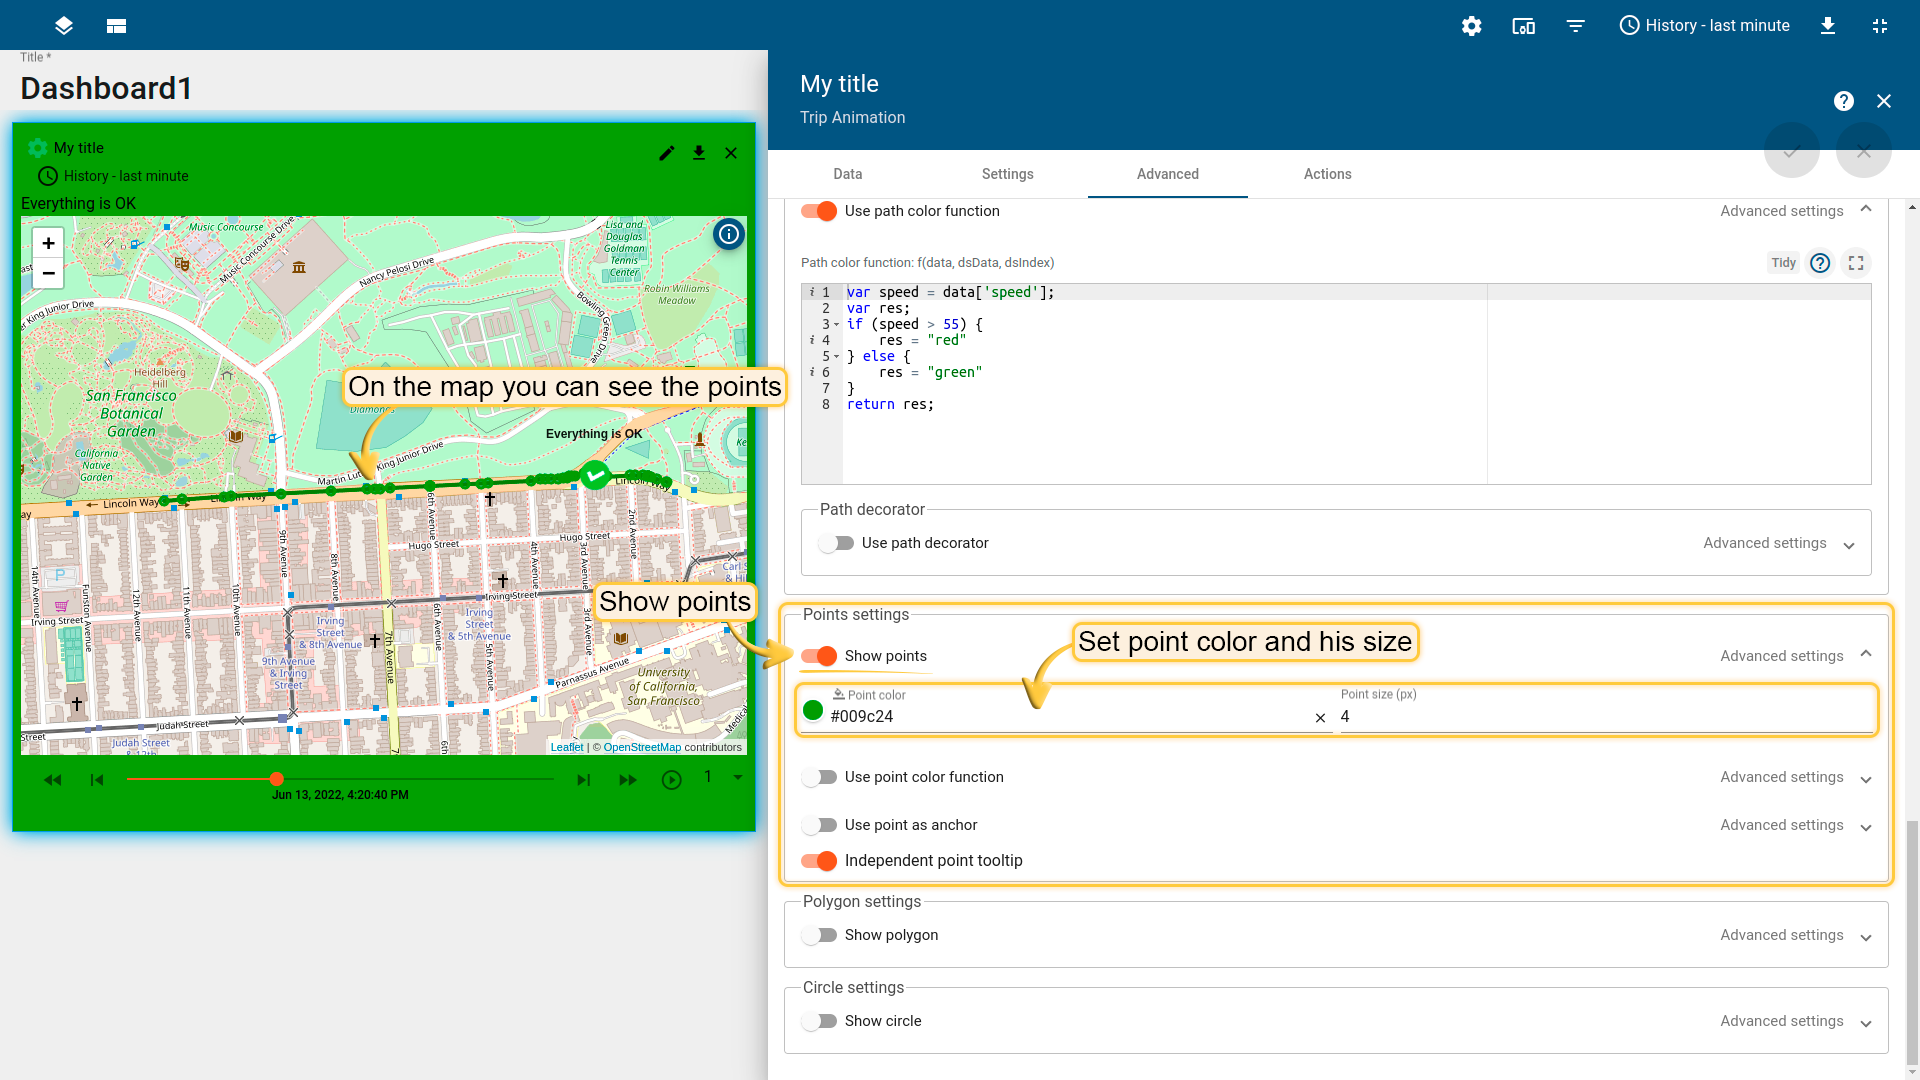
Point Settings
The next option is a show points option. Points are a telemetry data updates so that you can check each. For the points next options are available.
-
Show/Hide points
-
Point color
-
Point size px
- Use color point function
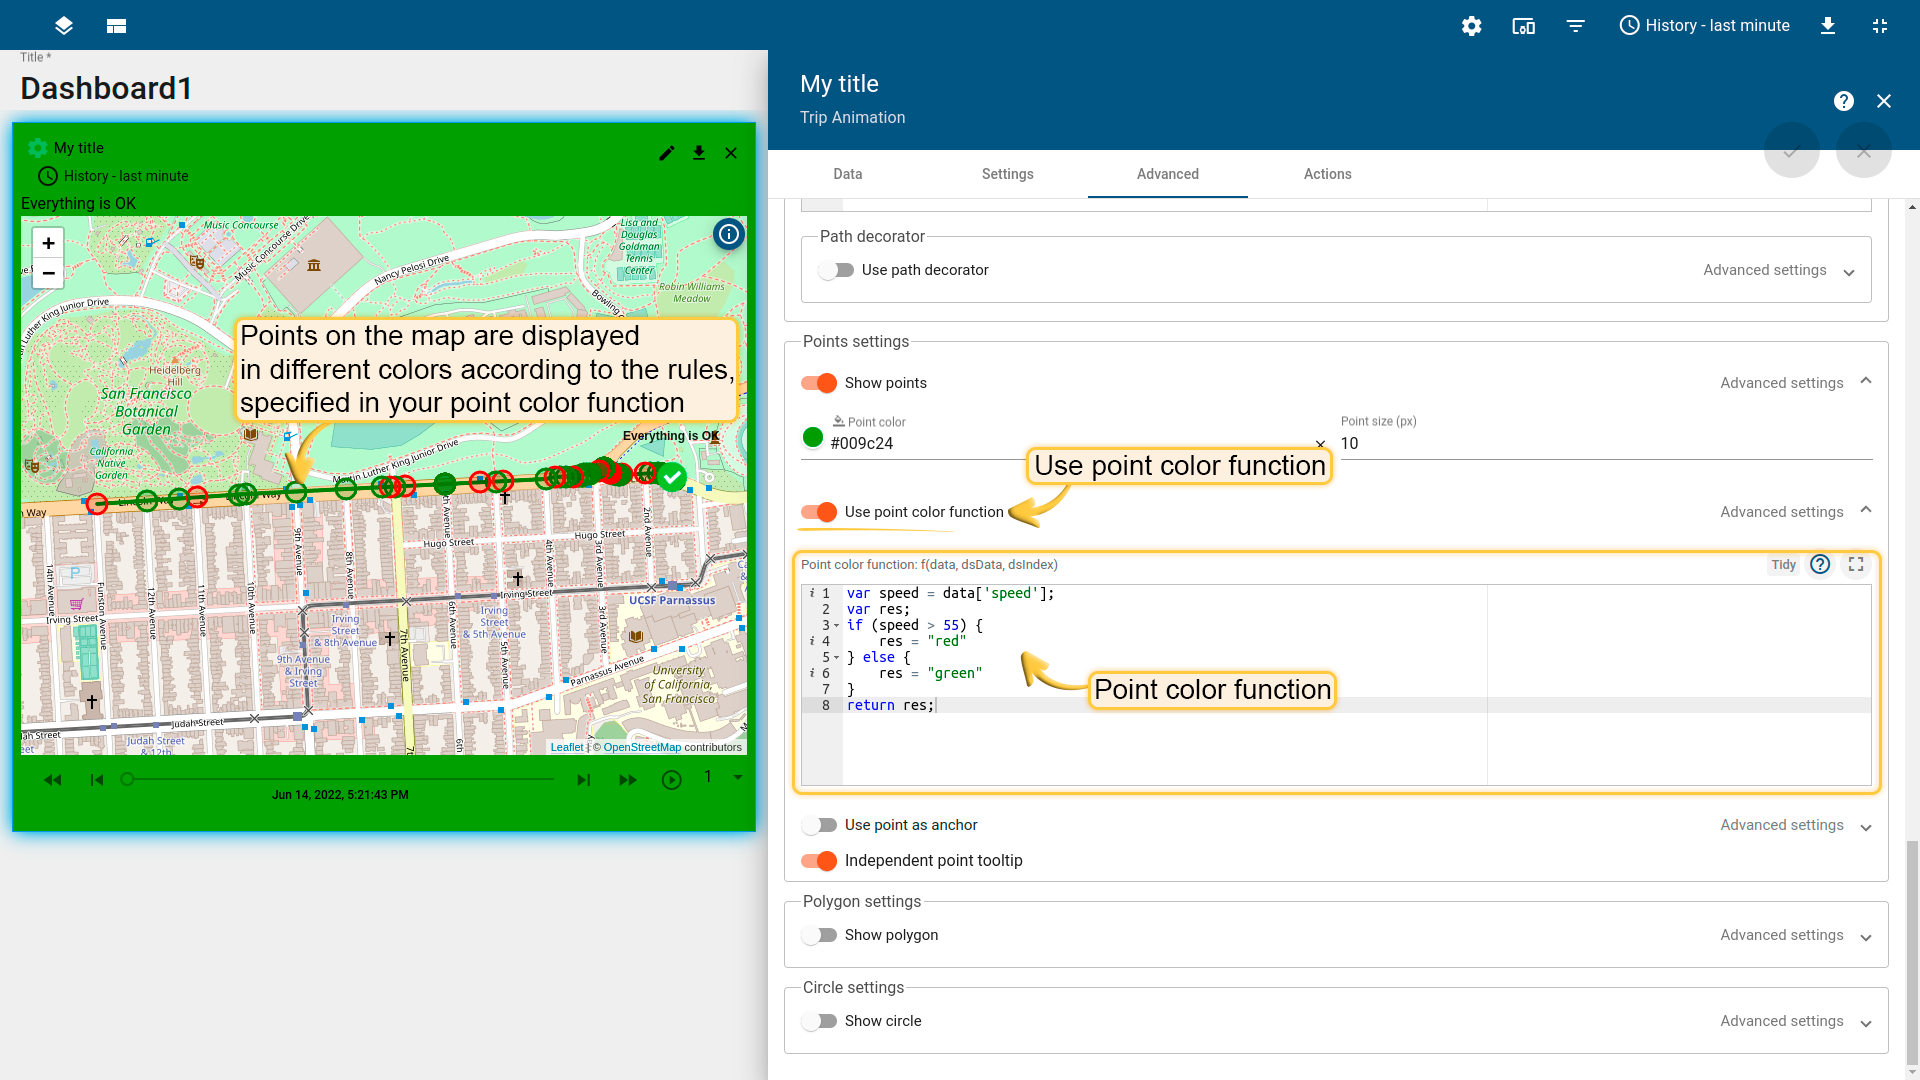
Points color function:
|
|
Copy to clipboard
- Use point as an anchor (you may change data based on data, dsData, dsIndex)
Point as anchor function:
|
|
Copy to clipboard
- Independent point tooltip
Polygon Settings
What’s a polygon? It’s a plane figure that’s described by a finite number of dots. We use polygon which is based on coordinates that are specified within the device we use, but you can use any other entity.
You may mark your assets and any other entities with a polygon option.
Polygon coordinates are being received in a format:
|
where n - number of coordinates which polygon is described by.
For the polygon, we can specify the next settings:
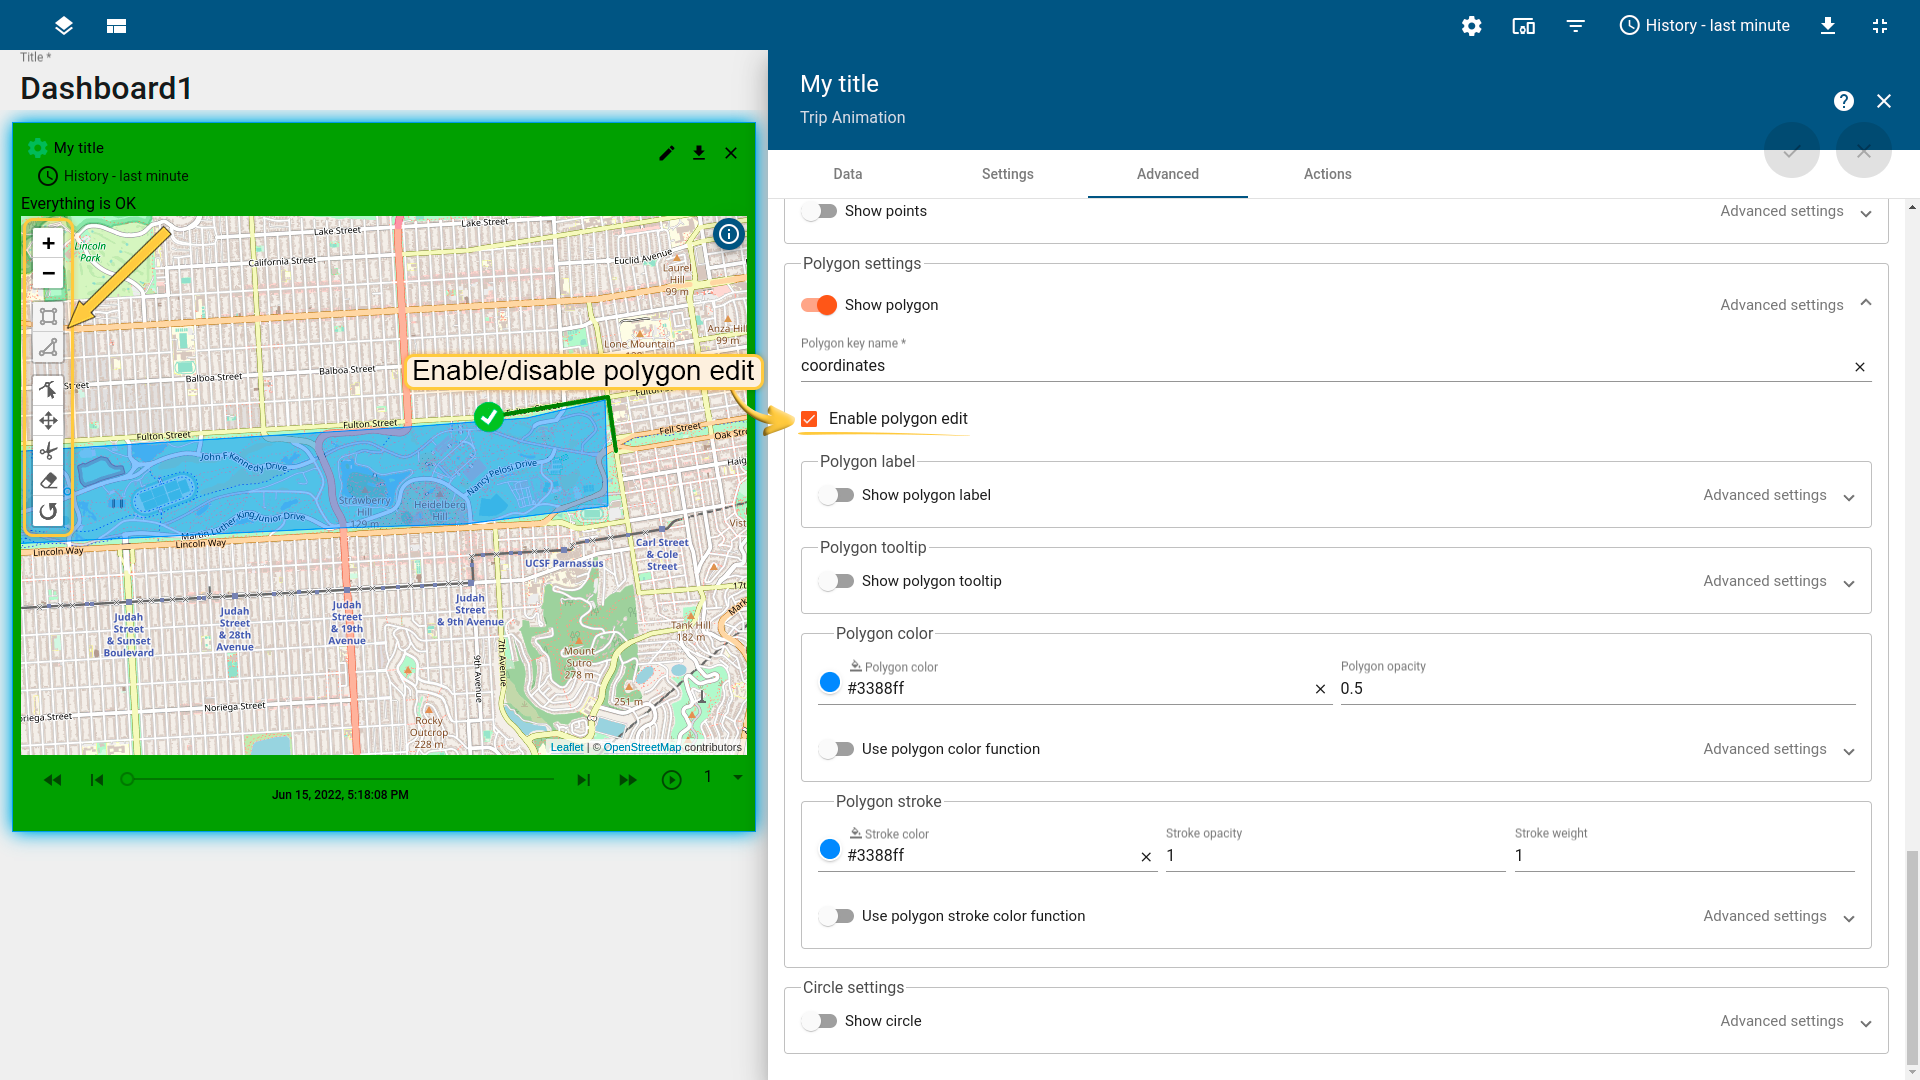
- Show/Hide polygon

- Enable/disable polygon edit
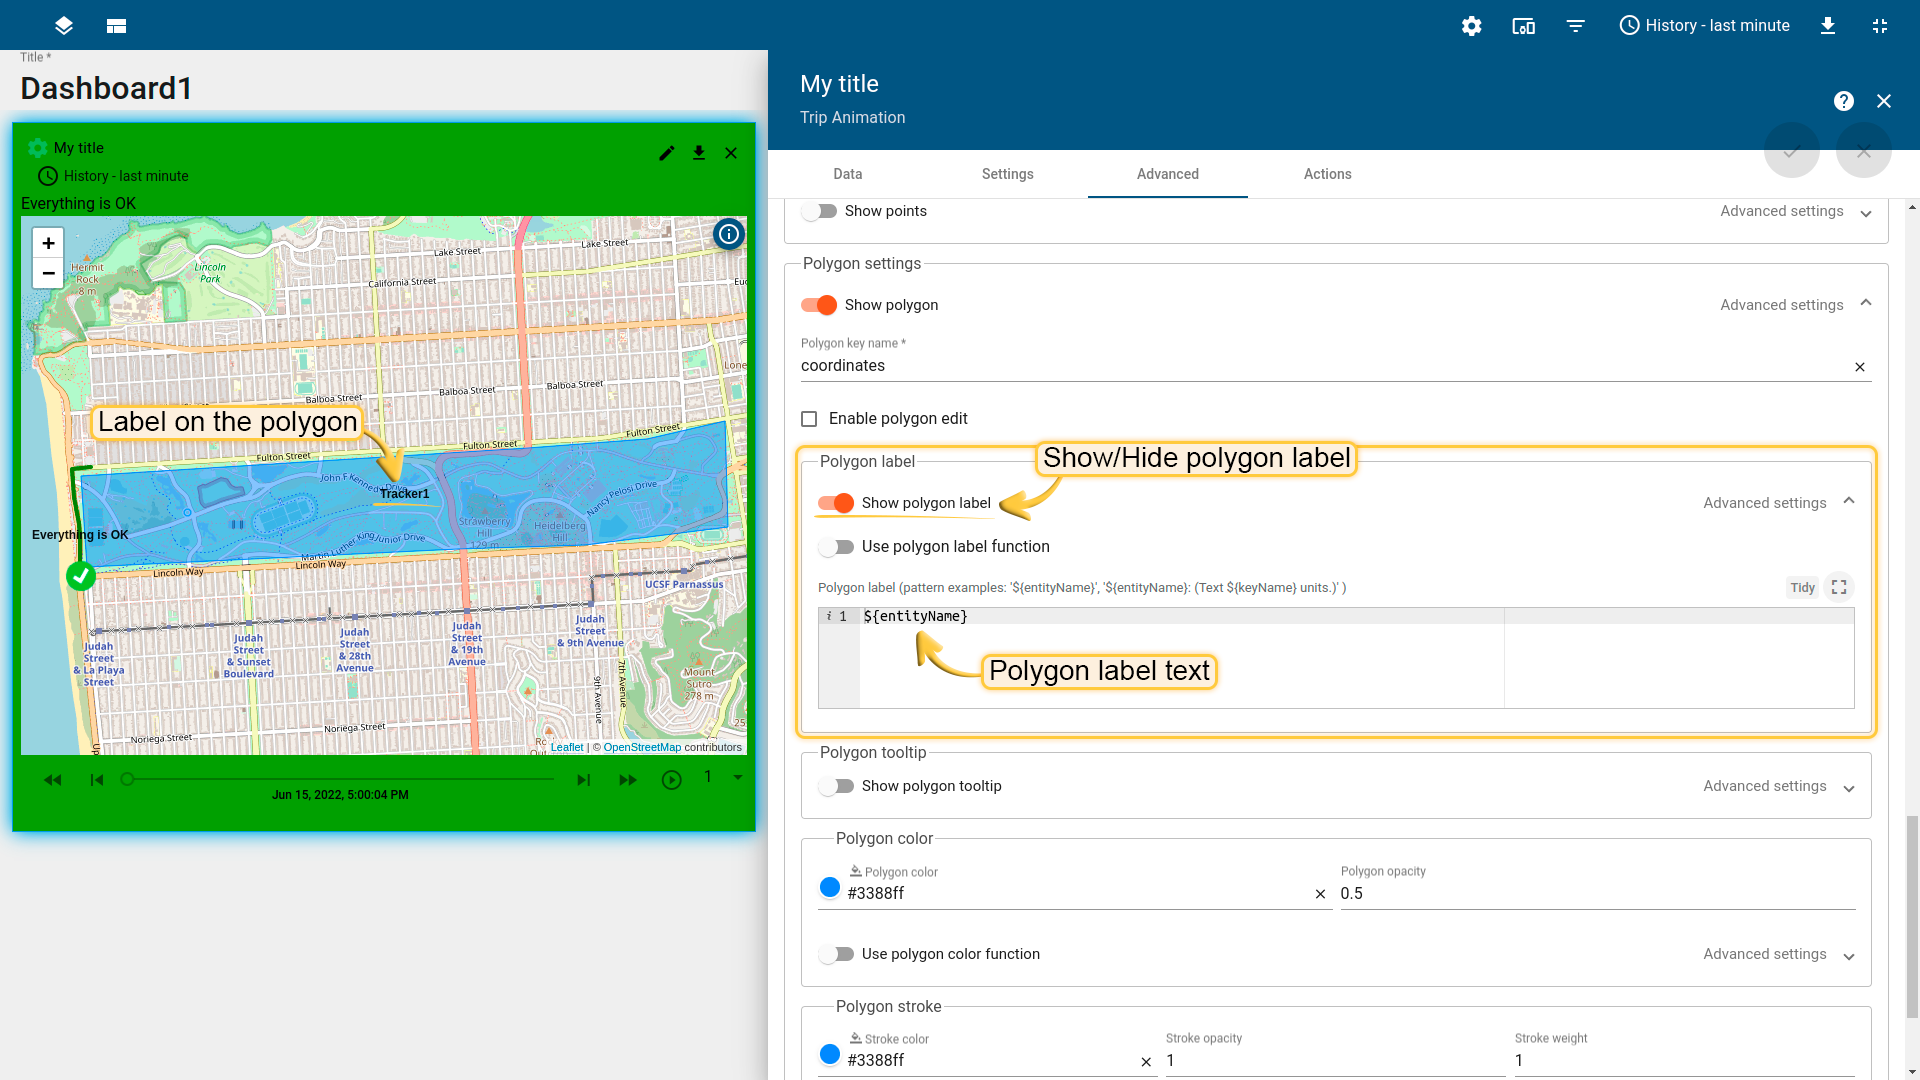
- Polygon label text or polygon label function (you may change data contained in a polygon label based on data, dsData, dsIndex)
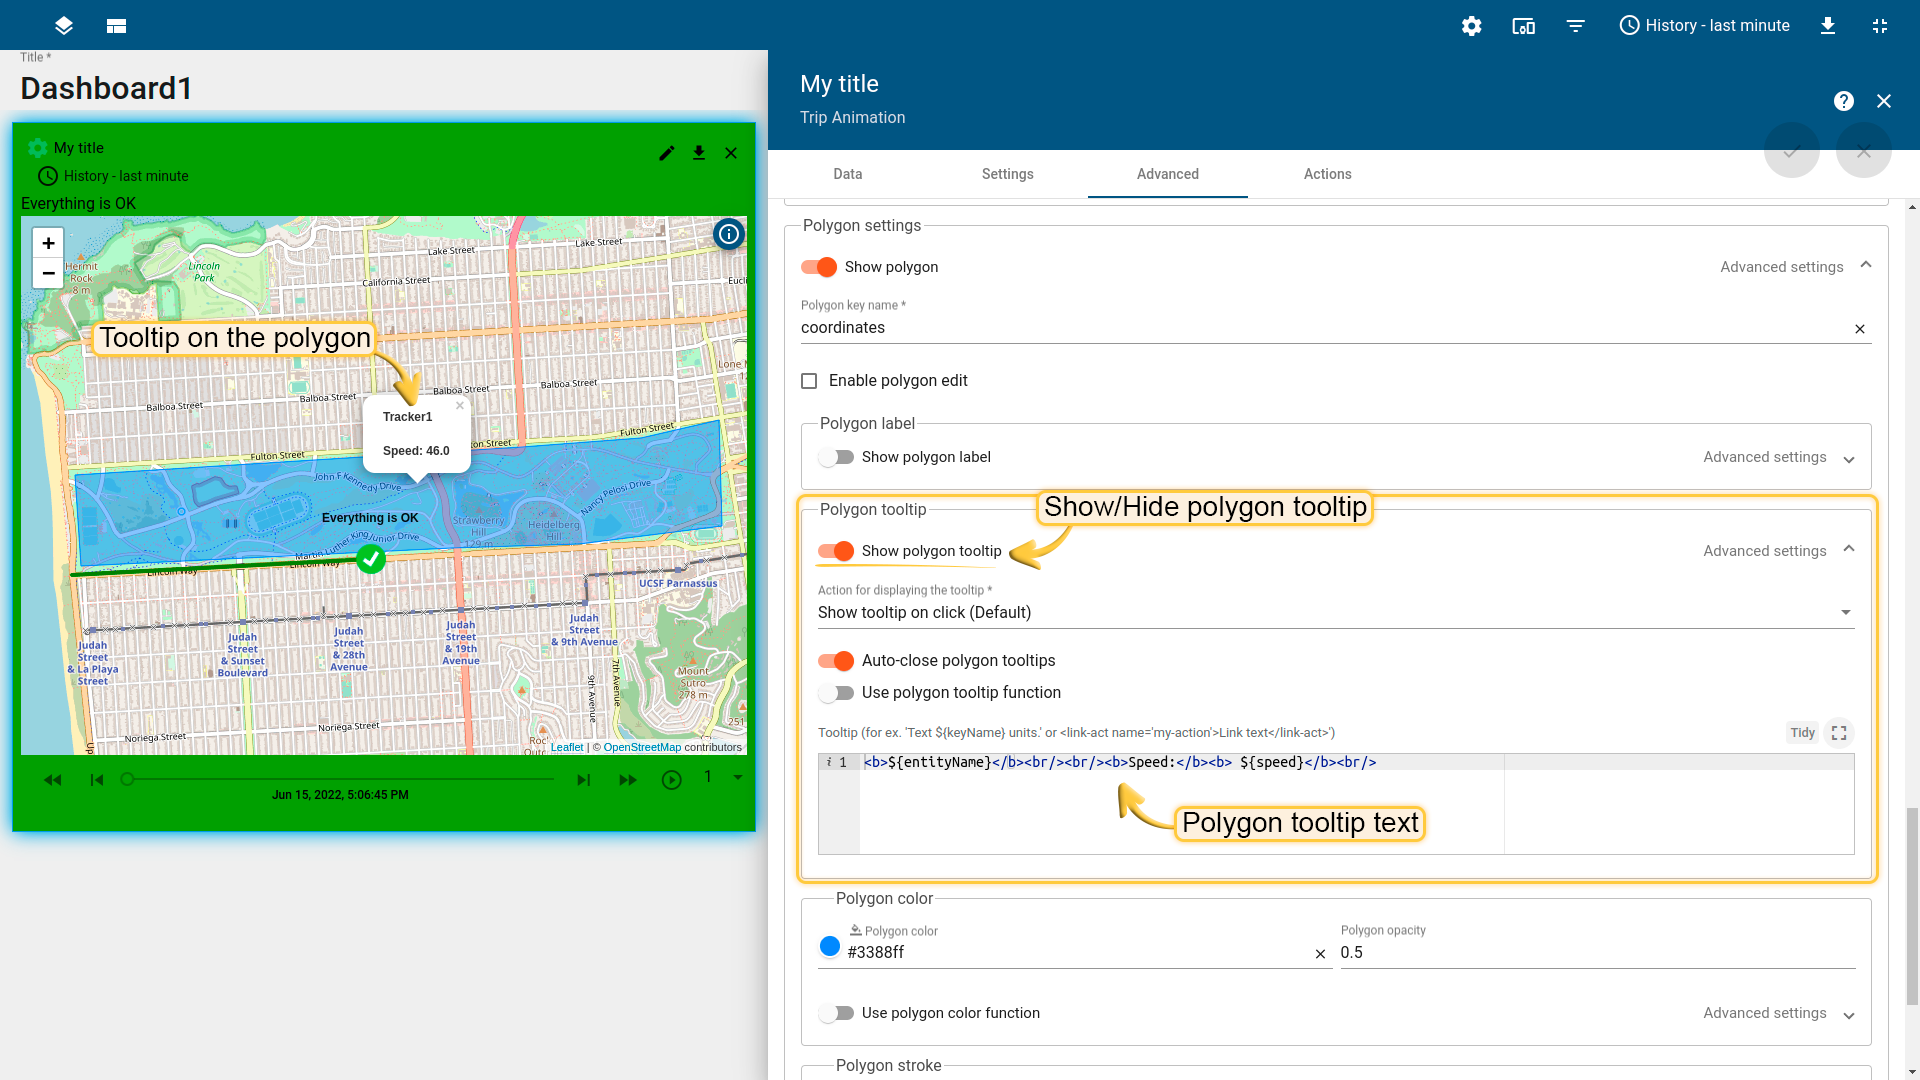
- Polygon tooltip text or polygon tooltip function (you may change data contained in a polygon tooltip based on data, dsData, dsIndex)
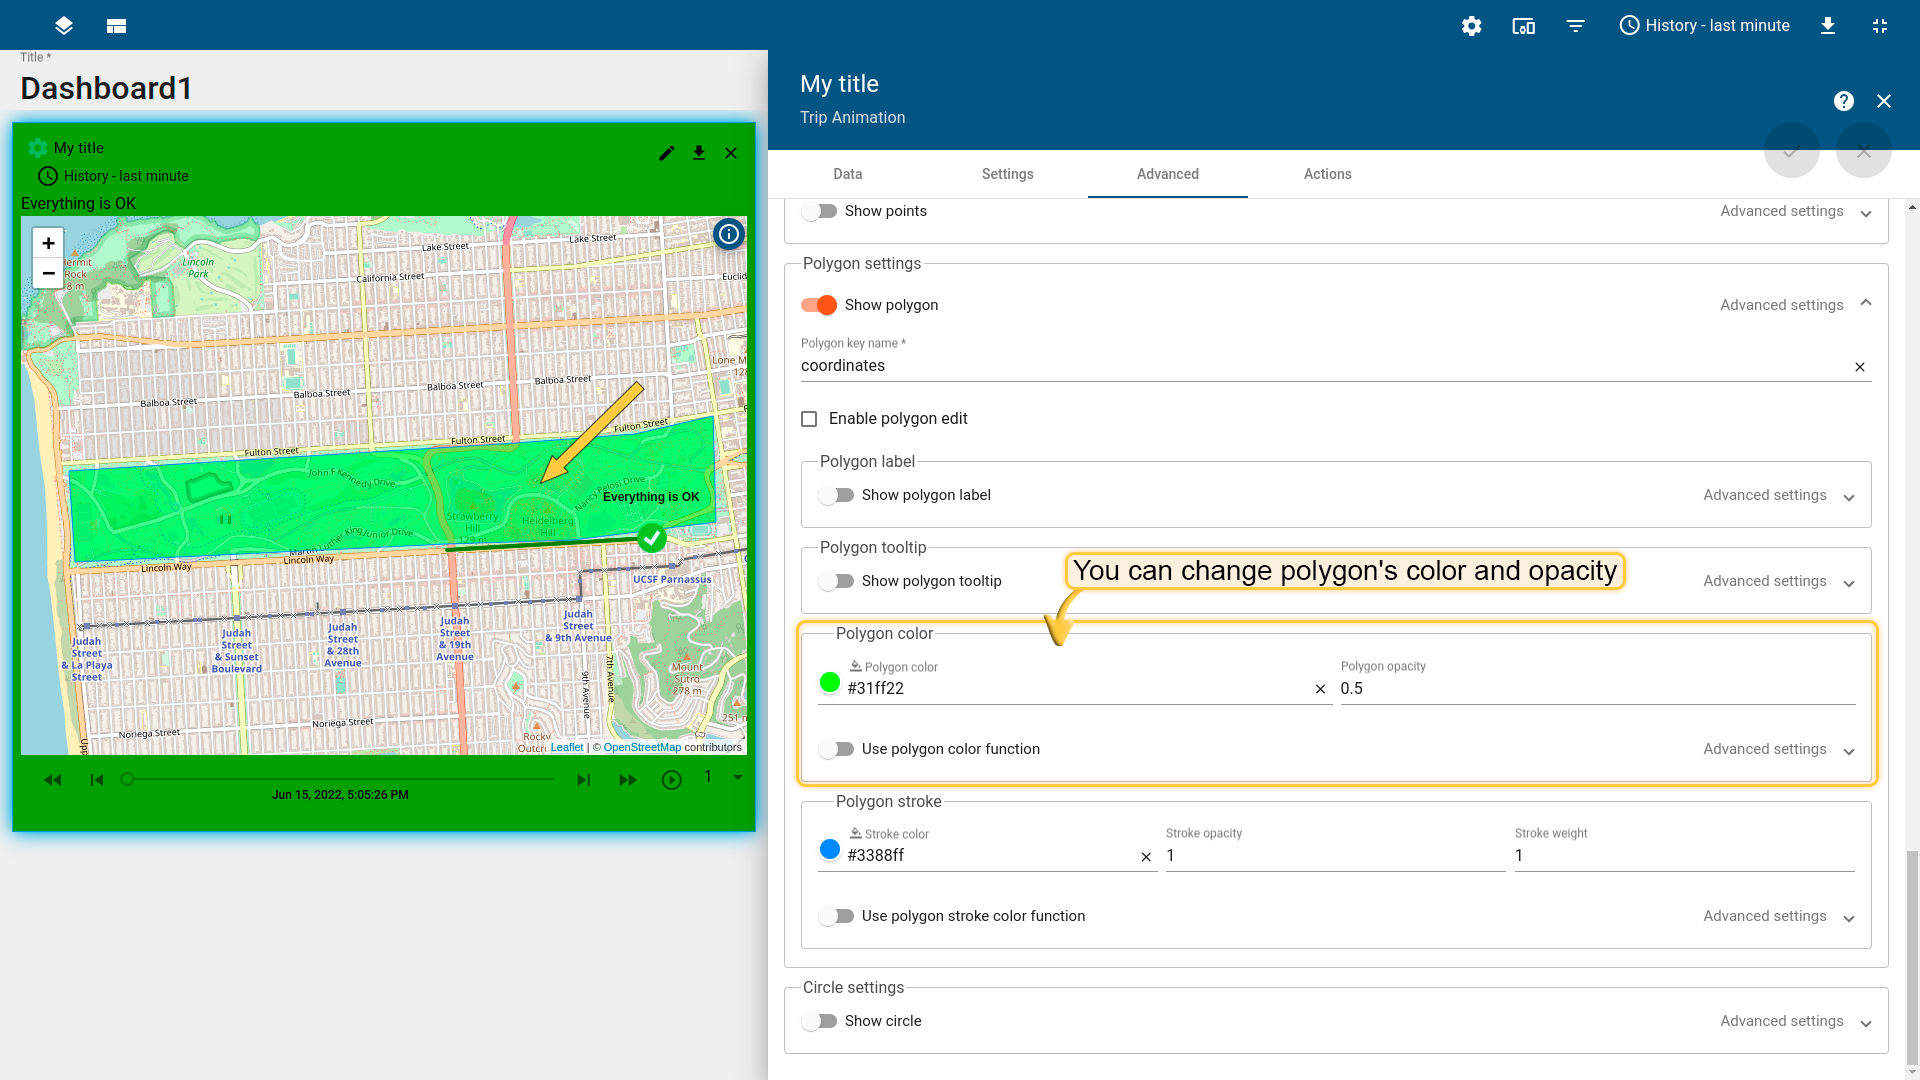
- Polygon color, polygon opacity, or polygon color function (you may change polygon color based on data, dsData, dsIndex)
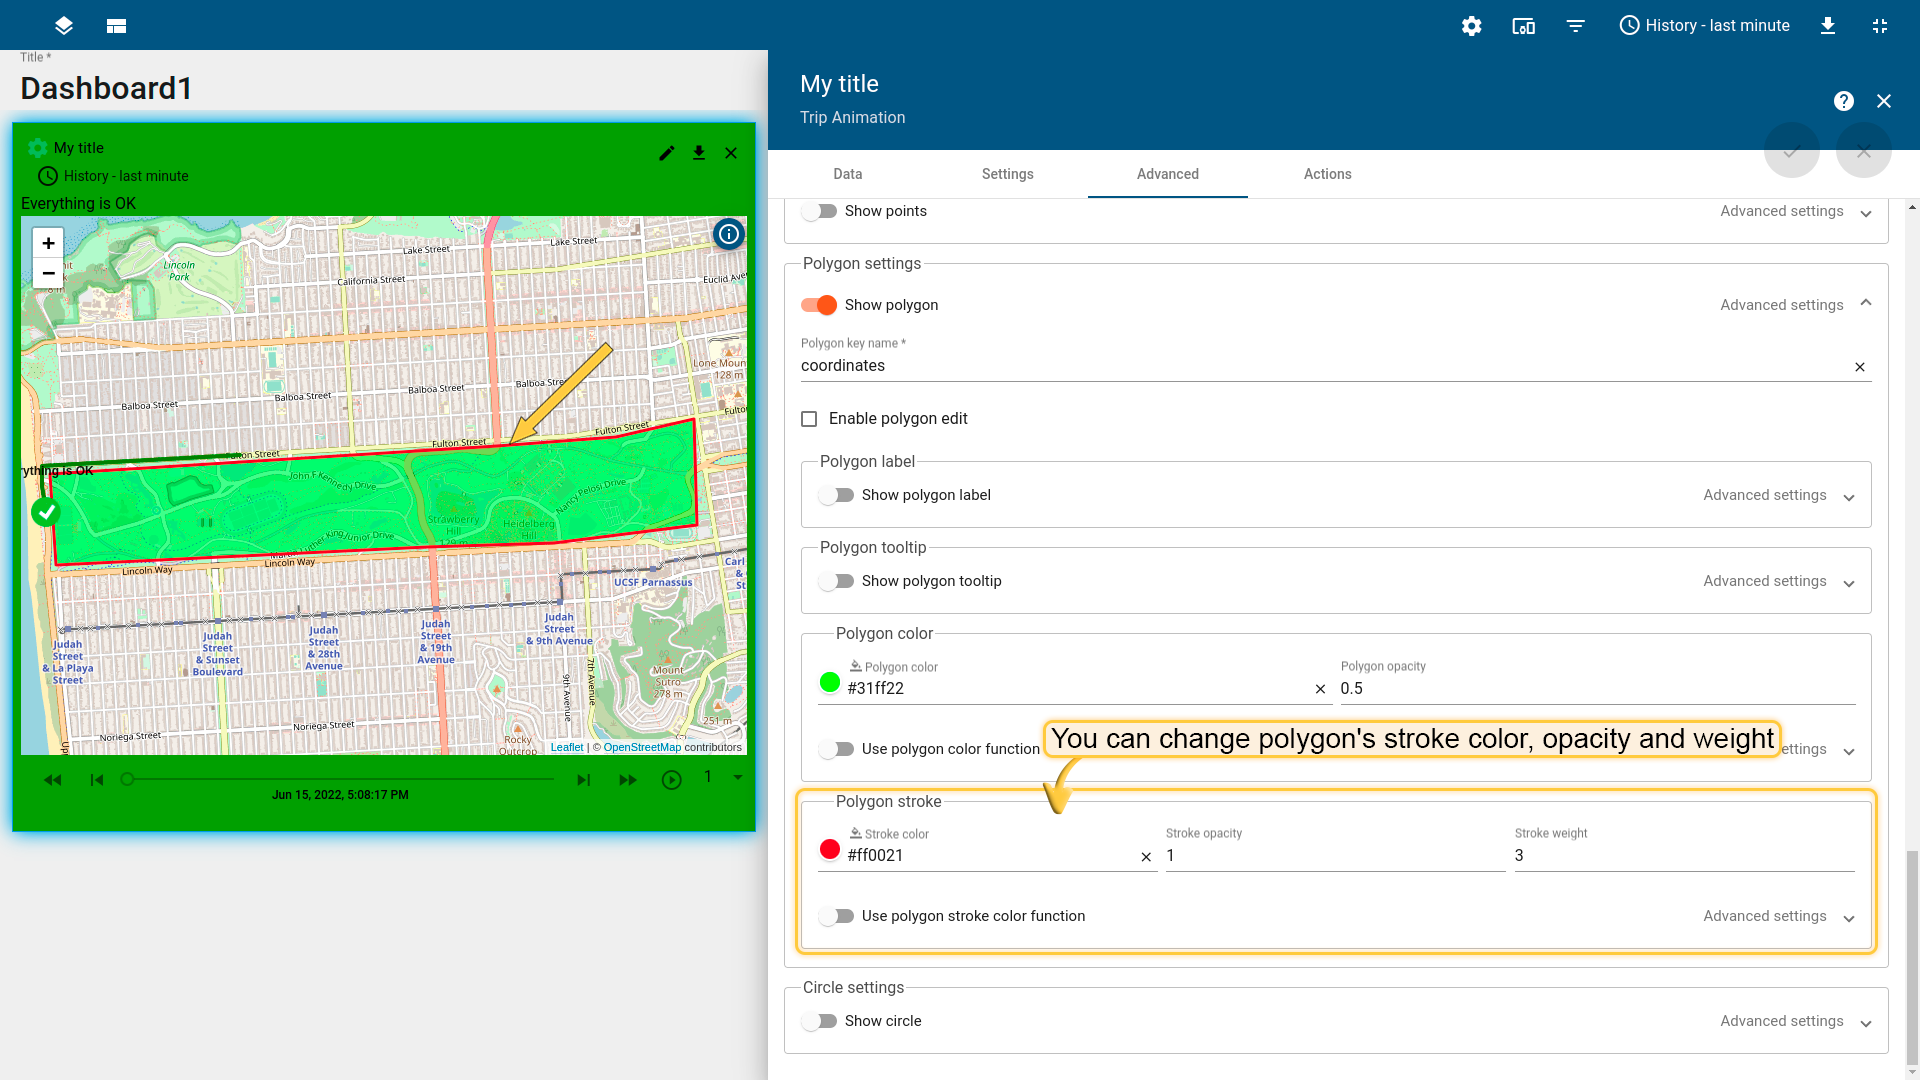
- Polygon stroke color, polygon opacity, polygon weight or polygon stroke color function (you may change polygon color based on data, dsData, dsIndex)
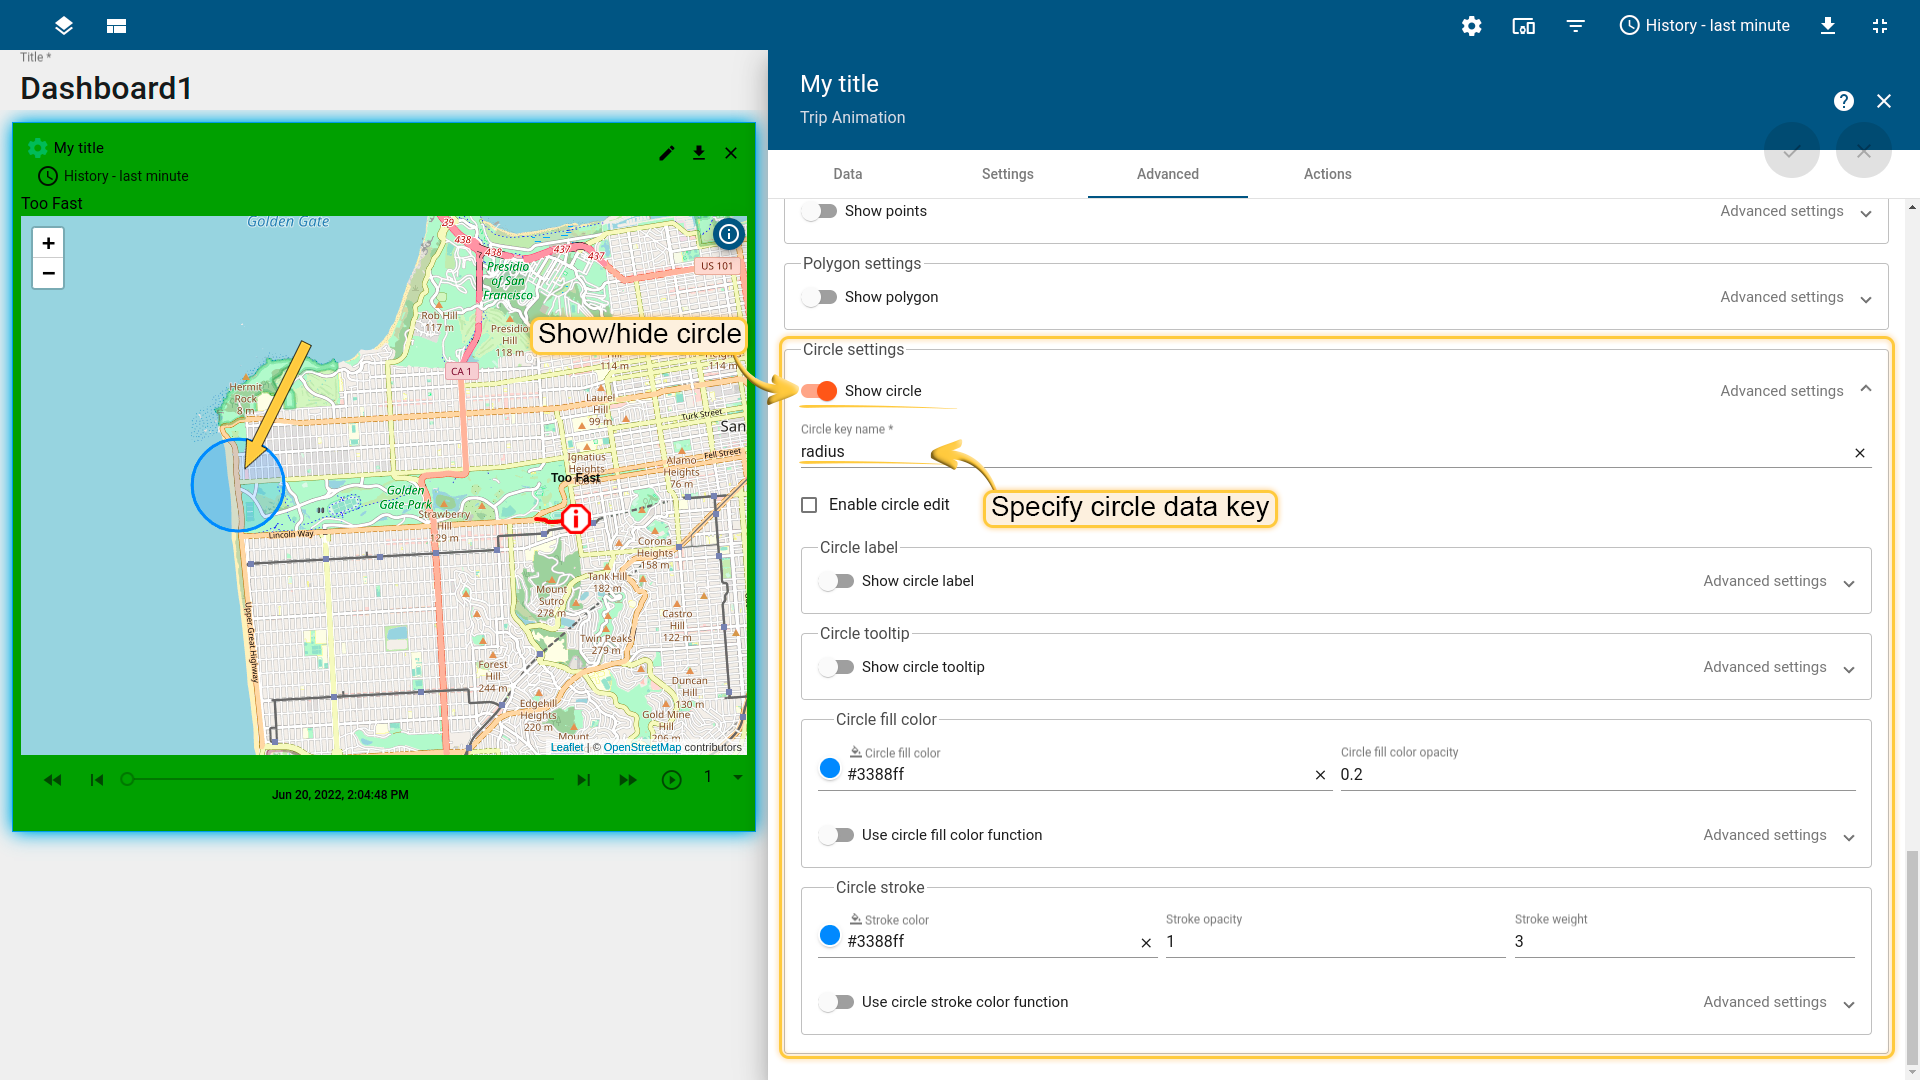
Circle settings
Circle is a plane figure, boundary points of which are always the same distance away from a fixed central point. We use circle which is based on coordinates that are specified within the device we use, but you can use any other entity.
You may mark your assets and any other entities with a circle option.
Circle coordinates are being received in a format:
|
For the circle, we can specify the next settings:
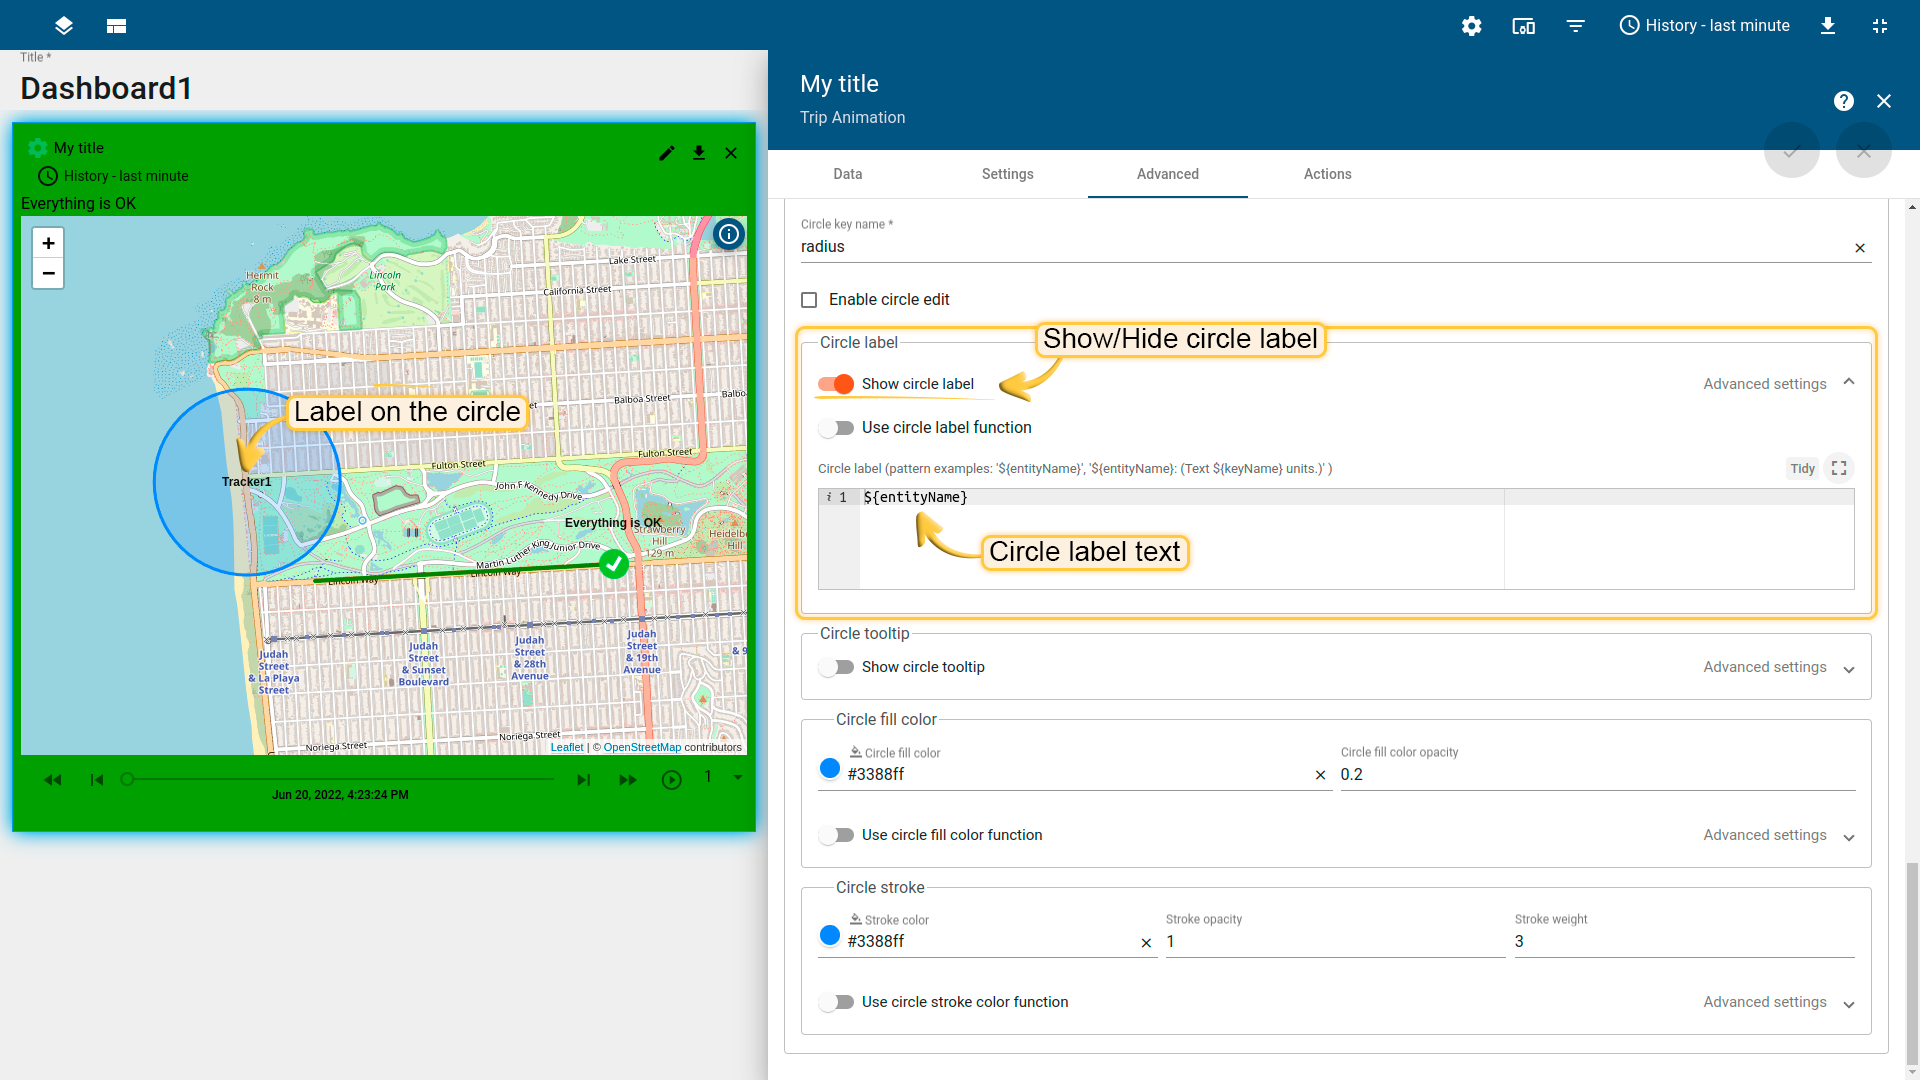
- Show/Hide circle
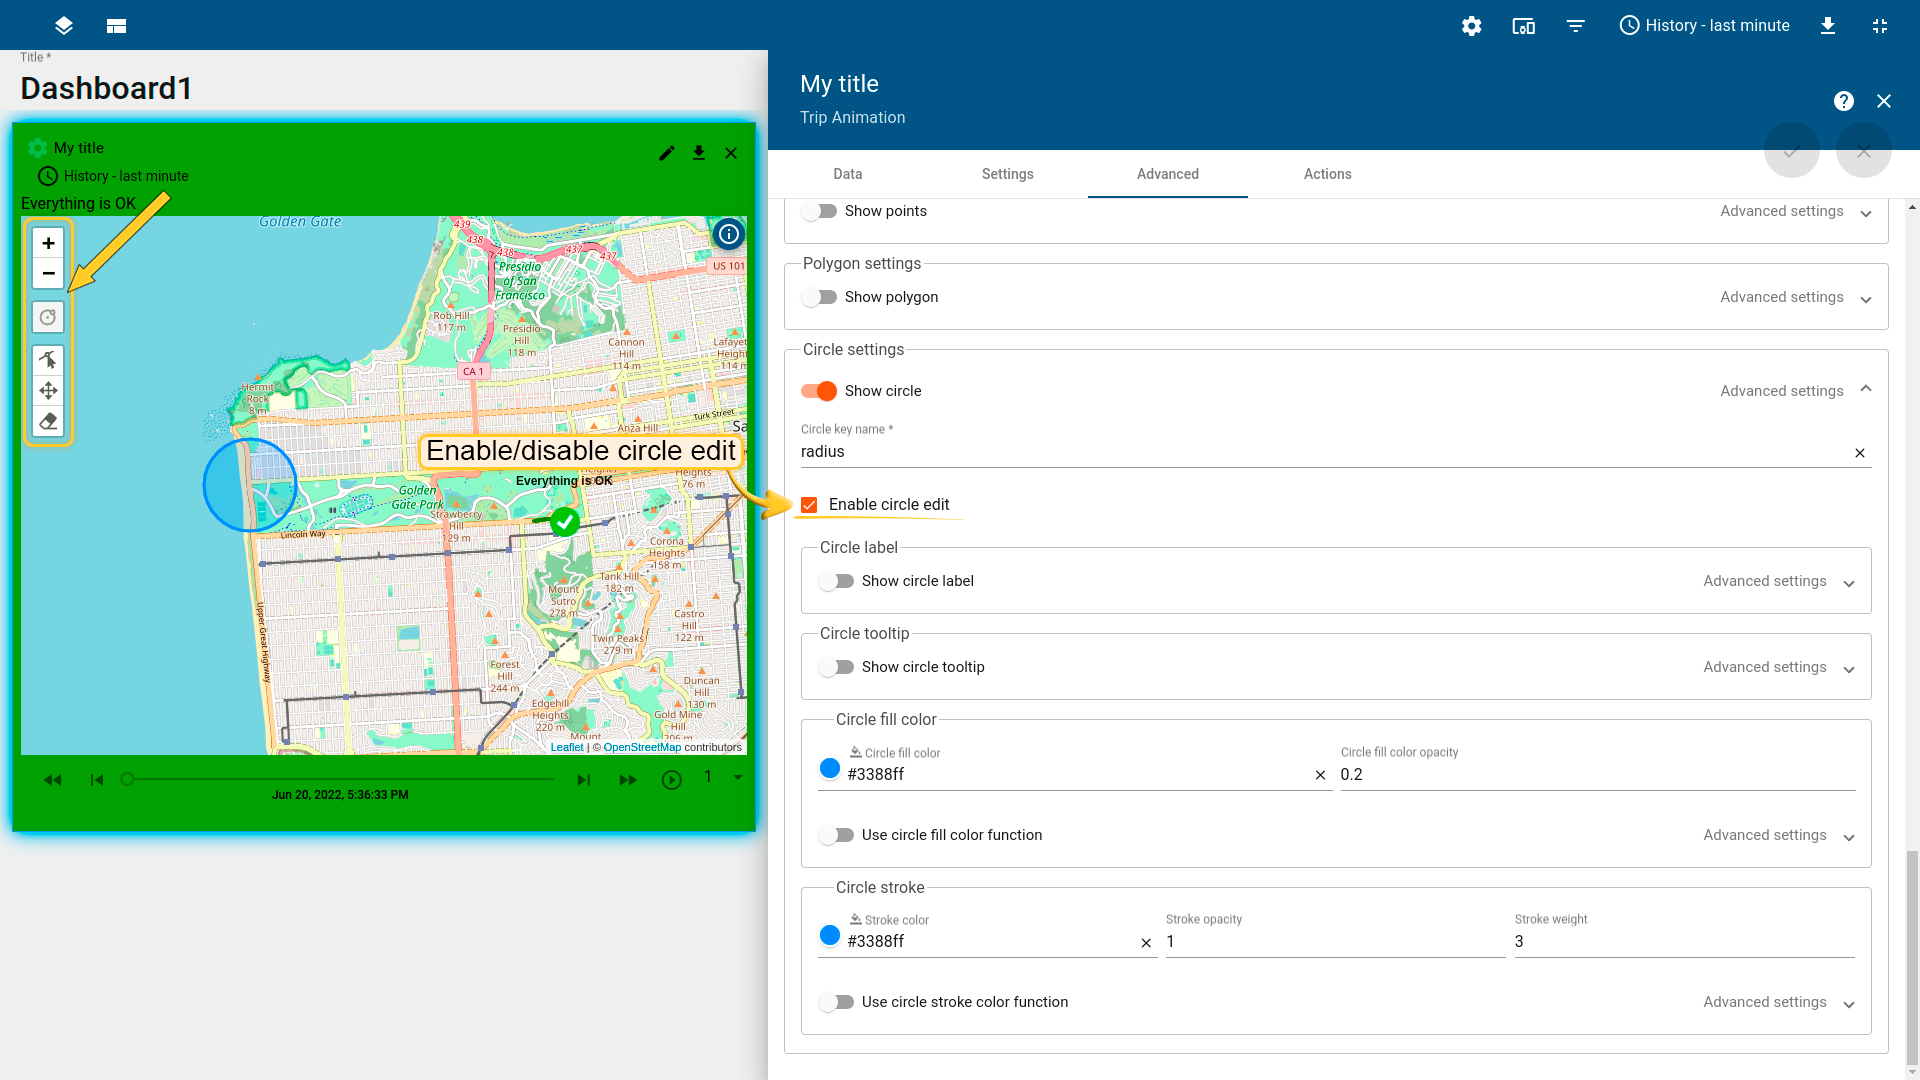
- Enable/disable circle edit
- Circle label text or circle label function (you may change data contained in a circle label based on data, dsData, dsIndex)
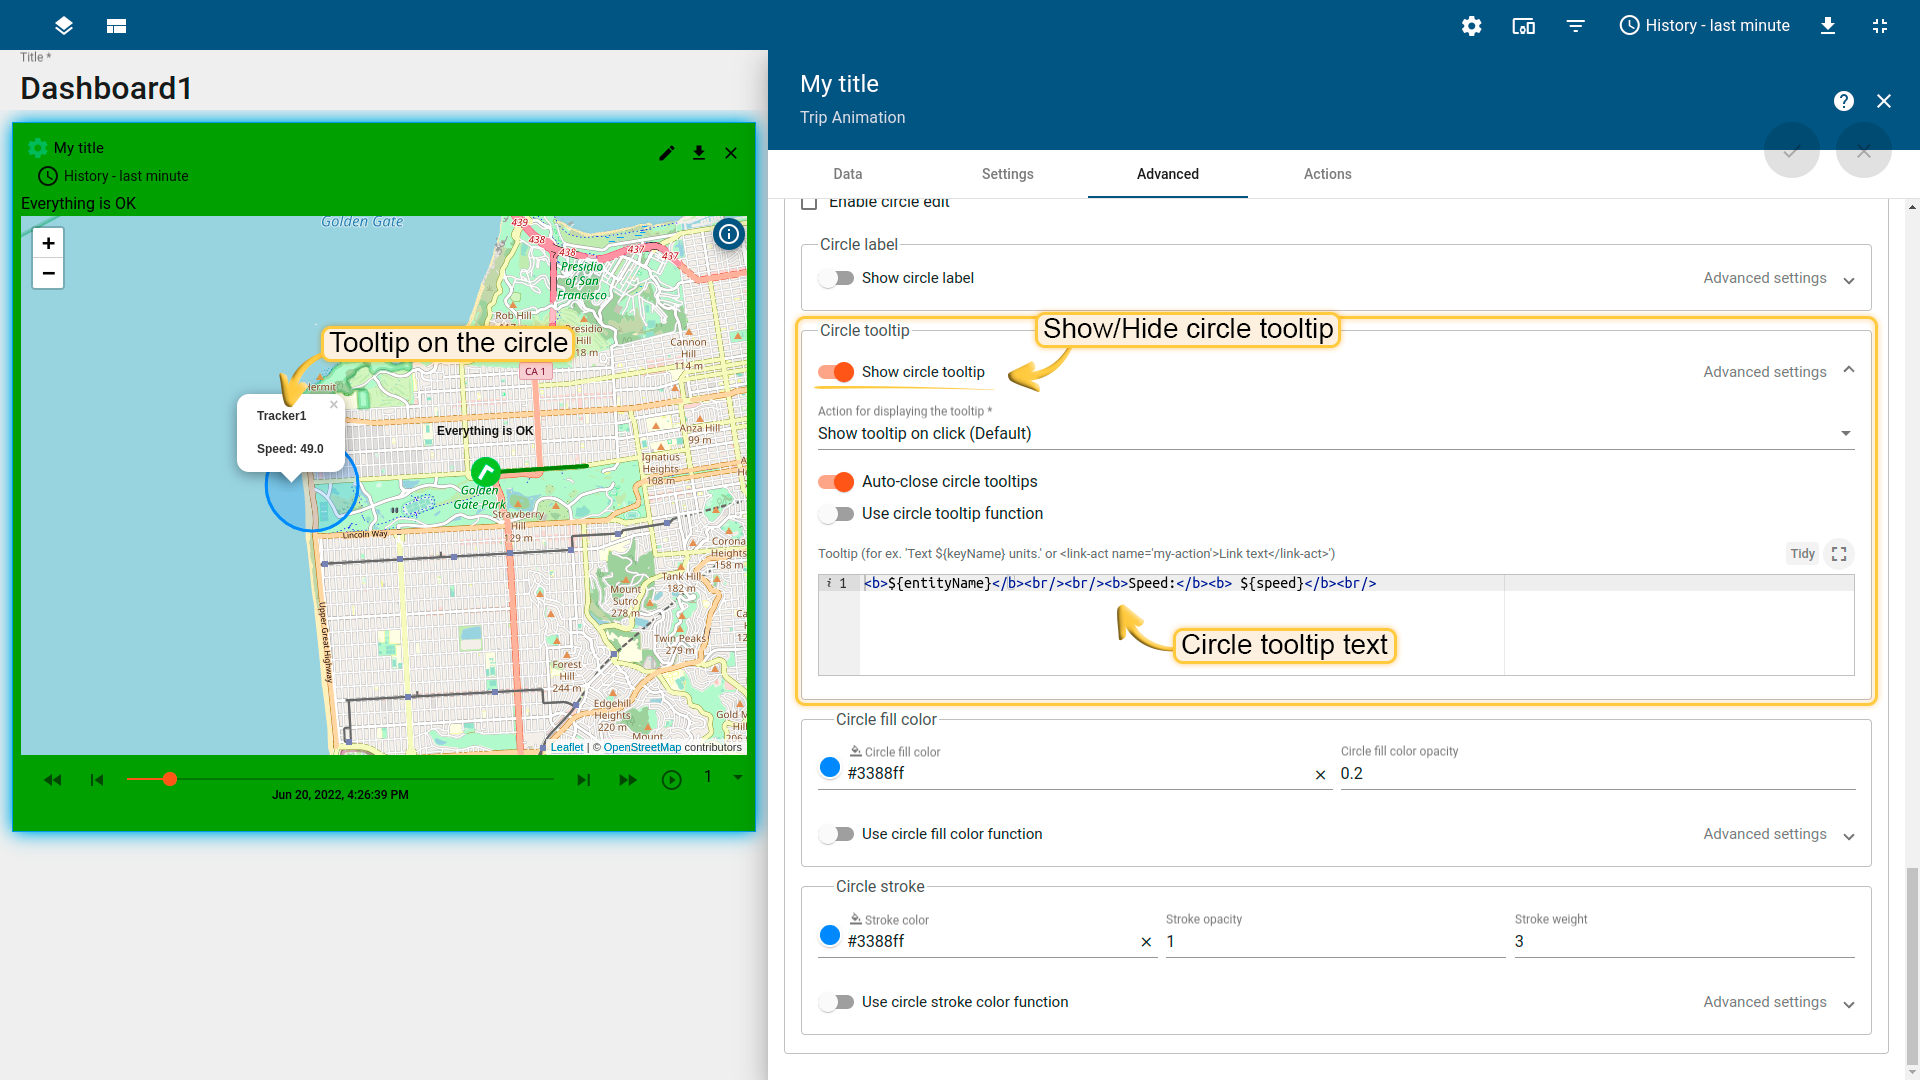
- Circle tooltip text or circle tooltip function (you may change data contained in a circle tooltip based on data, dsData, dsIndex)
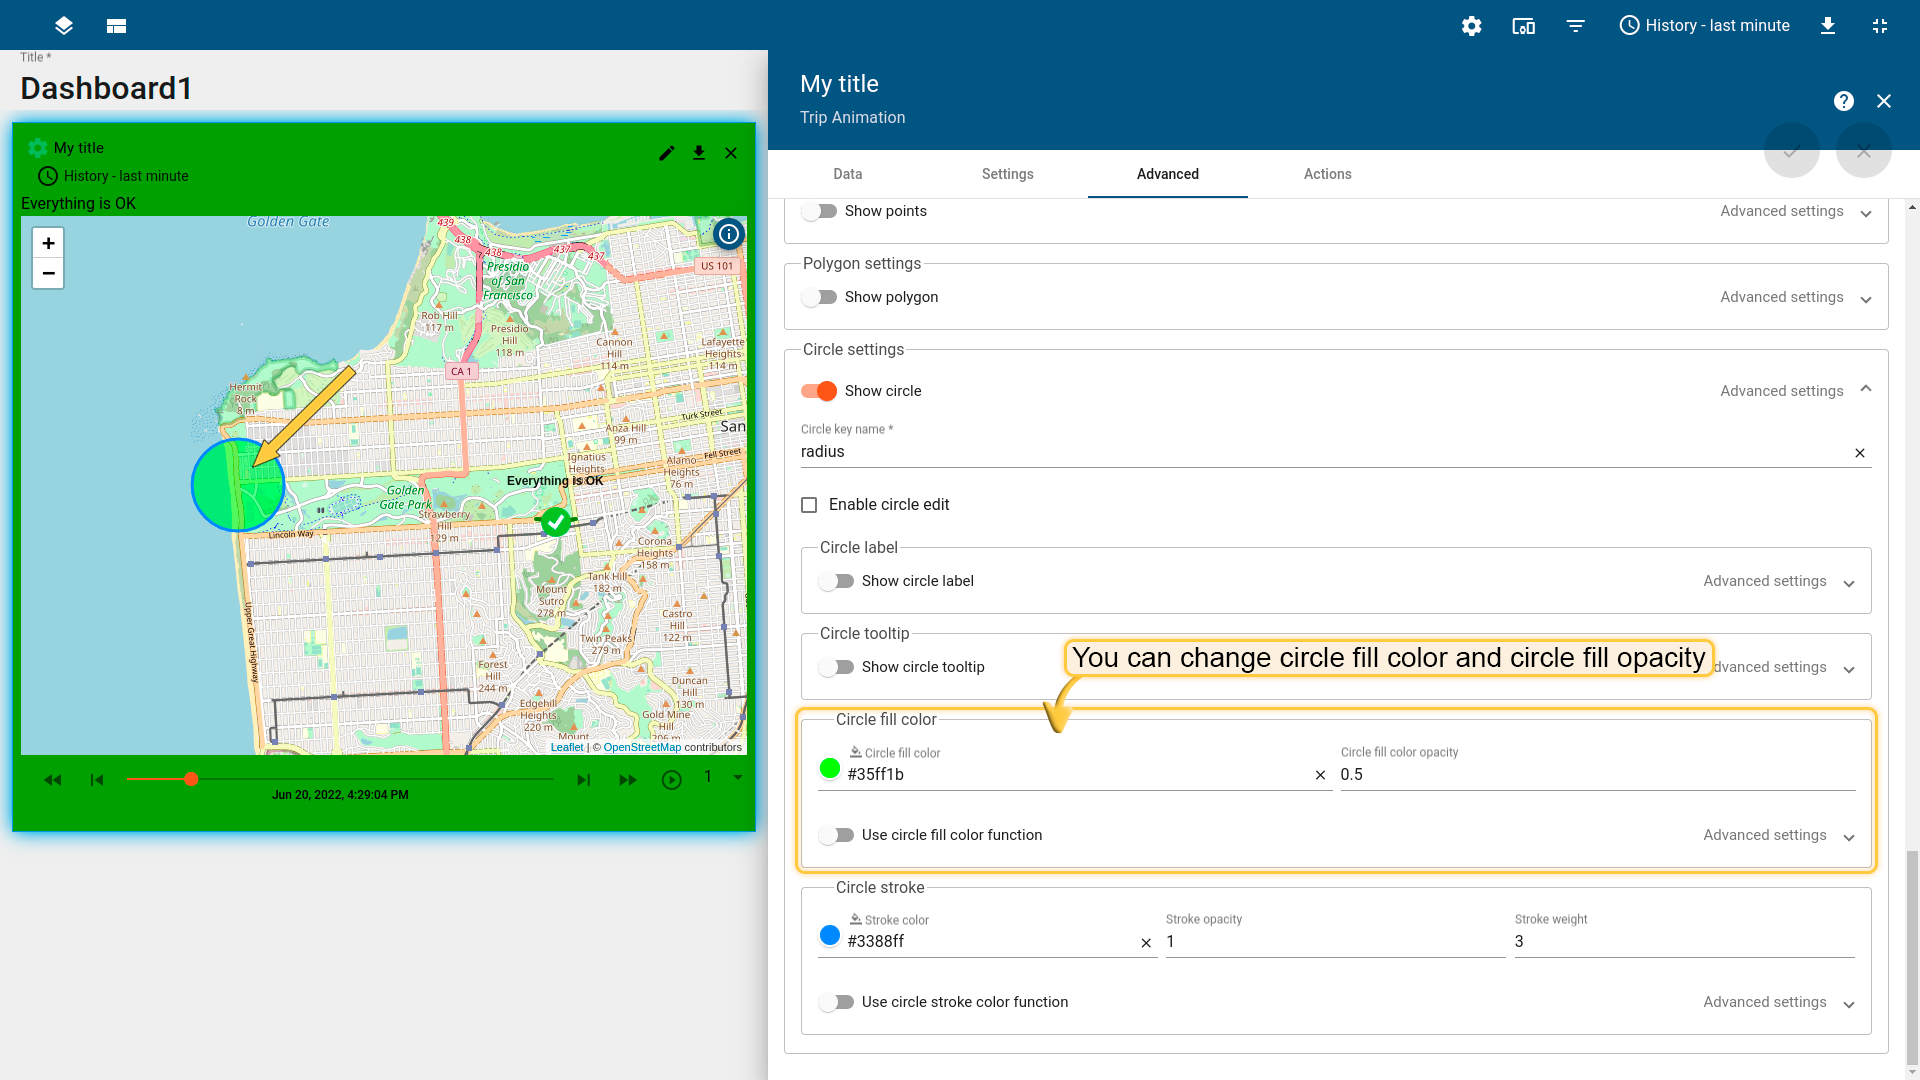
- Circle fill color, circle fill color opacity, or circle fill color function (you may change circle color based on data, dsData, dsIndex)
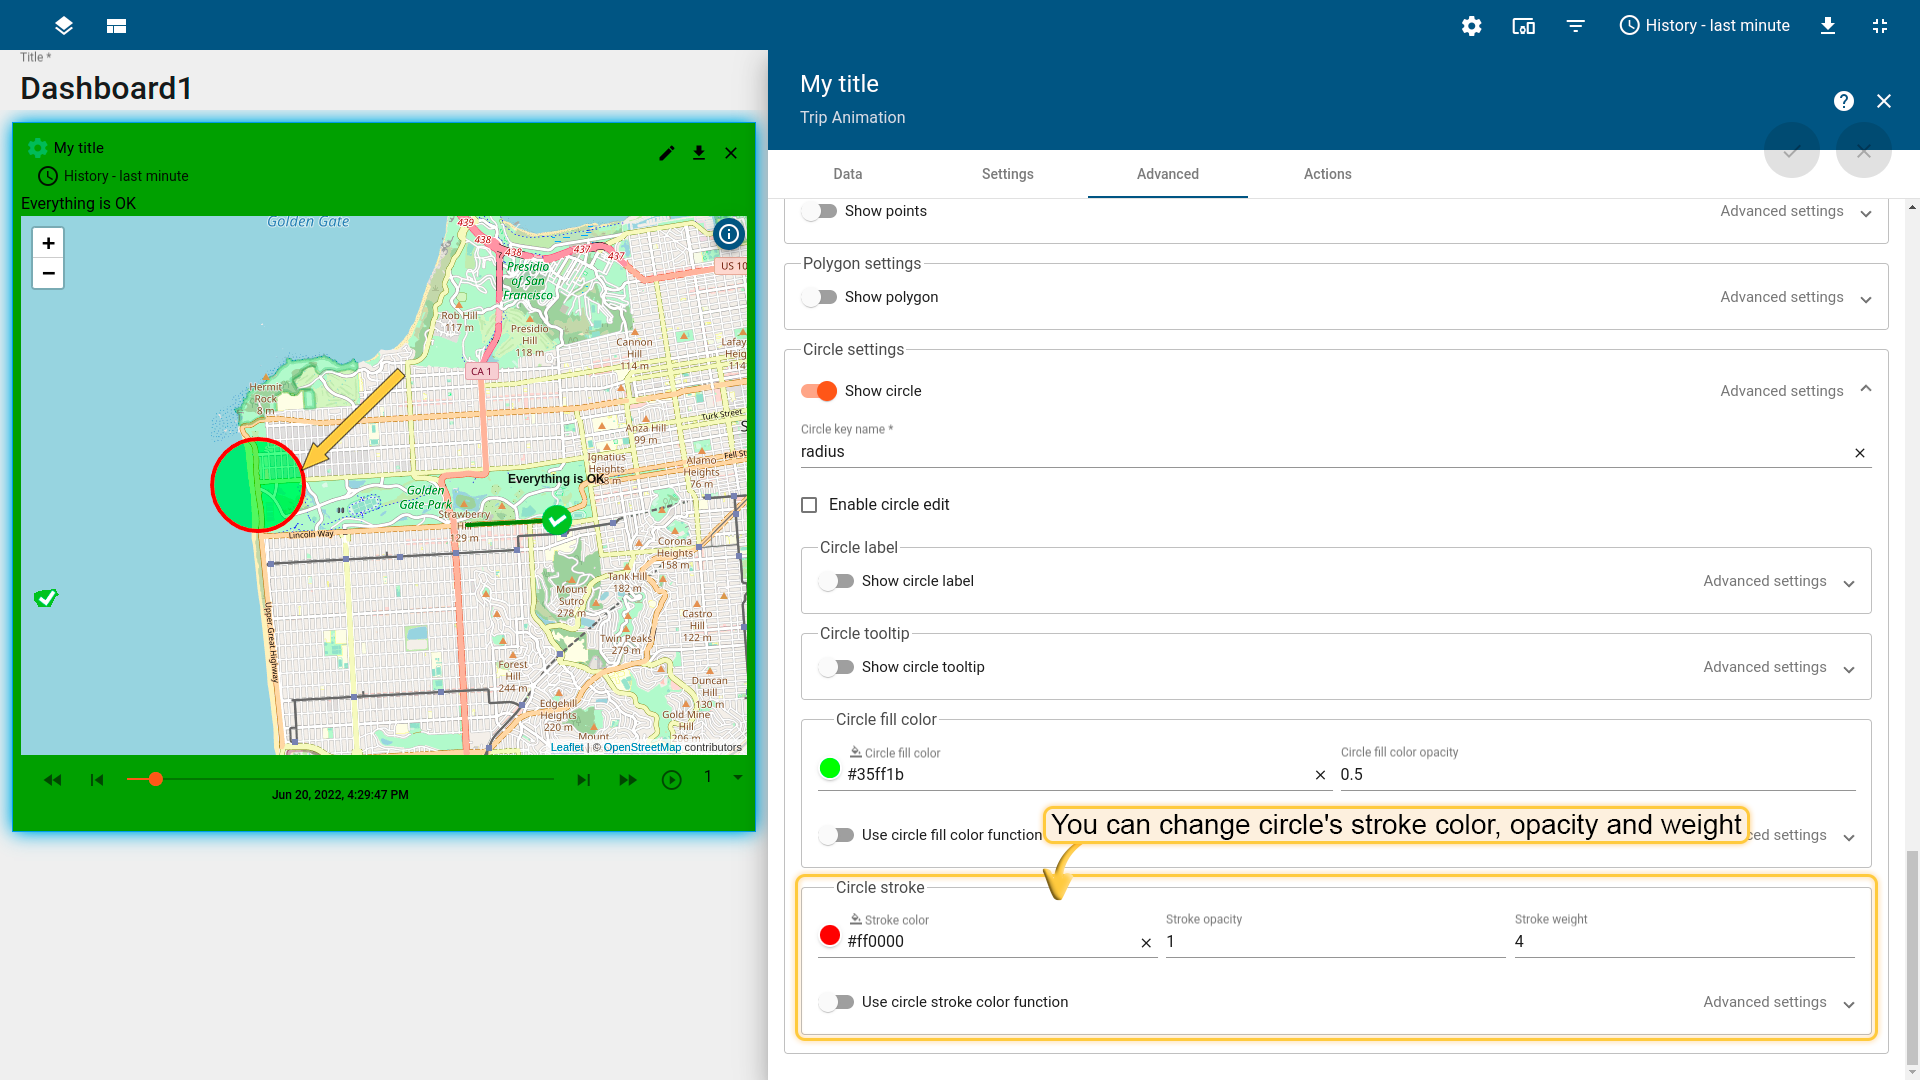
- Circle stroke color, stroke opacity, stroke weight or circle stroke color function (you may change circle color based on data, dsData, dsIndex)


 被折叠的 条评论
为什么被折叠?
被折叠的 条评论
为什么被折叠?
 到【灌水乐园】发言


