


文章开始先奉上 @ncepu_Chen 博主优秀笔记:
基础绘图
高级绘图
Basic Plotting
hold on/off: have both plots in one figure
hold on
plot(cos(0:pi/20:2*pi));
plot(sin(0:pi/20:2*pi));
hold off
- Specify Line and Marker Appearance in Plots
legend()、title()、xlable()、ylable()、zlable()
x = 0:0.1:2*pi;
y1 = sin(x);
y2 = exp(-x);
plot(x,y1,'--*',x,y2,':o');
xlabel('t = 0 to 2\pi');
ylabel('values of sin(t) and e^{-x}');
title('Function Plots of sin(t) and e^{-x}');
legend('sin(t)','e^{-x}');

text()、annotation()
x = linspace(0,3);
y = x.^2.*sin(x);
plot(x,y);
line([2,2],[0,2^2*sin(2)]);
% 输入公式 Latex显示
str = '$$ \int_{0}^{2} x^2\sin(x) dx $$';
text(0.25,2.5,str,'Interpreter','latex');
% annotation范围为图表的[0 1] X表示图表横坐标区间的32%-50%,Y表示图表纵坐标区间的60%-40%
annotation('arrow','X',[0.32,0.5],'Y',[0.6,0.4]);

- Modifying Properties of An Object
- Strategy:
- Identify the ‘handle’ of an object
h = plot(x,y)
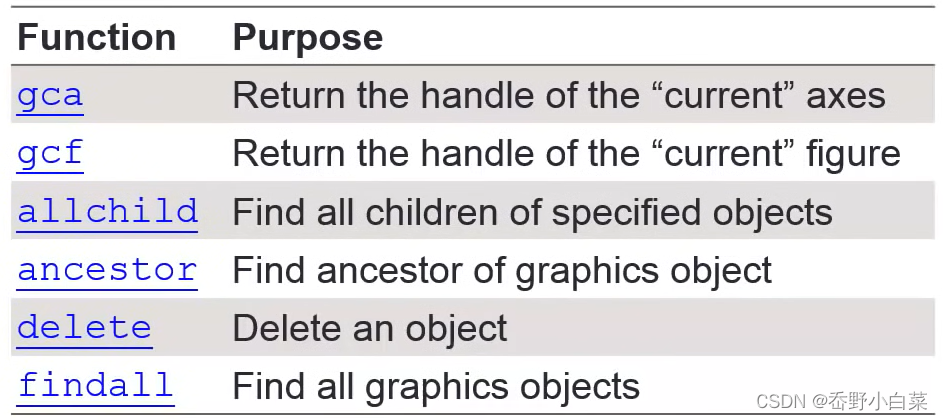
- Fetch or modify the object’s properties
To fetch propoties, useget()
To modify properties, useset()
x = linspace(0,2*pi,1000);
y = sin(x);
plot(x,y);
h = plot(x,y);
get(h)
AlignVertexCenters: ‘off’
Annotation: [1×1 matlab.graphics.eventdata.Annotation]
BeingDeleted: ‘off’
BusyAction: ‘queue’
ButtonDownFcn: ‘’
Children: [0×0 GraphicsPlaceholder]
Clipping: ‘on’
Color: [0 0.4470 0.7410]
CreateFcn: ‘’
DeleteFcn: ‘’
DisplayName: ‘’
HandleVisibility: ‘on’
HitTest: ‘on’
Interruptible: ‘on’
LineJoin: ‘round’
LineStyle: ‘-’
LineWidth: 0.5000
Marker: ‘none’
MarkerEdgeColor: ‘auto’
MarkerFaceColor: ‘none’
MarkerIndices: [1×1000 uint64]
MarkerSize: 6
Parent: [1×1 Axes]
PickableParts: ‘visible’
Selected: ‘off’
SelectionHighlight: ‘on’
Tag: ‘’
Type: ‘line’
UIContextMenu: [0×0 GraphicsPlaceholder]
UserData: []
Visible: ‘on’
XData: [1×1000 double]
XDataMode: ‘manual’
XDataSource: ‘’
YData: [1×1000 double]
YDataSource: ‘’
ZData: [1×0 double]
ZDataSource: ‘’
get(gca) % a 表示 axis
ALim: [0 1]
ALimMode: ‘auto’
ActivePositionProperty: ‘outerposition’
AlphaScale: ‘linear’
Alphamap: [1×64 double]
AmbientLightColor: [1 1 1]
BeingDeleted: ‘off’
Box: ‘on’
BoxStyle: ‘back’
BusyAction: ‘queue’
ButtonDownFcn: ‘’
CLim: [0 1]
CLimMode: ‘auto’
CameraPosition: [3.5000 0 17.3205]
CameraPositionMode: ‘auto’
CameraTarget: [3.5000 0 0]
CameraTargetMode: ‘auto’
CameraUpVector: [0 1 0]
CameraUpVectorMode: ‘auto’
CameraViewAngle: 6.6086
CameraViewAngleMode: ‘auto’
Children: [1×1 Line]
Clipping: ‘on’
ClippingStyle: ‘3dbox’
Color: [1 1 1]
ColorOrder: [7×3 double]
ColorOrderIndex: 2
ColorScale: ‘linear’
Colormap: [64×3 double]
CreateFcn: ‘’
CurrentPoint: [2×3 double]
DataAspectRatio: [3.5000 1 1]
DataAspectRatioMode: ‘auto’
DeleteFcn: ‘’
FontAngle: ‘normal’
FontName: ‘Helvetica’
FontSize: 10
FontSizeMode: ‘auto’
FontSmoothing: ‘on’
FontUnits: ‘points’
FontWeight: ‘normal’
GridAlpha: 0.1500
GridAlphaMode: ‘auto’
GridColor: [0.1500 0.1500 0.1500]
GridColorMode: ‘auto’
GridLineStyle: ‘-’
HandleVisibility: ‘on’
HitTest: ‘on’
Interruptible: ‘on’
LabelFontSizeMultiplier: 1.1000
Layer: ‘bottom’
Legend: [0×0 GraphicsPlaceholder]
LineStyleOrder: ‘-’
LineStyleOrderIndex: 1
LineWidth: 0.5000
MinorGridAlpha: 0.2500
MinorGridAlphaMode: ‘auto’
MinorGridColor: [0.1000 0.1000 0.1000]
MinorGridColorMode: ‘auto’
MinorGridLineStyle: ‘:’
NextPlot: ‘replace’
OuterPosition: [0 0 1 1]
Parent: [1×1 Figure]
PickableParts: ‘visible’
PlotBoxAspectRatio: [1 0.7882 0.7882]
PlotBoxAspectRatioMode: ‘auto’
Position: [0.1300 0.1100 0.7750 0.8150]
Projection: ‘orthographic’
Selected: ‘off’
SelectionHighlight: ‘on’
SortMethod: ‘childorder’
Tag: ‘’
TickDir: ‘in’
TickDirMode: ‘auto’
TickLabelInterpreter: ‘tex’
TickLength: [0.0100 0.0250]
TightInset: [0.0510 0.0527 0.0071 0.0200]
Title: [1×1 Text]
TitleFontSizeMultiplier: 1.1000
TitleFontWeight: ‘normal’
Toolbar: [1×1 AxesToolbar]
Type: ‘axes’
UIContextMenu: [0×0 GraphicsPlaceholder]
Units: ‘normalized’
UserData: []
View: [0 90]
Visible: ‘on’
XAxis: [1×1 NumericRuler]
XAxisLocation: ‘bottom’
XColor: [0.1500 0.1500 0.1500]
XColorMode: ‘auto’
XDir: ‘normal’
XGrid: ‘off’
XLabel: [1×1 Text]
XLim: [0 7]
XLimMode: ‘auto’
XMinorGrid: ‘off’
XMinorTick: ‘off’
XScale: ‘linear’
XTick: [0 1 2 3 4 5 6 7]
XTickLabel: {8×1 cell}
XTickLabelMode: ‘auto’
XTickLabelRotation: 0
XTickMode: ‘auto’
YAxis: [1×1 NumericRuler]
YAxisLocation: ‘left’
YColor: [0.1500 0.1500 0.1500]
YColorMode: ‘auto’
YDir: ‘normal’
YGrid: ‘off’
YLabel: [1×1 Text]
YLim: [-1 1]
YLimMode: ‘auto’
YMinorGrid: ‘off’
YMinorTick: ‘off’
YScale: ‘linear’
YTick: [-1 -0.8000 -0.6000 -0.4000 -0.2000 0 0.2000 0.4000 0.6000 0.8000 1]
YTickLabel: {11×1 cell}
YTickLabelMode: ‘auto’
YTickLabelRotation: 0
YTickMode: ‘auto’
ZAxis: [1×1 NumericRuler]
ZColor: [0.1500 0.1500 0.1500]
ZColorMode: ‘auto’
ZDir: ‘normal’
ZGrid: ‘off’
ZLabel: [1×1 Text]
ZLim: [-1 1]
ZLimMode: ‘auto’
ZMinorGrid: ‘off’
ZMinorTick: ‘off’
ZScale: ‘linear’
ZTick: [-1 0 1]
ZTickLabel: ‘’
ZTickLabelMode: ‘auto’
ZTickLabelRotation: 0
ZTickMode: ‘auto’
x = linspace(0,2*pi,1000);
y = sin(x);
plot(x,y);
h = plot(x,y);
get(h)
get(gca)
set(gca,'XLim',[0,2*pi]);
set(gca,'YLim',[-1.2,1.2]);

set(gca,'FontSize',25); % 更改字体

set(gca,'XTick',0:pi/2:2*pi); % 更改x轴刻度值

set(gca,'XTickLabel',0:90:360); % 更改x轴刻度显示

set(gca,'FontName','LaTeX'); % 采用Latex版本显示
set(gca,'XTickLabel',{'0','\pi/2','p','3\pi/2','2\pi'});

set(h,'LineStyle','-.','LineWidth',7.0,'Color','g');

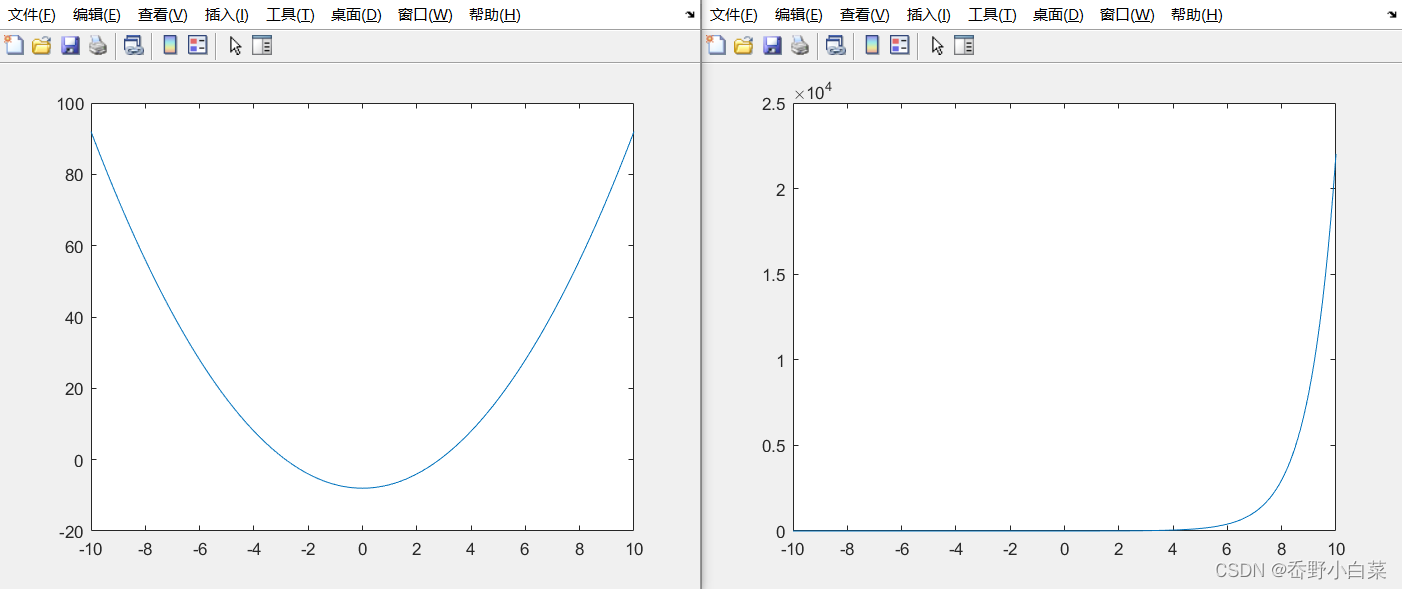
- Multiple Figures
Creat a figure window by callingfigure
Be careful when using thegcf、gcahandle where there exists multiple figures
x = -10:0.1:10;
y1 = x.^2 - 8;
y2 = exp(x);
figure,plot(x,y1);
figure,plot(x,y2);
- Several Plots in One Figure
- Several small plots ‘in a figure’:
subplot(m,n,1);
- Several small plots ‘in a figure’:
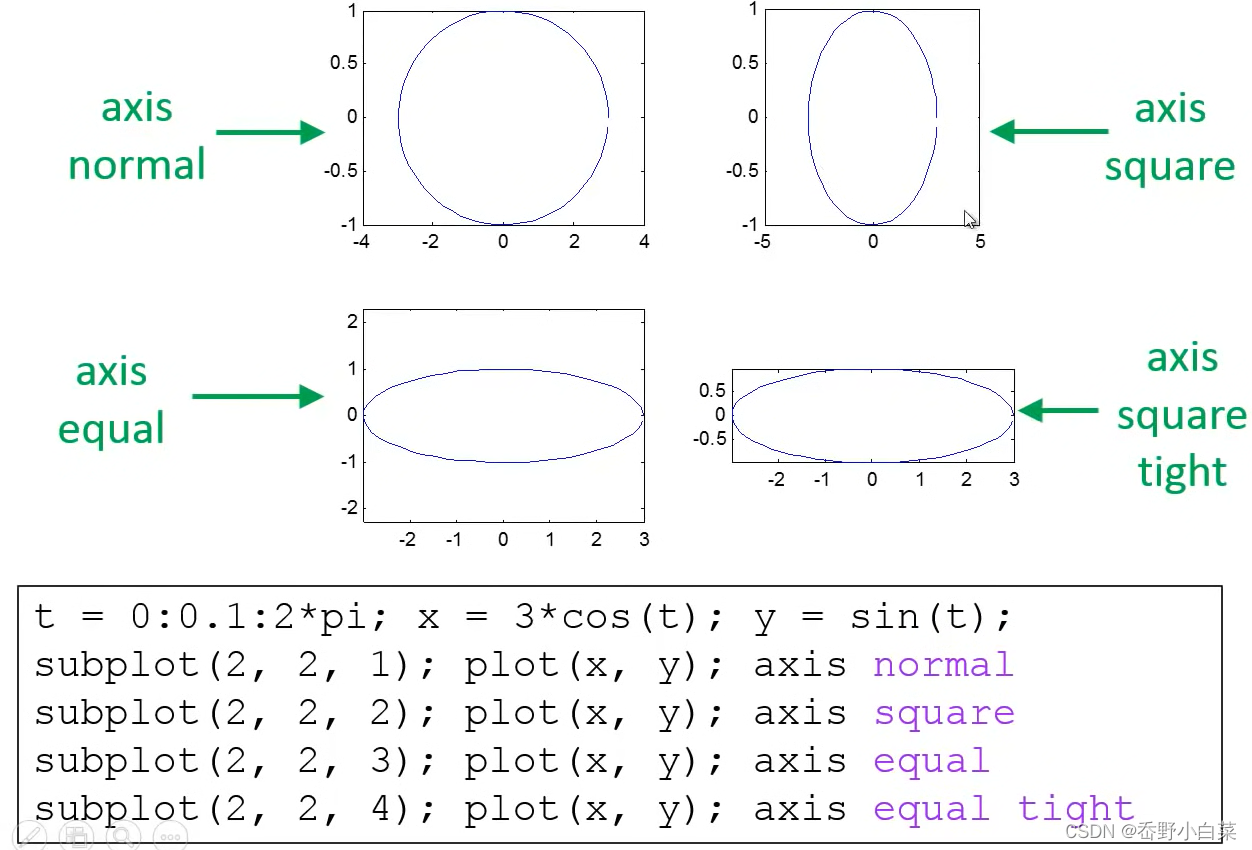
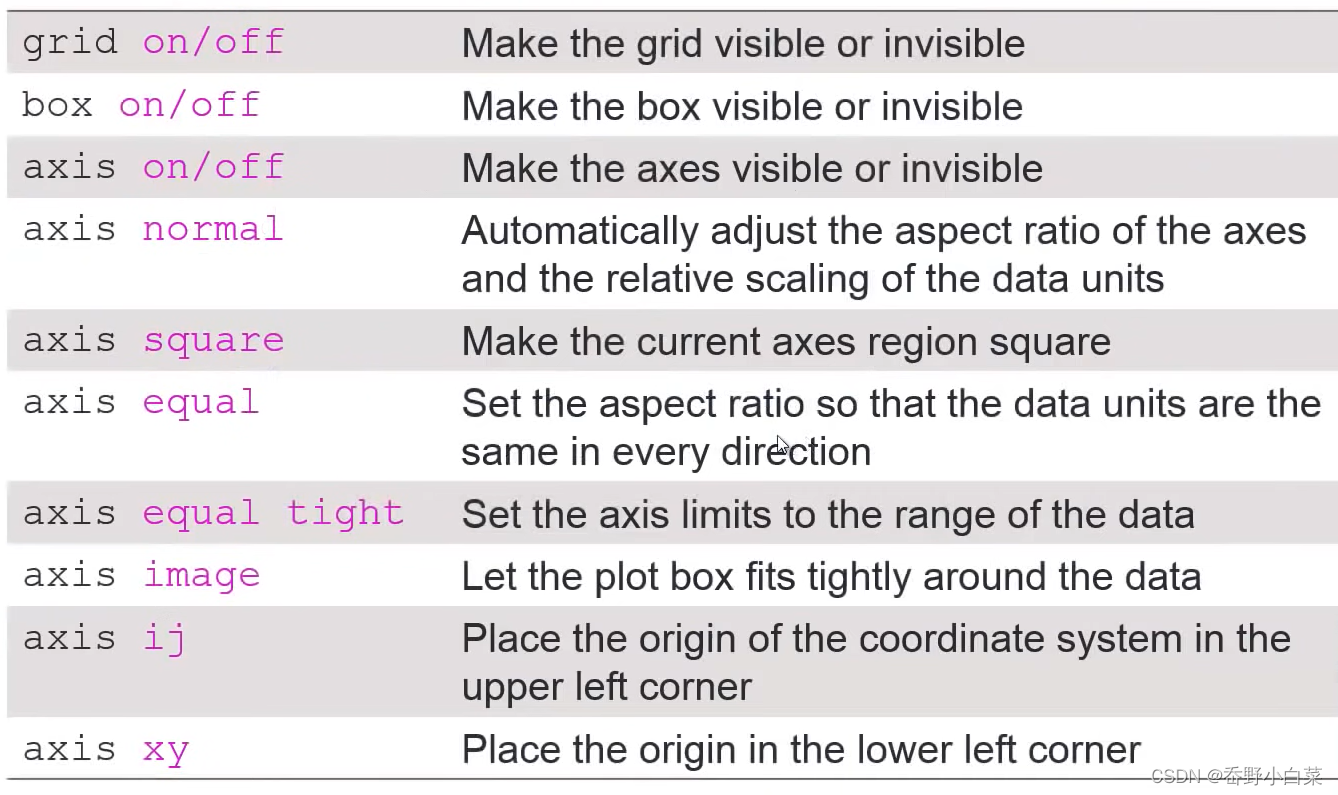
- Control of Grid, Box, and Axis
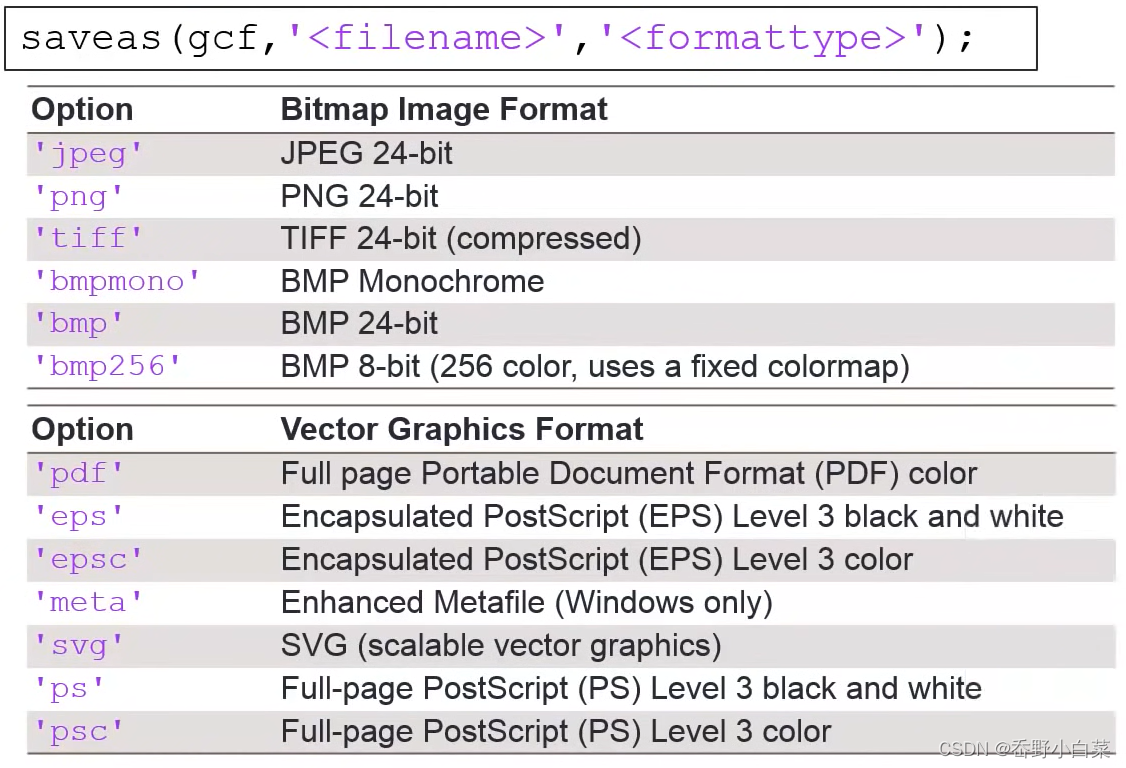
- Saving Figures into Files
高解析度需要使用print
Special Plots
- Logarithm Plots
x = logspace(-1,1,100); % x = 10^(-1)~10^1,共100个数
y = x.^2;
subplot(2,2,1); plot(x,y); title('Plot');
subplot(2,2,2); semilogx(x,y); title('SemilogX');
subplot(2,2,3); semilogy(x,y); title('SemilogY');
subplot(2,2,4); loglog(x,y); title('Loglog')

set(gca,'XGrid','on'); % 将最后一个x轴画网格

plotyy()
x = 0:0.01:20;
y1 = 200*exp(-0.05*x).*sin(x);
y2 = 0.8*exp(-0.5*x).*sin(10*x);
[AX,H1,H2] = plotyy(x,y1,x,y2);
set(get(AX(1),'Ylabel'),'String','Left Y-axis');
set(get(AX(2),'Ylabel'),'String','Right Y-axis');
title('Labeling plotyy');
set(H1,'LineStyle','--'); set(H2,'LineStyle',':');

- Histogram
y = randn(1,1000);
subplot(2,1,1); hist(y,10); title('Bins = 10');
subplot(2,1,2); hist(y,50); title('Bins = 50');

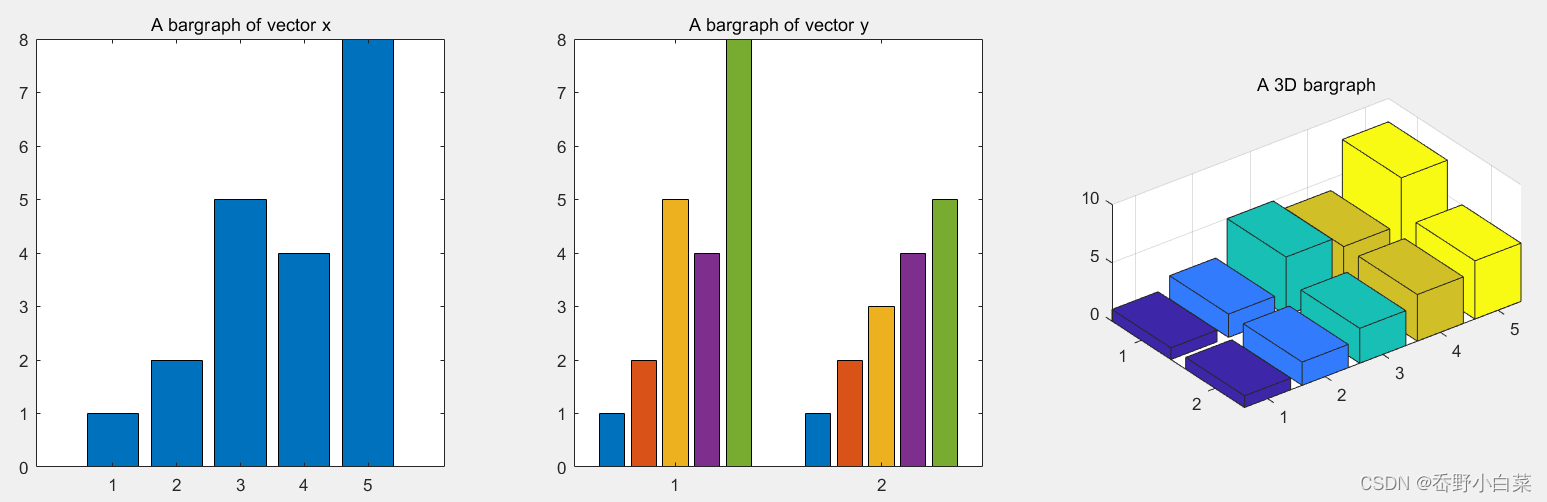
- Bar Charts
x = [1 2 5 4 8]; y = [x;1:5];
subplot(1,3,1); bar(x); title('A bargraph of vector x');
subplot(1,3,2); bar(y); title('A bargraph of vector y');
subplot(1,3,3); bar3(y); title('A 3D bargraph');
- Stacked and Horizontal Bar Charts
x = [1 2 5 4 8]; y = [x;1:5];
subplot(1,2,1); bar(y,'stacked'); title('Stacked');
subplot(1,2,2); barh(y); title('Horizontal');

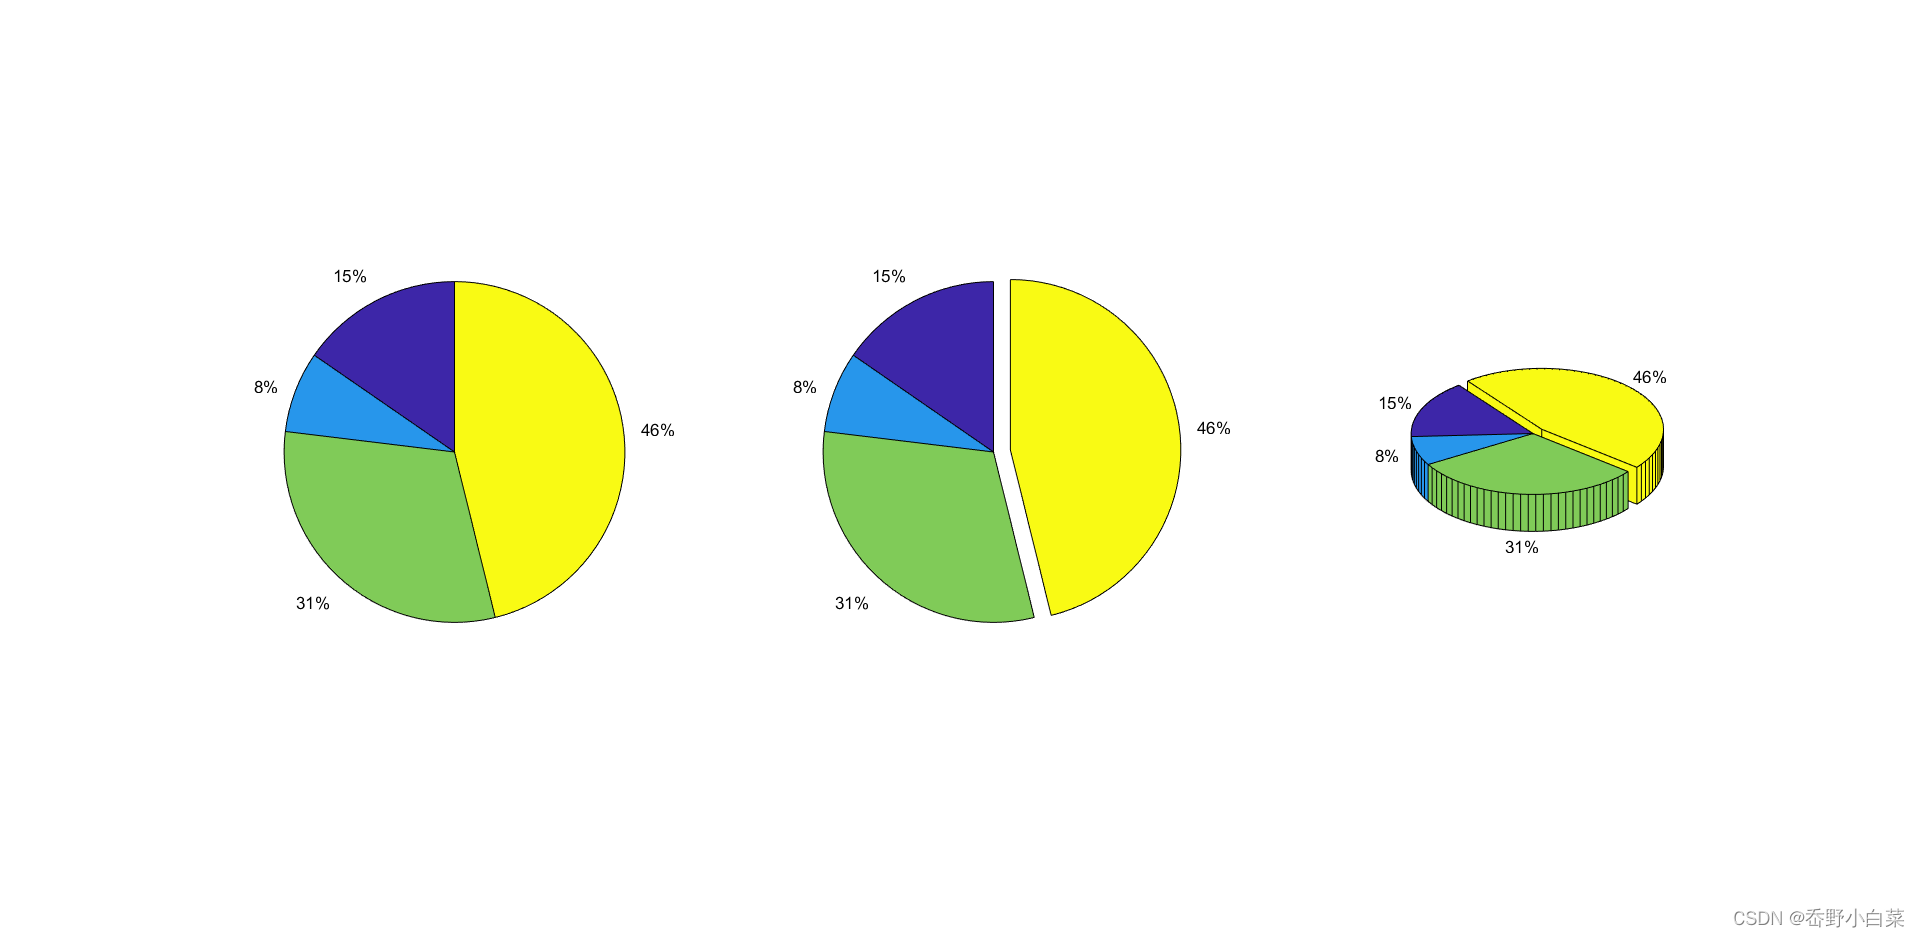
- Pie Charts
a = [10 5 20 30];
subplot(1,3,1); pie(a);
subplot(1,3,2); pie(a,[0,0,0,1]);
subplot(1,3,3); pie3(a,[0,0,0,1]);
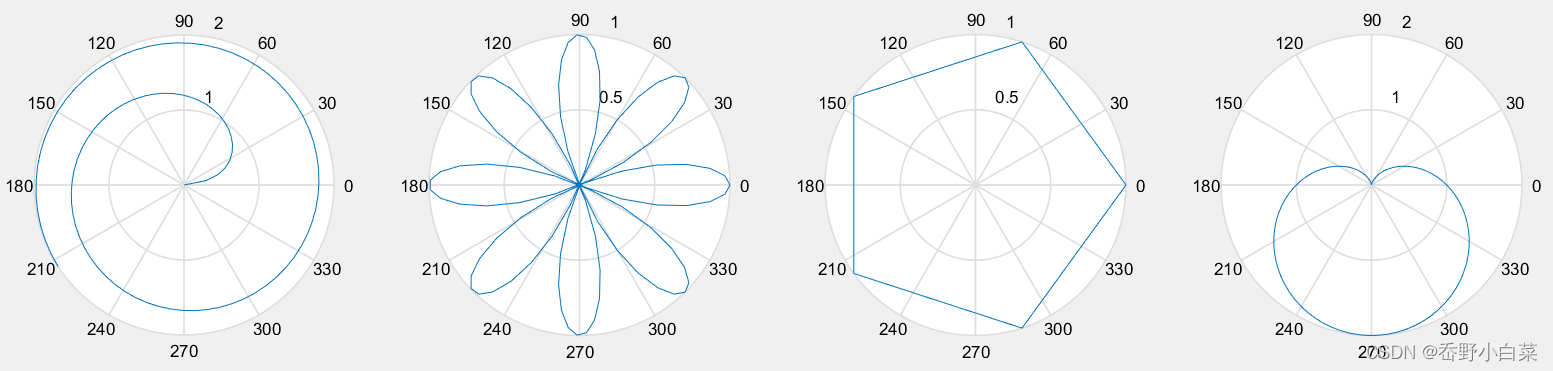
- Polar Chart
x = 1:100; theta = x/10; r = log10(x);
subplot(1,4,1); polar(theta,r);
theta = linspace(0,2*pi); r = cos(4*theta);
subplot(1,4,2); polar(theta,r);
theta = linspace(0,2*pi,6); r = ones(1,length(theta));
subplot(1,4,3); polar(theta,r);
theta = linspace(0,2*pi); r = 1-sin(theta);
subplot(1,4,4); polar(theta,r);
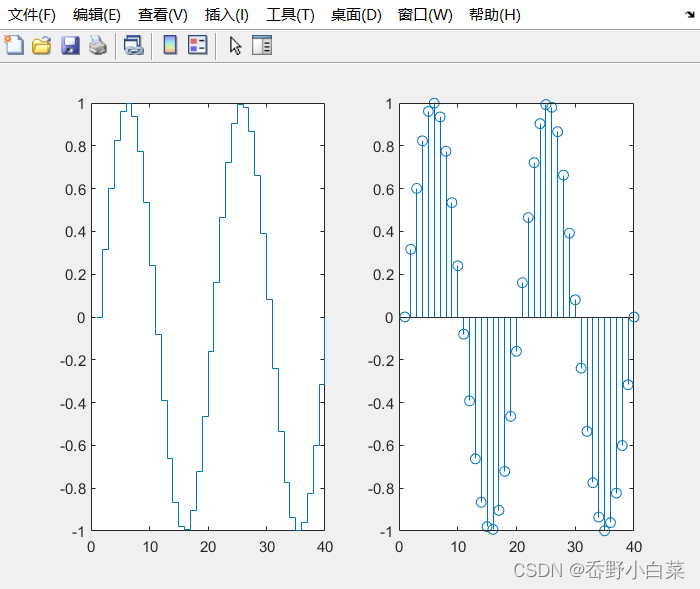
- Stairs and Stem Charts
x = linspace(0,4*pi,40); y = sin(x);
subplot(1,2,1); stairs(y);
subplot(1,2,2); stem(y);
fill()
t = (0:1:3)*pi/2; x = sin(t); y = cos(t);
h = fill(x,y,'y'); axis square off;
text(0,0,'WAIT','Color','k','FontSize',70,...
    'FontWeight','bold','HorizontalAlignment','center');
set(h,'LineWidth',5.0);

t = (1:2:15)'*pi/8; x = sin(t); y = cos(t);
fill(x,y,'r'); axis square off;
text(0,0,'STOP','Color','w','FontSize',80,...
    'FontWeight','bold','HorizontalAlignment','center');

- Color Space
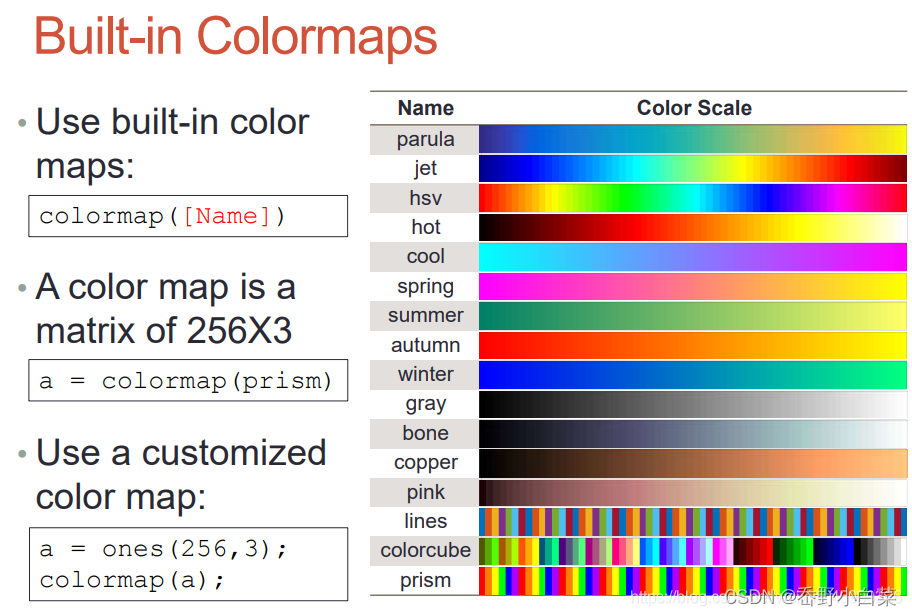
clear all;
g=0.3;
x=[1:10; 3:12; 5:14]; imagesc(x);
max_x = max(max(x)); min_x = min(min(x));
map = zeros(max_x,3);
for i=1:14
    map(i,2) = g;
    g = g + 0.05;
end
colormap(map);
colorbar;

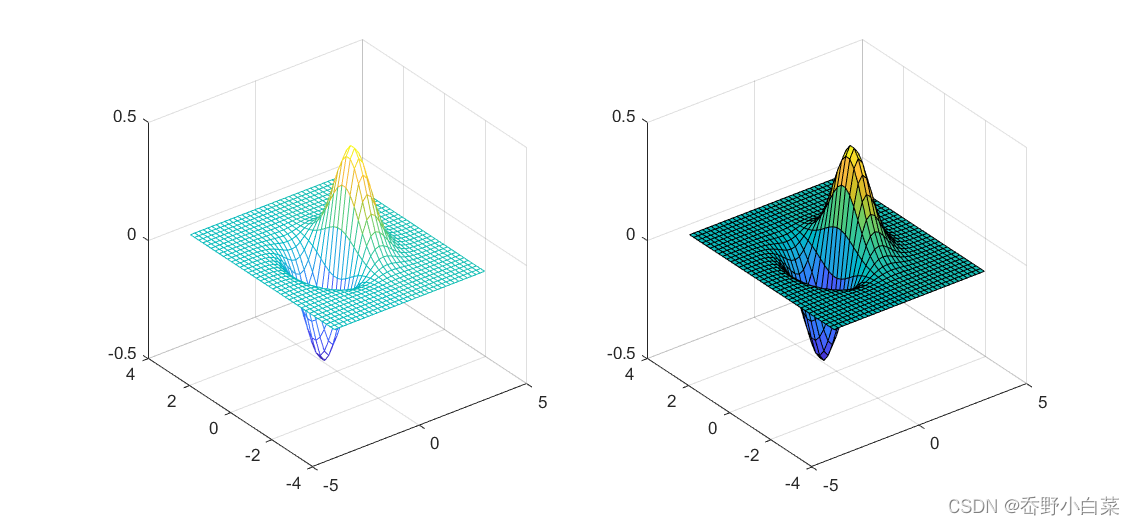
- Principles for 3D Surface Plots
- Use
meshgridto creat matrices X and Y for a given range - Surface Plots:
mesh()andsurf()
- Use
x = -3.5:0.2:3.5; y = -3.5:0.2:3.5;
[X,Y] = meshgrid(x,y);
Z = X.*exp(-X.^2 - Y.^2);
subplot(1,2,1); mesh(X,Y,Z);
subplot(1,2,2); surf(X,Y,Z);
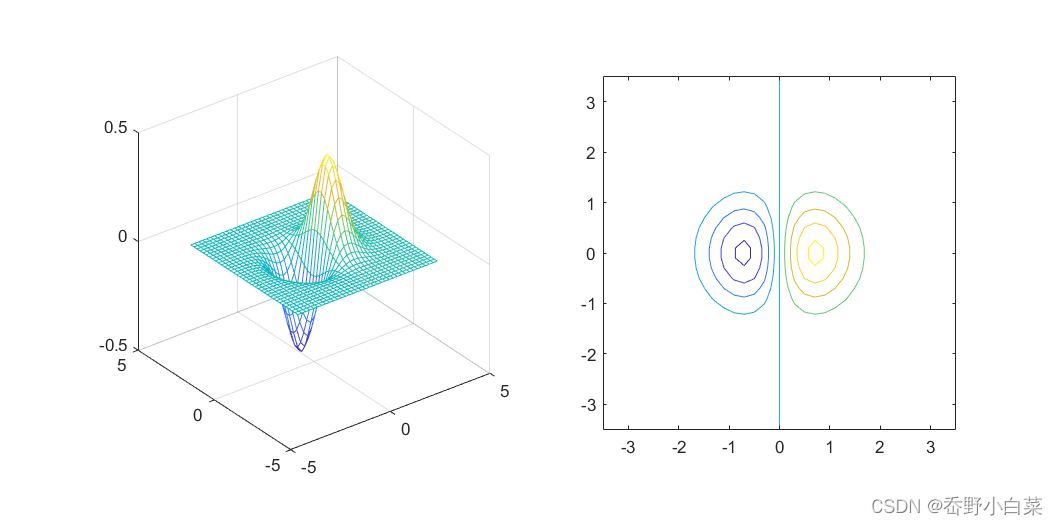
contour(): Projection of equal heights of 3D plot onto a 2D plane
x = -3.5:0.2:3.5; y = -3.5:0.2:3.5;
[X,Y] = meshgrid(x,y);
Z = X.*exp(-X.^2 - Y.^2);
subplot(1,2,1); mesh(X,Y,Z); axis square;
subplot(1,2,2); contour(X,Y,Z); axis square;
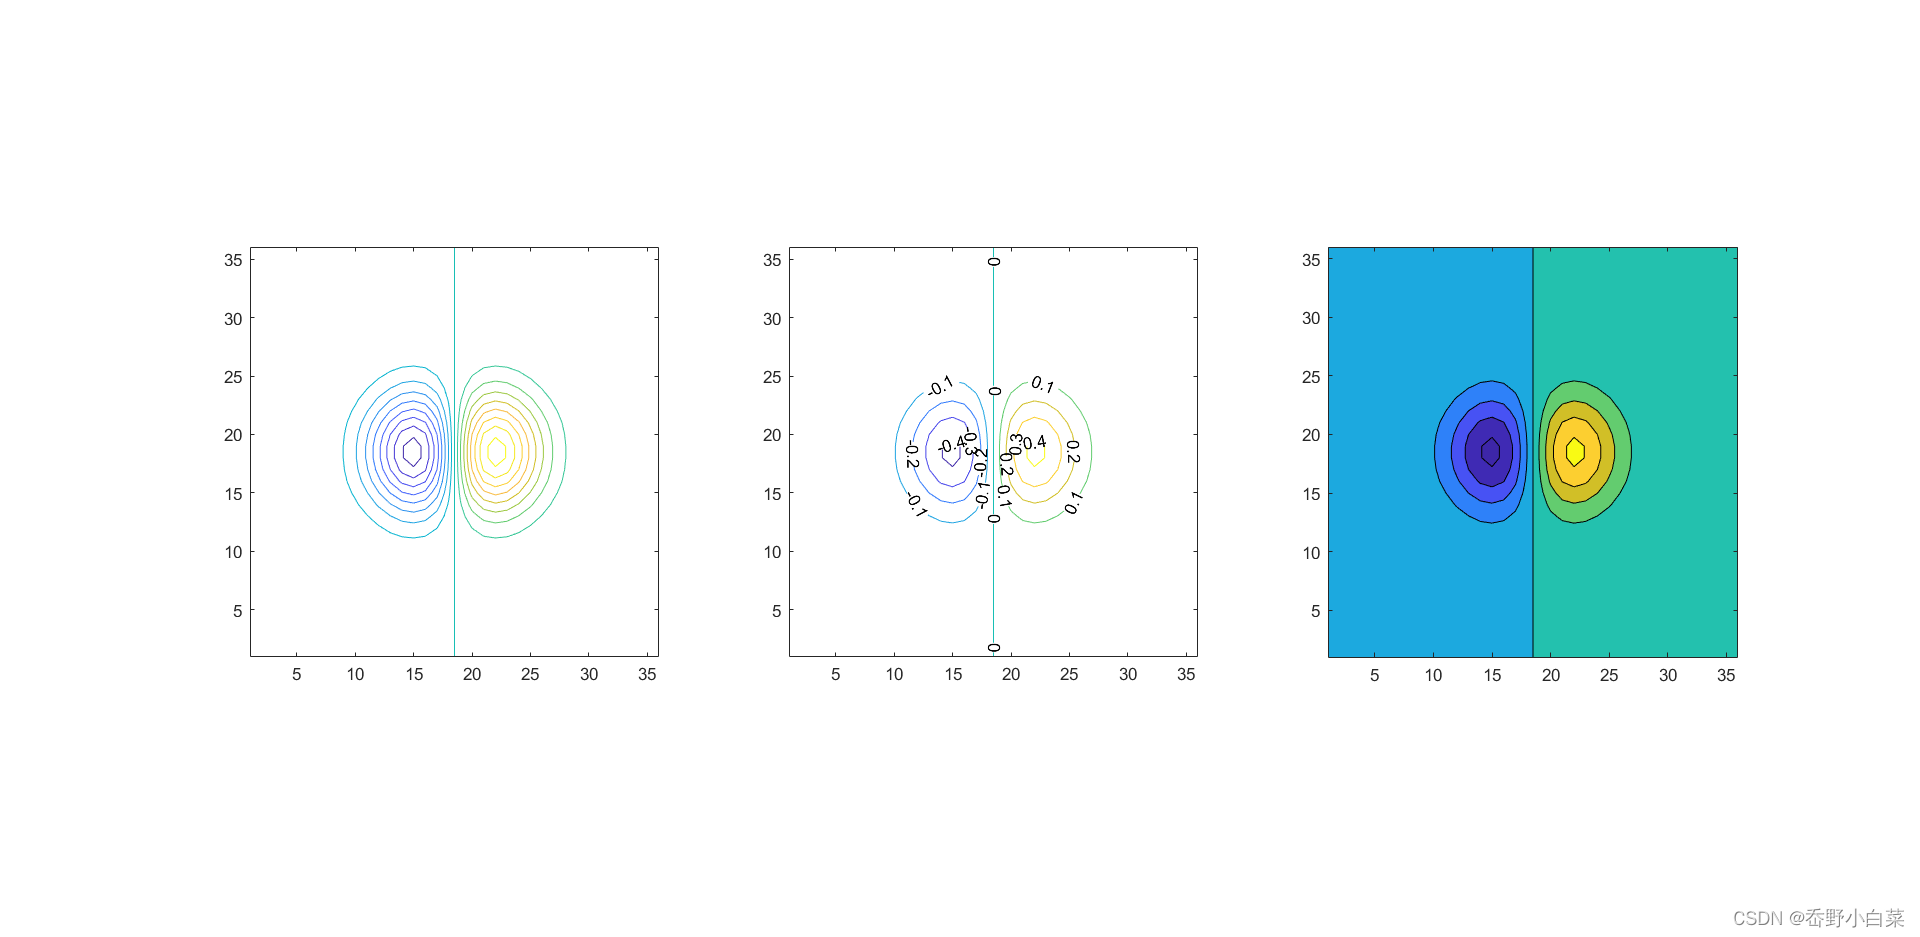
- Various Contour Plots
x = -3.5:0.2:3.5; y = -3.5:0.2:3.5;
[X,Y] = meshgrid(x,y); Z = X.*exp(-X.^2 - Y.^2);
subplot(1,3,1); contour(Z,[-.45:.05:.45]); axis square;
subplot(1,3,2); [C,h] = contour(Z); clabel(C,h); axis square;
subplot(1,3,3); contourf(Z); axis square;


 被折叠的 条评论
为什么被折叠?
被折叠的 条评论
为什么被折叠?
 到【灌水乐园】发言


