


使用 mplot3d 绘制 3D 图表
import matplotlib.pyplot as plt
from mpl_toolkits.mplot3d import axes3d
fig = plt.figure()
ax = fig.add_subplot(111, projection='3d')
# 获取测试数据
X, Y, Z = axes3d.get_test_data(0.05)
# 绘制 3D 线框图
ax.plot_wireframe(X, Y, Z, rstride=10, cstride=10)
plt.show()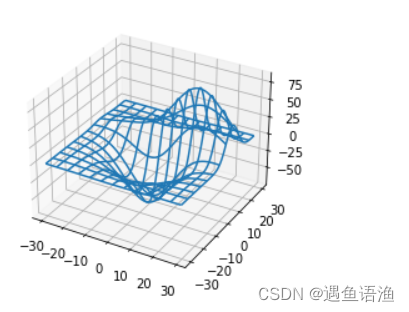
以上代码首先导入了 pyplot、axes3d 模块,其次创建了一个画布 fig 和 Axes3D 类的对象
ax,然后使用 axes3d 模块的 get_test_data() 函数获取了一些自带的测试数据,最后调用 plot_
wireframe() 方法绘制了一个 3D 线框图。
from mpl_toolkits.mplot3d import Axes3D
import matplotlib.pyplot as plt
from matplotlib import cm
import numpy as np
x1 = np.arange(-5, 5, 0.25)
y1 = np.arange(-5, 5, 0.25)
x1, y1 = np.meshgrid(x1, y1)
r1 = np.sqrt(x1**2 + y1**2)
z1 = np.sin(r1)
fig = plt.figure()
ax = fig.add_subplot(111, projection='3d')
# 绘制曲面图
ax.plot_surface(x1, y1, z1, cmap=cm.coolwarm, linewidth=0,antialiased=False)
# 设置 z 轴刻度的范围、 位置、 格式
ax.set_zlim(-1.01, 1.01)
plt.show()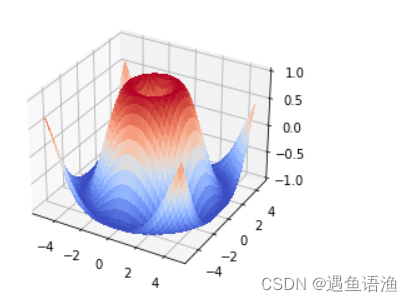
import numpy as np
import matplotlib.pyplot as plt
from mpl_toolkits.mplot3d import Axes3D
plt.rcParams["font.sans-serif"] = ["SimHei"]
plt.rcParams["axes.unicode_minus"] = False
# 生成测试数据
x = np.random.randint(0, 40, 30)
y = np.random.randint(0, 40, 30)
z = np.random.randint(0, 40, 30)
# 创建三维坐标系的绘图区域 , 并在该区域中绘制 3D 散点图
fig = plt.figure()
ax = fig.add_subplot(111, projection='3d')
for xx, yy, zz in zip(x, y, z):
    color = 'y'
    if 10 < zz < 20:
        color = '#C71585'
    elif zz >= 20:
        color = '#008B8B'
    ax.scatter(xx, yy, zz, c=color, marker='*', s=160,
       linewidth=1, edgecolor='black')
ax.set_xlabel('x 轴 ')
ax.set_ylabel('y 轴 ')
ax.set_zlabel('z 轴 ')
ax.set_title('3D 散点图 ', fontproperties='simhei', fontsize=14)
plt.tight_layout()
plt.show() 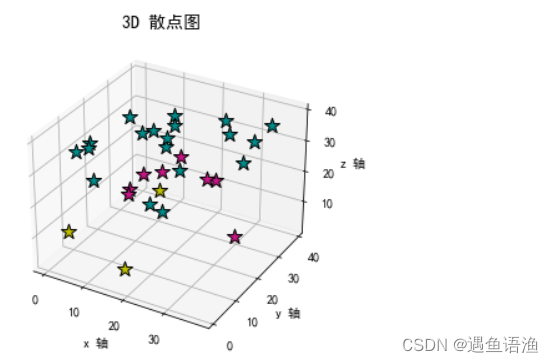


 被折叠的 条评论
为什么被折叠?
被折叠的 条评论
为什么被折叠?
 到【灌水乐园】发言


