


 本文探讨了如何在ECharts中实现柱状图与折线图的结合,使折线图沿x轴平移并与柱状图同步,并解决在一个页面中数据过多导致的滚动问题。作者提供了示例代码以调整轴设置和数据映射。
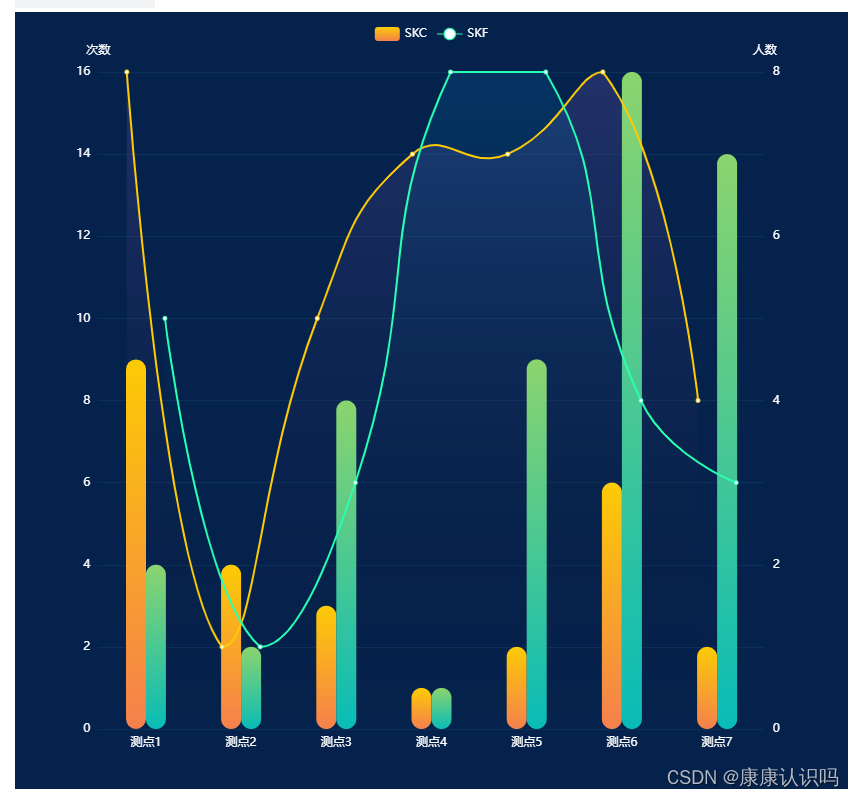
echart柱状图和折线图融合
实现折线图沿x轴平移,与柱状图保持一致。
目前只能在一个页面展示,不能支持溢出滚动,会变形
option = {
    backgroundColor: "#05224d",
    "legend": {
        "top": 10,
        "textStyle": {
                "color": "#fff"
            }
    },
    "tooltip": {},
    "xAxis": [{
        "data": ["测点1", "测点2", "测点3", "测点4", "测点5","测点6", "测点7"],
        "axisLabel": {
            "textStyle": {
                "color": "#fff"
            }
        },
        "axisTick": {
            "show": false
        },
        "axisLine": {
            "show": false,
        },
        "z": 10
    }],
    "yAxis": [{
        "axisLine": {
            "show": false
        },
        "axisTick": {
            "show": false
        },
        splitNumber: 7,
        splitLine: {
                show: true,
                lineStyle: {
                  color: "#0a3256",
                },
              },
        "type": "value",
        "name": "次数",
        nameTextStyle:{
                         color:"#fff",
                         fontSize:12,
                     },

        "min": 0,
        "max": 50,
        "interval": 5,
        "axisLabel": {
            "formatter": "{value}",
             "textStyle": {
                "color": "#fff"
            }

        }
    }, {
        "axisLine": {
            "show": false
        },
        "splitLine": {
            "show": false
        },
        "axisTick": {
            "show": false
        },
        "plitLine": {
            "show": false
        },
        "axisLabel": {
            "formatter": "{value}",
            "textStyle": {
                "color": "#fff"
            }
        },
        "type": "value",
        "name": "人数",
        nameTextStyle:{
                         color:"#fff",
                         fontSize:12,
                     },
        "min": 0,
        "max": 10,
    }],
    "series": [{
        "name": "SKC",
        "type": "bar",
        "barGap": 0,
        "data": [9, 4, 3, 1, 2,6,2],
         barWidth: '20px',
         itemStyle: {
            normal: {
              color: new echarts.graphic.LinearGradient(0, 0, 0, 1, [
                {
                  offset: 0,
                  color: "#fccb05",
                },
                {
                  offset: 1,
                  color: "#f5804d",
                },
              ]),
              barBorderRadius: 12,
            },
          },
    }, {
        "name": "SKC",
        xAxisIndex: 1,
        "smooth": true,
        "type": "line",
        "areaStyle": {
            "color": {
                "x": 0,
                "y": 0,
                "x2": 0,
                "y2": 1,
                "type": "linear",
                "global": false,
                "colorStops": [{
                    "offset": 0,
                    "color": "#9470DC"
                },
                 {
                    "offset": 1,
                    "color": "rgba(0,0,0, 0)"
                }]
            },
            "opacity": 0.2,
            "origin": "start"
        },
        "yAxisIndex": 1,
        "itemStyle": {
            "color": "#fccb05"
        },
        "data": [8, 1, 5, 7, 7, 8, 4],
    }, {
        "name": "SKC",
         barWidth: '20px',
        "type": "bar",
        "barGap": 0,
        "data": [4, 2, 8, 1, 9, 16, 14],
        itemStyle: {
            normal: {
              color: new echarts.graphic.LinearGradient(0, 0, 0, 1, [
                {
                  offset: 0,
                  color: "#8bd46e",
                },
                {
                  offset: 1,
                  color: "#09bcb7",
                },
              ]),
              barBorderRadius: 11,
            },
          },
    }, {
        "name": "SKF",
        xAxisIndex: 1,
        "smooth": true,
        "type": "line",
        "areaStyle": {
            "color": {
                "x": 0,
                "y": 0,
                "x2": 0,
                "y2": 1,
                "type": "linear",
                "global": false,
                "colorStops": [{
                    "offset": 0,
                    "color": "#017CB7"
                }, {
                    "offset": 1,
                    "color": "rgba(0,0,0, 0)"
                }]
            },
            "opacity": 0.2,
            "origin": "start"
        },
        "yAxisIndex": 1,
        "itemStyle": {
            "color": "#28ffb3"
        },
        "data": [5 , 1, 3, 8, 8, 4, 3],
        "markLine": {
            "symbol": "none",
            "data": []
        }
    },]
}

option.xAxis[1] = {
    type: 'value',
    //max: option.xAxis[0].data.length * 100,
    show: false
}

option.series[1].data = option.series[1].data.map((x, i) => [30 + i * 100, x])
option.series[3].data = option.series[3].data.map((x, i) => [70 + i * 100, x])
图表


 被折叠的 条评论
为什么被折叠?
被折叠的 条评论
为什么被折叠?
 到【灌水乐园】发言


