import numpy as np
import pandas as pd
df = pd.read_excel('pandas120.xlsx')
df
| createTime | education | salary |
|---|
| 0 | 2020-03-16 11:30:18 | 本科 | 20k-35k |
|---|
| 1 | 2020-03-16 10:58:48 | 本科 | 20k-40k |
|---|
| 2 | 2020-03-16 10:46:39 | 不限 | 20k-35k |
|---|
| 3 | 2020-03-16 10:45:44 | 本科 | 13k-20k |
|---|
| 4 | 2020-03-16 10:20:41 | 本科 | 10k-20k |
|---|
| ... | ... | ... | ... |
|---|
| 130 | 2020-03-16 11:36:07 | 本科 | 10k-18k |
|---|
| 131 | 2020-03-16 09:54:47 | 硕士 | 25k-50k |
|---|
| 132 | 2020-03-16 10:48:32 | 本科 | 20k-40k |
|---|
| 133 | 2020-03-16 10:46:31 | 本科 | 15k-23k |
|---|
| 134 | 2020-03-16 11:19:38 | 本科 | 20k-40k |
|---|
135 rows × 3 columns
df.head()
df.info()
<class 'pandas.core.frame.DataFrame'>
RangeIndex: 135 entries, 0 to 134
Data columns (total 3 columns):
 #   Column      Non-Null Count  Dtype
---  ------      --------------  -----
 0   createTime  135 non-null    datetime64[ns]
 1   education   135 non-null    object
 2   salary      135 non-null    object
dtypes: datetime64[ns](1), object(2)
memory usage: 3.3+ KB
import re
def func(df):
lst = df['salary'].split('-')
smin = int(lst[0].strip('k'))
smax = int(lst[1].strip('k'))
df['salary'] = int((smin + smax) / 2 * 1000)
return df
df = df.apply(func,axis=1)
print(df.groupby('education').mean())
df.groupby('education').agg({'salary':np.mean})
                 salary
education
不限         19600.000000
大专         10000.000000
本科         19361.344538
硕士         20642.857143
| salary |
|---|
| education | |
|---|
| 不限 | 19600.000000 |
|---|
| 大专 | 10000.000000 |
|---|
| 本科 | 19361.344538 |
|---|
| 硕士 | 20642.857143 |
|---|
df['createTime'] = df['createTime'].dt.strftime("%m-%d")
df.info()
<class 'pandas.core.frame.DataFrame'>
RangeIndex: 135 entries, 0 to 134
Data columns (total 3 columns):
 #   Column      Non-Null Count  Dtype
---  ------      --------------  -----
 0   createTime  135 non-null    object
 1   education   135 non-null    object
 2   salary      135 non-null    int64
dtypes: int64(1), object(2)
memory usage: 3.3+ KB
df.describe()
| salary |
|---|
| count | 135.000000 |
|---|
| mean | 19159.259259 |
|---|
| std | 8661.686922 |
|---|
| min | 3500.000000 |
|---|
| 25% | 14000.000000 |
|---|
| 50% | 17500.000000 |
|---|
| 75% | 25000.000000 |
|---|
| max | 45000.000000 |
|---|
bins = [0,5000,20000,50000]
group_names = ['低','中','高']
df['type'] = pd.cut(df['salary'],bins,labels =group_names )
df
| createTime | education | salary | type |
|---|
| 0 | 03-16 | 本科 | 27500 | 高 |
|---|
| 1 | 03-16 | 本科 | 30000 | 高 |
|---|
| 2 | 03-16 | 不限 | 27500 | 高 |
|---|
| 3 | 03-16 | 本科 | 16500 | 中 |
|---|
| 4 | 03-16 | 本科 | 15000 | 中 |
|---|
| ... | ... | ... | ... | ... |
|---|
| 130 | 03-16 | 本科 | 14000 | 中 |
|---|
| 131 | 03-16 | 硕士 | 37500 | 高 |
|---|
| 132 | 03-16 | 本科 | 30000 | 高 |
|---|
| 133 | 03-16 | 本科 | 19000 | 中 |
|---|
| 134 | 03-16 | 本科 | 30000 | 高 |
|---|
135 rows × 4 columns
df.sort_values('salary',ascending=False)
a = df['salary'].sort_values(ascending=False).to_list()
df.loc[32]
createTime    03-16
education        硕士
salary        22500
type              高
Name: 32, dtype: object
df['salary'].median()
np.median(df['salary'])
17500.0
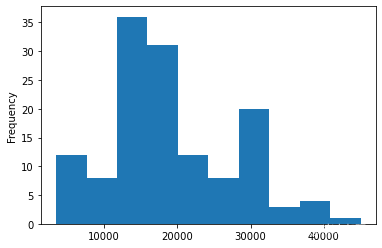
df['salary'].plot(kind='hist')
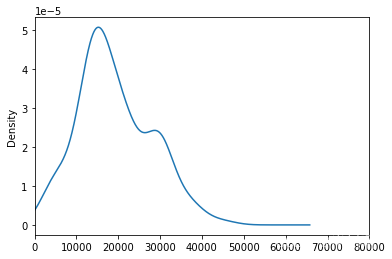
df['salary'].plot(kind = 'kde',xlim=(0,80000))
df = df.drop('type',1)
df['new_columns'] = df['createTime'] + df['education']
df['new_columns'] = df['createTime'].str.cat(df['education'])
df['test'] = df['education'] + df['salary'].astype('str')
df['test'] = df['education'] + df['salary'].map(str)
df
| createTime | education | salary | new_columns | test |
|---|
| 0 | 03-16 | 本科 | 27500 | 03-16本科 | 本科27500 |
|---|
| 1 | 03-16 | 本科 | 30000 | 03-16本科 | 本科30000 |
|---|
| 2 | 03-16 | 不限 | 27500 | 03-16不限 | 不限27500 |
|---|
| 3 | 03-16 | 本科 | 16500 | 03-16本科 | 本科16500 |
|---|
| 4 | 03-16 | 本科 | 15000 | 03-16本科 | 本科15000 |
|---|
| ... | ... | ... | ... | ... | ... |
|---|
| 130 | 03-16 | 本科 | 14000 | 03-16本科 | 本科14000 |
|---|
| 131 | 03-16 | 硕士 | 37500 | 03-16硕士 | 硕士37500 |
|---|
| 132 | 03-16 | 本科 | 30000 | 03-16本科 | 本科30000 |
|---|
| 133 | 03-16 | 本科 | 19000 | 03-16本科 | 本科19000 |
|---|
| 134 | 03-16 | 本科 | 30000 | 03-16本科 | 本科30000 |
|---|
135 rows × 5 columns
chazhi = df['salary'].max() - df['salary'].min()
chazhi
41500
pd.concat([df[:1], df[-2:-1]])
| createTime | education | salary | new_columns | test |
|---|
| 0 | 03-16 | 本科 | 27500 | 03-16本科 | 本科27500 |
|---|
| 133 | 03-16 | 本科 | 19000 | 03-16本科 | 本科19000 |
|---|
df.append(df.iloc[7])
| createTime | education | salary | new_columns | test |
|---|
| 0 | 03-16 | 本科 | 27500 | 03-16本科 | 本科27500 |
|---|
| 1 | 03-16 | 本科 | 30000 | 03-16本科 | 本科30000 |
|---|
| 2 | 03-16 | 不限 | 27500 | 03-16不限 | 不限27500 |
|---|
| 3 | 03-16 | 本科 | 16500 | 03-16本科 | 本科16500 |
|---|
| 4 | 03-16 | 本科 | 15000 | 03-16本科 | 本科15000 |
|---|
| ... | ... | ... | ... | ... | ... |
|---|
| 131 | 03-16 | 硕士 | 37500 | 03-16硕士 | 硕士37500 |
|---|
| 132 | 03-16 | 本科 | 30000 | 03-16本科 | 本科30000 |
|---|
| 133 | 03-16 | 本科 | 19000 | 03-16本科 | 本科19000 |
|---|
| 134 | 03-16 | 本科 | 30000 | 03-16本科 | 本科30000 |
|---|
| 7 | 03-16 | 本科 | 12500 | 03-16本科 | 本科12500 |
|---|
136 rows × 5 columns
df.dtypes
createTime     object
education      object
salary          int64
new_columns    object
test           object
dtype: object
df.set_index("createTime")
| education | salary | new_columns | test |
|---|
| createTime | | | | |
|---|
| 03-16 | 本科 | 27500 | 03-16本科 | 本科27500 |
|---|
| 03-16 | 本科 | 30000 | 03-16本科 | 本科30000 |
|---|
| 03-16 | 不限 | 27500 | 03-16不限 | 不限27500 |
|---|
| 03-16 | 本科 | 16500 | 03-16本科 | 本科16500 |
|---|
| 03-16 | 本科 | 15000 | 03-16本科 | 本科15000 |
|---|
| ... | ... | ... | ... | ... |
|---|
| 03-16 | 本科 | 14000 | 03-16本科 | 本科14000 |
|---|
| 03-16 | 硕士 | 37500 | 03-16硕士 | 硕士37500 |
|---|
| 03-16 | 本科 | 30000 | 03-16本科 | 本科30000 |
|---|
| 03-16 | 本科 | 19000 | 03-16本科 | 本科19000 |
|---|
| 03-16 | 本科 | 30000 | 03-16本科 | 本科30000 |
|---|
135 rows × 4 columns
df1 = pd.DataFrame(pd.Series(np.random.randint(1, 10, 135)))
df1
| 0 |
|---|
| 0 | 3 |
|---|
| 1 | 9 |
|---|
| 2 | 7 |
|---|
| 3 | 5 |
|---|
| 4 | 3 |
|---|
| ... | ... |
|---|
| 130 | 2 |
|---|
| 131 | 3 |
|---|
| 132 | 6 |
|---|
| 133 | 3 |
|---|
| 134 | 7 |
|---|
135 rows × 1 columns
df= pd.concat([df,df1],axis=1)
df
| createTime | education | salary | new_columns | test | 0 |
|---|
| 0 | 03-16 | 本科 | 27500 | 03-16本科 | 本科27500 | 3 |
|---|
| 1 | 03-16 | 本科 | 30000 | 03-16本科 | 本科30000 | 9 |
|---|
| 2 | 03-16 | 不限 | 27500 | 03-16不限 | 不限27500 | 7 |
|---|
| 3 | 03-16 | 本科 | 16500 | 03-16本科 | 本科16500 | 5 |
|---|
| 4 | 03-16 | 本科 | 15000 | 03-16本科 | 本科15000 | 3 |
|---|
| ... | ... | ... | ... | ... | ... | ... |
|---|
| 130 | 03-16 | 本科 | 14000 | 03-16本科 | 本科14000 | 2 |
|---|
| 131 | 03-16 | 硕士 | 37500 | 03-16硕士 | 硕士37500 | 3 |
|---|
| 132 | 03-16 | 本科 | 30000 | 03-16本科 | 本科30000 | 6 |
|---|
| 133 | 03-16 | 本科 | 19000 | 03-16本科 | 本科19000 | 3 |
|---|
| 134 | 03-16 | 本科 | 30000 | 03-16本科 | 本科30000 | 7 |
|---|
135 rows × 6 columns
df["new"] = df["salary"] - df[0]
df
| createTime | education | salary | new_columns | test | 0 | new |
|---|
| 0 | 03-16 | 本科 | 27500 | 03-16本科 | 本科27500 | 3 | 27497 |
|---|
| 1 | 03-16 | 本科 | 30000 | 03-16本科 | 本科30000 | 9 | 29991 |
|---|
| 2 | 03-16 | 不限 | 27500 | 03-16不限 | 不限27500 | 7 | 27493 |
|---|
| 3 | 03-16 | 本科 | 16500 | 03-16本科 | 本科16500 | 5 | 16495 |
|---|
| 4 | 03-16 | 本科 | 15000 | 03-16本科 | 本科15000 | 3 | 14997 |
|---|
| ... | ... | ... | ... | ... | ... | ... | ... |
|---|
| 130 | 03-16 | 本科 | 14000 | 03-16本科 | 本科14000 | 2 | 13998 |
|---|
| 131 | 03-16 | 硕士 | 37500 | 03-16硕士 | 硕士37500 | 3 | 37497 |
|---|
| 132 | 03-16 | 本科 | 30000 | 03-16本科 | 本科30000 | 6 | 29994 |
|---|
| 133 | 03-16 | 本科 | 19000 | 03-16本科 | 本科19000 | 3 | 18997 |
|---|
| 134 | 03-16 | 本科 | 30000 | 03-16本科 | 本科30000 | 7 | 29993 |
|---|
135 rows × 7 columns
df.isnull().values.any()
False
df['salary'] = df['salary'].astype('float')
df.info()
<class 'pandas.core.frame.DataFrame'>
RangeIndex: 135 entries, 0 to 134
Data columns (total 7 columns):
 #   Column       Non-Null Count  Dtype
---  ------       --------------  -----
 0   createTime   135 non-null    object
 1   education    135 non-null    object
 2   salary       135 non-null    float64
 3   new_columns  135 non-null    object
 4   test         135 non-null    object
 5   0            135 non-null    int32
 6   new          135 non-null    int64
dtypes: float64(1), int32(1), int64(1), object(4)
memory usage: 7.0+ KB
aa = df[df['salary']>10000]
aa.shape[0]
len(aa)
aa.count()[0]
119
df['education'].value_counts()
本科    119
硕士      7
不限      5
大专      4
Name: education, dtype: int64
len(df['education'].value_counts())
df['education'].nunique()
len(df['education'].unique())
4
df[df['salary'] + df['new'] >= 60000].iloc[-3:]
df1 = df[['salary','new']]
rowsums = df1.apply(np.sum, axis=1)
res = df.iloc[np.where(rowsums > 60000)[0][-3:], :]
res
| createTime | education | salary | new_columns | test | 0 | new |
|---|
| 92 | 03-16 | 本科 | 35000.0 | 03-16本科 | 本科35000 | 7 | 34993 |
|---|
| 101 | 03-16 | 本科 | 37500.0 | 03-16本科 | 本科37500 | 7 | 37493 |
|---|
| 131 | 03-16 | 硕士 | 37500.0 | 03-16硕士 | 硕士37500 | 3 | 37497 |
|---|


 本文档演示了如何使用Python的pandas库读取Excel数据,进行数据转换、分组计算、时间格式化、数值统计、数据分桶、数据合并等操作。涉及到的技能包括数据清洗、数据类型转换、数据可视化及数据分组分析。


 被折叠的 条评论
为什么被折叠?
被折叠的 条评论
为什么被折叠?
 到【灌水乐园】发言


