如何排查cpu load 飙高问题

前言

服务器cpu彪高,我感觉是常遇见的问题,有经验的程序员,我想大部分都碰到过。我是一名Java程序员,我排查过很多类似的问题。总结一下排查问题的步骤,以便后面可以直接来复制粘贴命令.

问题排查步骤

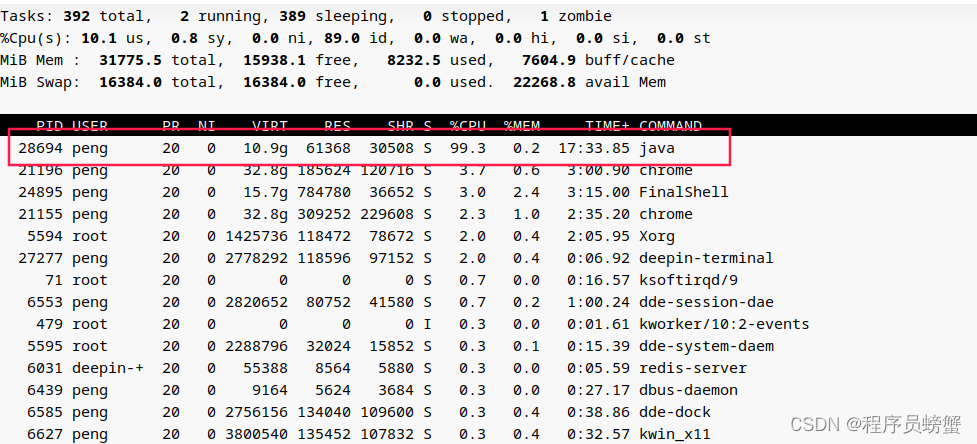
  1. 使用top命令查看cpu占用高的进程:28694
    在这里插入图片描述 2. 使用命令 top -H -p 28694 定位到28694进程中占用cpu最高的线程:28696在这里插入图片描述
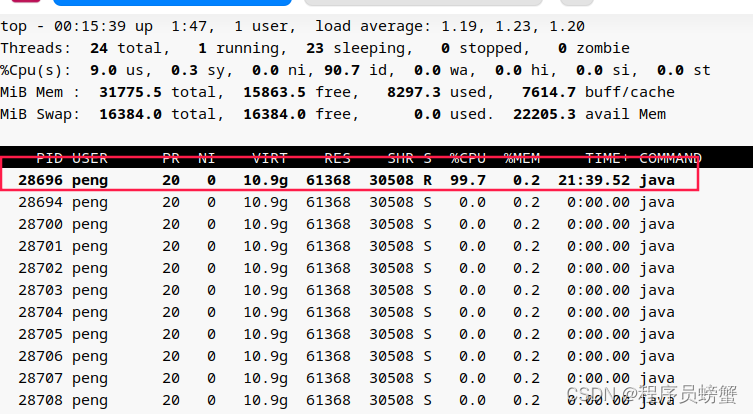
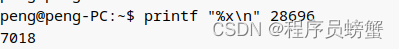
  2. 使用 printf “%x\n” 29696 转成16进制:7018
    在这里插入图片描述
  3. 使用 jstack 28694 | grep “7018” -A 10 输出导致彪高的堆栈代码
    在这里插入图片描述
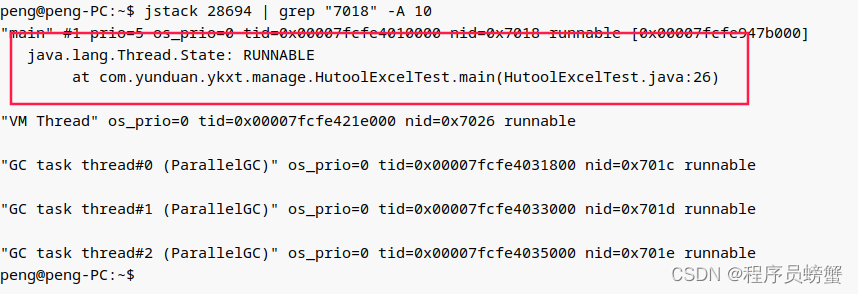
  4. 分析该代码,可以从调用方,代码本身,异常情况等分析具体原因

案例

背景:之前我负责一个继续教育的sass系统,上线使用后正常,也预估了一定的资源空间,但有一段时间cpu老是会彪高,接受到告警。
问题排查:通过上述五个步骤,我定位到是学生学习课程的接口调用频繁导致的。按照并发量分析,不应该有这么大流量,当时用户量才十来万,我再去查看nginx日志,发现一个特定ip在疯狂刷接口,分析是破解接口,使用程序刷学习得分。
解决方案:零时方案使用nginx针对ip进行限流,最终方案是限流加接口验签

### CPU Usage Spike Troubleshooting Methods When encountering a situation where CPU usage spikes, several systematic approaches can be employed to diagnose and resolve the issue. The methodologies encompass monitoring tools utilization, log analysis, performance counters review, and specific commands execution depending on the environment. For environments using certain network testing utilities, one might use `generic_send_tcp` with parameters such as `<Target IP> <Target Port>` alongside scripts like `spike_script`, which could help simulate traffic or test responses that may lead to understanding what triggers high CPU conditions[^1]. However, this approach is more about generating load rather than directly diagnosing issues unless used in controlled scenarios for benchmarking or stress-testing applications suspected of causing spikes. In database-related contexts, analyzing bottlenecks involves examining operations' timing within systems. Tools designed specifically for database management provide insights into how long queries take, helping identify inefficient processes consuming excessive resources over time[^3]. Commands issued in High Availability Disaster Recovery (HADR) setups offer insight into system configurations but are not direct means for troubleshooting CPU spikes. Commands related to HADR setup focus on ensuring replication between primary and secondary servers through socket buffer sizes adjustment and disk settings configuration[^2], which indirectly contribute by optimizing overall server efficiency potentially reducing unnecessary loads leading to CPU peaks. To effectively troubleshoot CPU spikes: - Utilize operating system built-in monitors or third-party software capable of providing real-time statistics. - Review application logs along with any available stack traces during periods when CPUs were overloaded. - Examine process lists identifying resource-intensive tasks running at times corresponding to increased activity levels. - Adjust scheduling policies if preemptive multitasking causes context switching overhead contributing significantly towards higher consumption rates. ```bash top -b -n 1 | head -n 12 ``` This command provides an overview of current top processes sorted by their CPU usage percentage allowing administrators to pinpoint problematic services quickly.
评论
添加红包

请填写红包祝福语或标题

红包个数最小为10个

红包金额最低5元

当前余额3.43前往充值 >
需支付:10.00
成就一亿技术人!
领取后你会自动成为博主和红包主的粉丝 规则
hope_wisdom
发出的红包
实付
使用余额支付
点击重新获取
扫码支付
钱包余额 0

抵扣说明:

1.余额是钱包充值的虚拟货币,按照1:1的比例进行支付金额的抵扣。
2.余额无法直接购买下载,可以购买VIP、付费专栏及课程。

余额充值