


 本文详细介绍了如何使用Echarts实现两个柱状图之间的联动效果,包括配置相同的legend、定制legend的点击行为,以及处理隐藏和显示数据的问题。通过实例代码展示了如何确保legend的同步选择影响两个图表的展示。
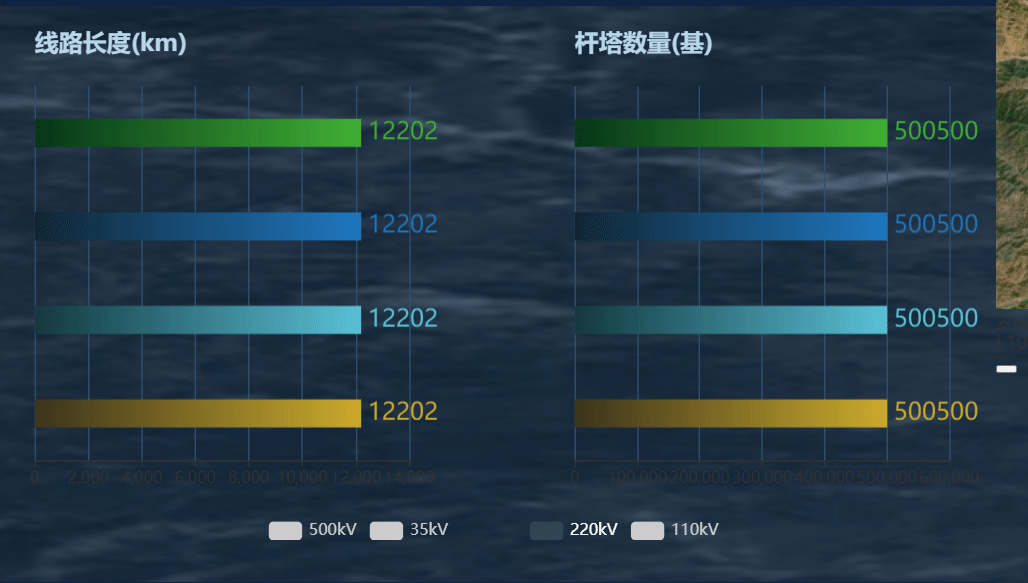
一、效果
实现如下的双柱图联动
二、需求分析
1. 两个echarts实现联动
用到echarts中的 echarts.connect([图表名称1,图表名称2])
 let stackingBar1 = this.$echarts.init(document.getElementById("myCharts1"));
 let stackingBar2 = this.$echarts.init(document.getElementById("myCharts2"));
 stackingBar1.setOption(option1);
 stackingBar2.setOption(option2);
 echarts.connect([stackingBar1, stackingBar2]);
这里有一个坑,legend必须一样,不然联动不了
2. legend点击只显示当前legend的数据
首先配置legend,第一个为默认显示,其他项隐藏
selected: {

            "220kV": true,
            "110kV": false,
            "500kV": false,
            "35kV": false,
          },
data: ["500kV", "35kV", "220kV", "110kV"],
写legend的点击事件(legendselectchanged),点击的时候设置为true,没有点击的时候设置为false
stackingBar2.on("legendselectchanged", function (params) {

        for (var index = 0; index < option2.legend.data.length; index++) {

          if (params.name == option2.legend.data[index]) {

            option2.legend.selected[params.name] = true;
            stackingBar2.setOption(option2);
            stackingBar1.setOption(option1);
          } else {

            console.log(option2.legend.data[index]);
            option2.legend.selected[option2.legend.data[index]] = false;
            stackingBar2.setOption(option2);
          }
        }
        // do something
      });
3.因需要联动,所以只能legend的data只能写4个,并没有找到隐藏其中的legend,实际需要两个,只能移动出图表
legend: {

          show: true,
          left: "-55%",
          right: "2%",
          x: "center",
          y: "bottom",
          padding: [10, 10, 0, 50],
          width: "100%",
          textStyle: {

            color: "#fff",
          },
          selected: {

            "220kV": true,
            "110kV": false,
            "500kV": false,
            "35kV": false,
          },
          data: ["500kV", "35kV", "220kV", "110kV"],
        },
三、源码
<template>
  <div class="transmit-electricity">

    <div class="power-monitoring-content">
      <div class="power-monitoring-content_top"></div>
      <div class="power-monitoring-content_bottom">
        <!-- <div
          class="powerMonitoringContentEcharts"
          id="powerMonitoringContentEcharts"
          style="width: auto; height: 300px"
        ></div> -->
        <div
          class="my-charts1"
          id="myCharts1"
          style="width: 300px; height: 400px"
        ></div>
        <div
          class="my-charts2"
          id="myCharts2"
          style="width: 300px; height: 400px"
        ></div>
      </div>
    </div>
    <div class="power-monitoring-bottom"></div>
  </div>
</template>
<script>
import echarts from "echarts";
export default {

  data() {

    return {
   };
  },
  created() {
   },
  watch: {
   },
  mounted() {

    let that = this;
    that.drawDoubleEcharts();
  },
  methods: {

    drawDoubleEcharts() {

      let that = this;

      let option1 = {

        title: {

          text: "线路长度(km)",
          padding: [20, 0, 0, 35],
          textStyle: {

            color: "#B8D7E9",
          },
        },
        barWidth: "30%",
        legend: {

          show: true,
          left: "60%",
          right: "2%",
          x: "center", //可设定图例在左、右、居中
          y: "bottom", //可设定图例在上、下、居中
          padding: [0, 100, 0, 0],
          width: "100%",
          selected: {

            "220kV": true,
            "110kV": false,
 最低0.47元/天 解锁文章


 被折叠的 条评论
为什么被折叠?
被折叠的 条评论
为什么被折叠?
 到【灌水乐园】发言


