


 本文介绍了一种使用Python处理和分析性能数据的方法,并通过图表直观展示数据趋势。具体包括从文本文件读取数据,利用numpy和scipy进行数据处理,以及使用matplotlib绘制对比图表。
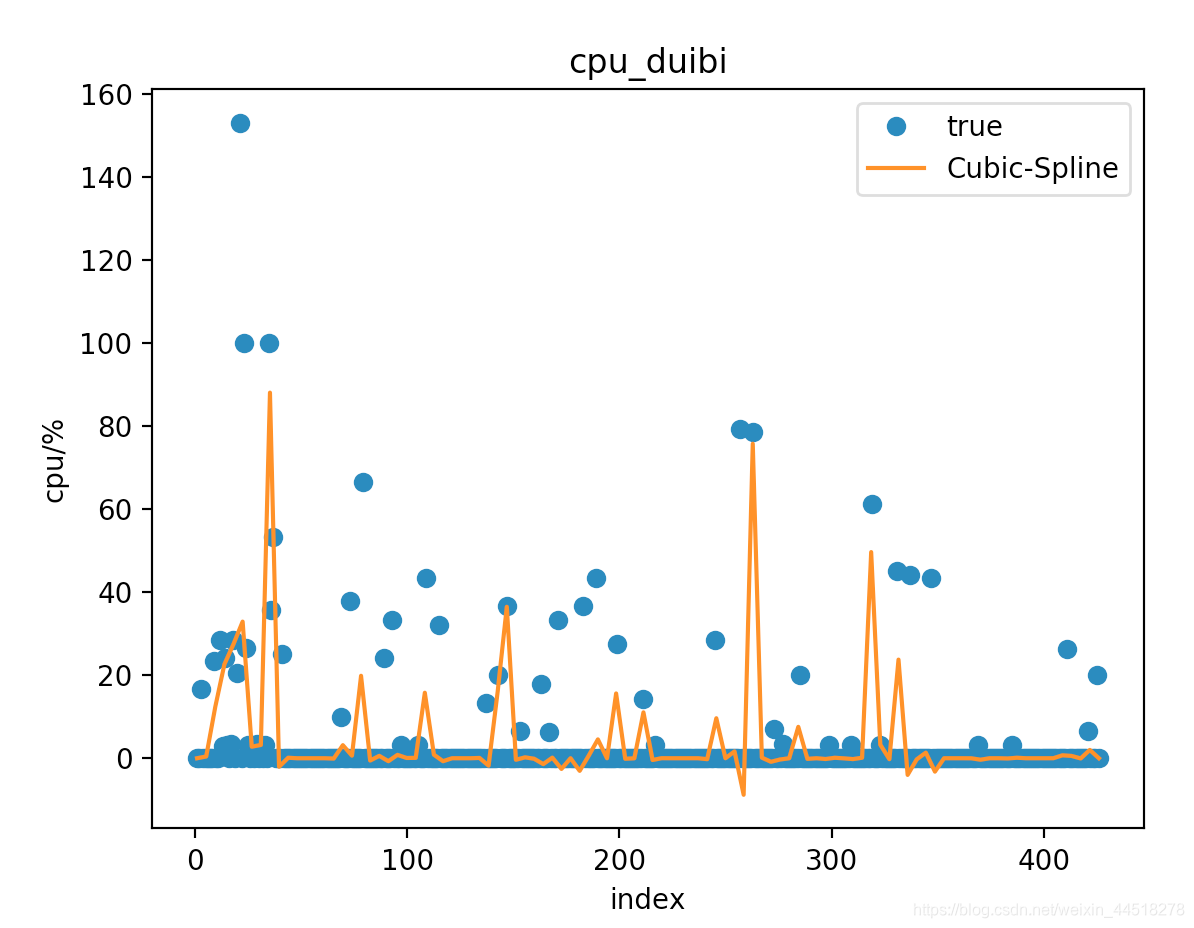
效果图:
 附带代码
附带代码
#!/usr/bin/python3
# -*- coding: utf-8 -*-
"""
@File  : test10-1.py
@Author: Li,hui
@Date  : 2020/7/7 10:44 上午
@Desc  :
"""
import matplotlib.pyplot as plt
from scipy import interpolate
import numpy as np

import matplotlib.font_manager as mpt


def test1(package):
    """读取txt文件"""
    # X, Y = [], []
    with open("20200702170145_智能小程序--动态使用1.top", "r") as f:
        data = f.readlines()
        # print(type(data))
        # print(data)
        # print(data[2])
        # result = []
        # result.append(list(map(str, data.split(","))))
        # print(result)
        n = 0
        for line in data:
            line = line.strip("\n")
            # 28158 12 256M 193M S  100  13.5
            # 28207 20 101M  91M S  0.0   5.3
            # 28104 20 147M 127M S  0.0   7.7
            if package in line and ":swan0" not in line and ":remote" not in line:
                # print(line)
                n = n + 1
                list1 = list(line.split())
    #             X.append(n)
    #             Y.append(list1[5])

                print("%s %s" % (n, list1[5]))
    # plt.plot(X, Y)
    # plt.show()


def test2():
    """"""
    # zhfont = mpt.FontProperties(fname='/usr/share/fonts/custom/msyh.ttf')  # 显示中文字体
    # 导入数据
    # 导入数据
    file = 'test.txt'
    a = np.loadtxt(file)
    # 数组切片
    x = a[:, 0]  # 取第一列数据
    y = a[:, 1]  # 取第二列数据
    # 进行样条插值
    tck = interpolate.splrep(x, y)
    xx = np.linspace(min(x), max(x), 100)
    yy = interpolate.splev(xx, tck, der=0)
    print(xx)
    # 画图
    plt.plot(x, y, 'o', xx, yy)
    plt.legend(['true', 'Cubic-Spline'])
    # plt.xlabel('距离(cm)', fontproperties=zhfont)  # 注意后面的字体属性
    plt.xlabel('index')
    plt.ylabel('cpu/%')
    # plt.title('管线仪实测剖面图', fontproperties=zhfont)
    plt.title('cpu_duibi')
    # 保存图片
    plt.savefig('out.jpg')
    plt.show()


if __name__ == '__main__':
    # test1("aiapps")
    test2()
    # str1 = "28207 20 101M  91M S  0.0   5.3 com.baidu.iov.aiapps:remote"
    # list1 = list(str1.split())
    # print(list1[5])
描述场景:上文中介绍了如何获取性能数据,获取后如何对数据分析呢,思路利用python对文件进行处理,形成图形。
待完成:显示多条性能数值


 被折叠的 条评论
为什么被折叠?
被折叠的 条评论
为什么被折叠?
 到【灌水乐园】发言


