


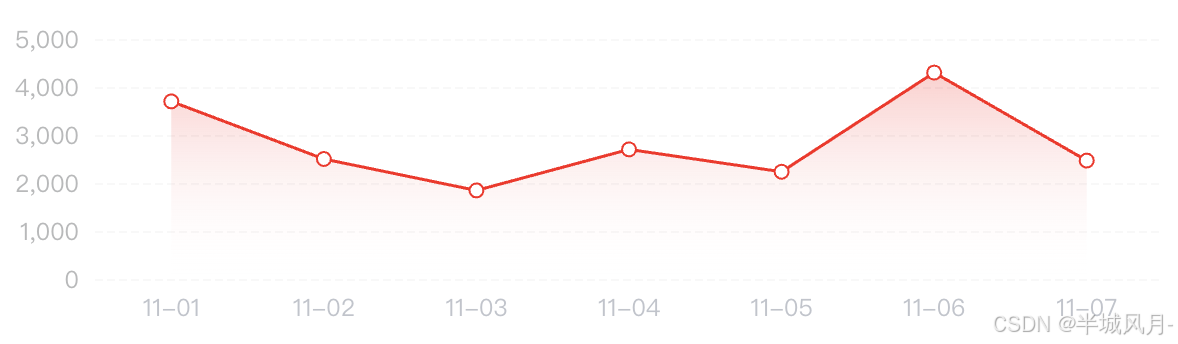
1、效果图
2、代码部分
var myChart4 = this.$echarts.init(document.getElementById('test-Chart'));
let option = {
  tooltip: {
    trigger: 'axis'
  },
  grid: {
    bottom: '20px',
    right: '0px',
    left: '45px',
    top: '5px'
  },
  xAxis: {
    type: 'category',
    data: ["11-01", "11-02", "11-03", "11-04", "11-05", "11-06", "11-07",],
    axisLabel: {
      interval: 0,
      color: '#C0C4CC',
    },
    axisLine: {
      show: false
    },
    axisTick: {
      show: false
    }
  },
  yAxis: {
    type: 'value',
    axisLabel: {
      color: '#B8B9BA',
    },
    axisLine: {
      show: false
    },
    splitLine: {
      show: true,
      lineStyle: {
        color: '#E8E8E8',
        opacity: '0.3',
        type: 'dashed',
        width: 1,
      }
    },
    axisTick: {
      show: false
    }
  },
  series: [
    {
      data: [3700,2500,1845,2700,2234,4300,2467],
      color: "#FF1818",
      type: 'line',
      symbol: 'circle',
      smooth: false,//是否平滑
      showAllSymbol: true,
      symbolSize: 7,//不需要点就设置0
      lineStyle: {
        width: 1.5,
        type: 'solid',
        color: "#FF1818"
      },
      emphasis:{
        lineStyle: {
          width: 1.5,
        },
      },
      itemStyle: {
        borderColor: '#FF1818',
        color: '#FFFFFF'
      },
      areaStyle: {
        normal: {
          color: new this.$echarts.graphic.LinearGradient(0, 0, 0, 1, [{
            offset: 0,
            color: 'rgba(255, 35, 35, 0.34)'
          }, {
            offset: 1,
            color: 'rgba(255,255,255, 0)'
          }]),
        },
      },
    },
  ]
};
myChart4.setOption(option);
setTimeout(function () {
  window.addEventListener("resize",()=>{
    myChart4.resize()
  })
}, 200)
3、去掉 hover 折线变粗方法
问题:鼠标悬停在折线图上,折线变粗。
解决方法:设置emphasis.lineStyle和折线图本身lineStyle相同即可
lineStyle: {
  width: 1.5,
  type: 'solid',
  color: "#FF1818"
},
emphasis:{
  lineStyle: {
    width: 1.5,
  },
},


 6627
6627

 被折叠的 条评论
为什么被折叠?
被折叠的 条评论
为什么被折叠?
 到【灌水乐园】发言


