


-
地图数据
https://datav.aliyun.com/portal/school/atlas/area_selector
不会下载的同学用这个吧「chinaMap.js」https://www.aliyundrive.com/s/qsD9qm8sJsG
点击链接保存,或者复制本段内容,打开「阿里云盘」APP ,无需下载极速在线查看,视频原画倍速播放。
这个是全国和省份具体的数据. 使用的时候只要注册地图的时候采用省份数据就可以了 https://note.youdao.com/s/SOTIz65r -
echarts社区
https://www.makeapie.cn/echarts
https://www.isqqw.com/#/homepage
http://www.ppchart.com/#/
<template>
<el-card style="height: 100%">
<div ref="myChart" id="chart">
</div>
</el-card>
</template>
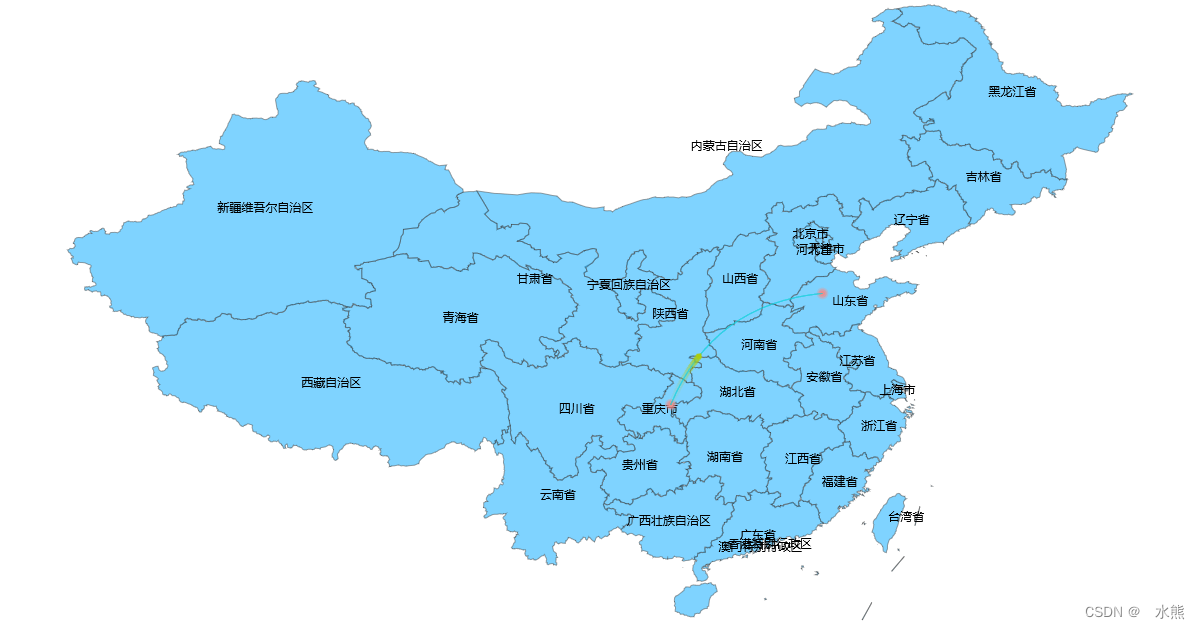
<!--飞线地图-->
<script>
import echarts from 'echarts';
// 中国地图数据
import {chinaData} from "@/assets/js/chinaMap";
export default {
name: "CenterMap",
data() {
return {
flyLineList: [],
pointList: [],
myChart: null,
}
},
mounted() {
this.myChart = echarts.init(this.$refs.myChart);
// 注册中国地图
echarts.registerMap("chinaMap", chinaData);
this.init();
},
methods: {
// 获取飞线数据
async search() {
return await this.$http({
url: "/mas/home/centerMap",
method: "get",
});
},
init() {
this.myChart.showLoading();
this.search().then(({data}) => {
if (data && data.success) {
this.myChart.setOption({
geo: {
type: "map",
// 使用mount注册的地图数据
map: "chinaMap",
// 地图平移效果
roam: true,
// 初始化地图比例
zoom: 1.5,
aspectScale: 1, //长宽比
// 缩放比例
scaleLimit: {
min: 1,
max: 5,
},
// 中心坐标
center: [108.948024,
34.263161],
// 显示城市名称
label: {
show: true,
},
// 区域颜色
itemStyle: {
areaColor: "rgba(0, 168, 255,0.5)",
// 地图层次感
/* normal: {
shadowOffsetX: 2,
shadowOffsetY: 2,
},*/
}
},
series: [
// 点
{
// 采用涟漪点
type: "effectScatter",
// 坐标采用经纬度
coordinateSystem: "geo",
// 涟漪点大小
symbolSize: 5,
// 涟漪效果
rippleEffect: {
number: 2,
scale: 3
},
// 涟漪点颜色
itemStyle: {
color:"#ea9090"
},
// 在哪里绘制涟漪点
data: [
{name:"重庆",value: [108.384366, 30.439702]},
{name:"山东",value: [117.1582, 36.8701]},
]
},
// 连接点的线
{
name: '线路',
type: 'lines',
// 坐标采用经纬度
coordinateSystem: 'geo',
large: true,
zlevel: 10,
effect: {
show: true,
color:"#abcd11",
period: 10, //箭头指向速度,值越小速度越快
trailLength: 0.1, //特效尾迹长度[0,1]值越大,尾迹越长重
symbol: 'diamond', //箭头图标
symbolSize: 7, //图标大小
},
lineStyle: {
normal: {
color: "#0FD1D9",
// 线条宽度
width: 0.2,
opacity: 1,
curveness: 0.3,
}
},
label: {
normal: {
show: false,
position: 'middle',
formatter: '{b}'
}
},
data: [
{
fromName: "重庆",
toName:"山东",
coords:[
[108.384366, 30.439702],
[117.1582, 36.8701]
]
},
],
},
]
})
// 自适应
this.$nextTick(() => {
this.$emit("add", this.myChart);
})
}
}).finally(() => {
this.myChart.hideLoading();
})
}
}
}
</script>


 777
777

 被折叠的 条评论
为什么被折叠?
被折叠的 条评论
为什么被折叠?
 到【灌水乐园】发言


