v-chart 地图

在这里插入图片描述

template

<template>
  <div class="ring_box">
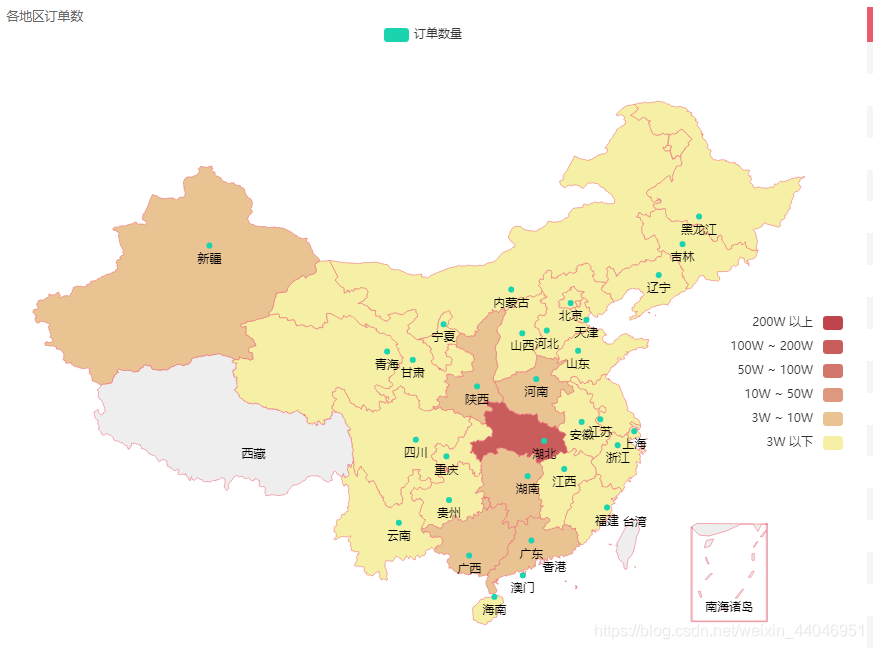
    <div class="title_chart">各地区订单数</div>
    <ve-map 
      :data="chartData" 
      :settings="chartSettings"  
      :visual-map="visualMap"
      height='45rem' 
    ></ve-map>
  </div>
</template>

script

export default {
    props:['AreaData'],
    data () {
      this.chartSettings = {
        metrics: ['订单数量'],
        roam:true,
        itemStyle: {
          normal: {
            borderColor: '#eb5a6d',
          }
        },
      }
      this.visualMap = [
        {
          type: 'piecewise',
          pieces: [
            {min: 2000000,label: '200W 以上'},
            {min: 1000000, max: 2000000,label: '100W ~ 200W'},
            {min: 500000, max: 1000000,label: '50W ~ 100W'},
            {min: 100000, max: 500000,label: '10W ~ 50W'},
            {min: 30000, max: 100000,label: '3W ~ 10W'},
            {max: 30000,label: '3W 以下'}    
          ],
          right: 0,
          top: '40%'
        }
      ]
      return {
        chartData: {
          columns: ['地区', '订单数量'],
          rows: []
        },
      }
    },
    methods:{
      
    },
    watch:{
      AreaData(val){
        let arr = []
        let numArr =[]
        if(val.length > 0){
          for(let i in val){
            numArr.push(val[i].num)
            let obj ={}
            obj['地区'] = val[i].name 
            obj['订单数量'] = val[i].num
            obj['地区'] = obj['地区'] == '四川省'? '四川':obj['地区']   //后台返回的四川省,改成四川。
            arr.push(obj)
          }
        }
        let maxNum = Math.max(...numArr)
        console.log(numArr,'0000')
        console.log(maxNum,'0000')
        // this.visualMap[0].max = maxNum
        this.chartData.rows=arr
      }
    }
  }
如果你使用的是基于 Vue.js 的 v-chart 组件,可以通过配置 tooltip 的 formatter 函数来指定显示地图中某个区域的 tooltip。具体操作步骤如下: 1. 首先需要获取到当前鼠标所在区域的数据,可以通过监听 v-chart 的 mousemove 事件,并通过参数获取到当前鼠标所在的坐标和数据信息。 2. 在 tooltip 的 formatter 函数中,根据当前鼠标所在的数据信息,动态生成需要显示的 tooltip 内容。 3. 最后在 v-chart 的 options 中配置 tooltip 的 formatter 函数即可。 以下是示例代码: ```vue <template> <v-chart :options="chartOptions" @mousemove="handleMouseMove"></v-chart> </template> <script> export default { data() { return { chartOptions: { tooltip: { formatter: this.tooltipFormatter }, // 其他图表配置项 }, currentData: null } }, methods: { handleMouseMove(params) { const { componentType, seriesType, dataIndex } = params; if (componentType === 'series' && seriesType === 'map') { // 获取当前区域的数据信息 this.currentData = this.chartOptions.series[0].data[dataIndex]; } else { this.currentData = null; } }, tooltipFormatter(params) { if (this.currentData) { // 根据当前数据信息生成 tooltip 内容 return `${this.currentData.name}: ${this.currentData.value}`; } return ''; } } } </script> ``` 在上面的示例代码中,我们监听了 v-chart 的 mousemove 事件,并通过参数获取到当前鼠标所在的区域数据信息。然后在 tooltip 的 formatter 函数中,根据当前数据信息动态生成 tooltip 内容。最后在 v-chart 的 options 中配置 tooltip 的 formatter 函数即可。
评论
添加红包

请填写红包祝福语或标题

红包个数最小为10个

红包金额最低5元

当前余额3.43前往充值 >
需支付:10.00
成就一亿技术人!
领取后你会自动成为博主和红包主的粉丝 规则
hope_wisdom
发出的红包
实付
使用余额支付
点击重新获取
扫码支付
钱包余额 0

抵扣说明:

1.余额是钱包充值的虚拟货币,按照1:1的比例进行支付金额的抵扣。
2.余额无法直接购买下载,可以购买VIP、付费专栏及课程。

余额充值