


 本文介绍了如何使用 seaborn 的 jointplot 函数创建联合分布图,并详细展示了如何通过添加 ax.fig.add_axes 方法来定制颜色条,从而增强图形的可读性和专业性。通过对修改前后的代码对比,阐述了在 matplotlib 中调整颜色条位置和控制其显示方式的关键步骤。
前后结果对比
| 修改前 | 修改后 |
|---|---|
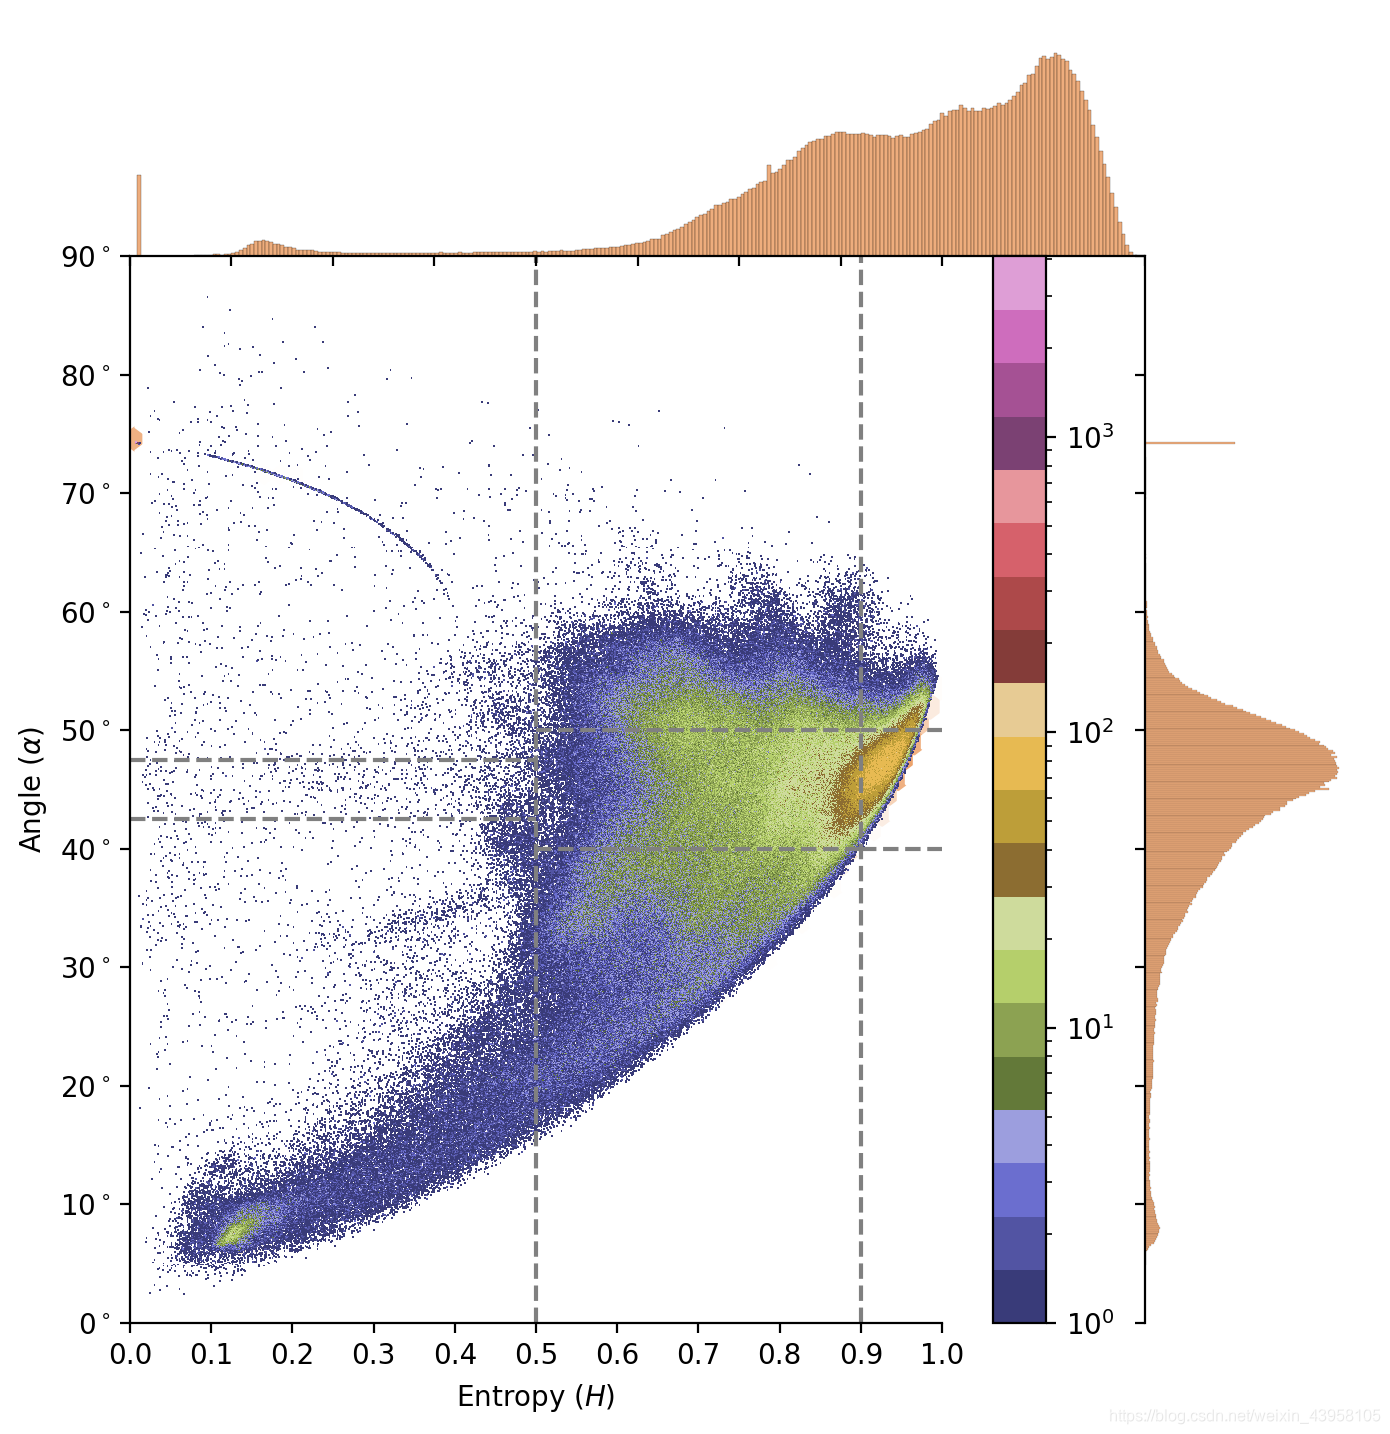 | 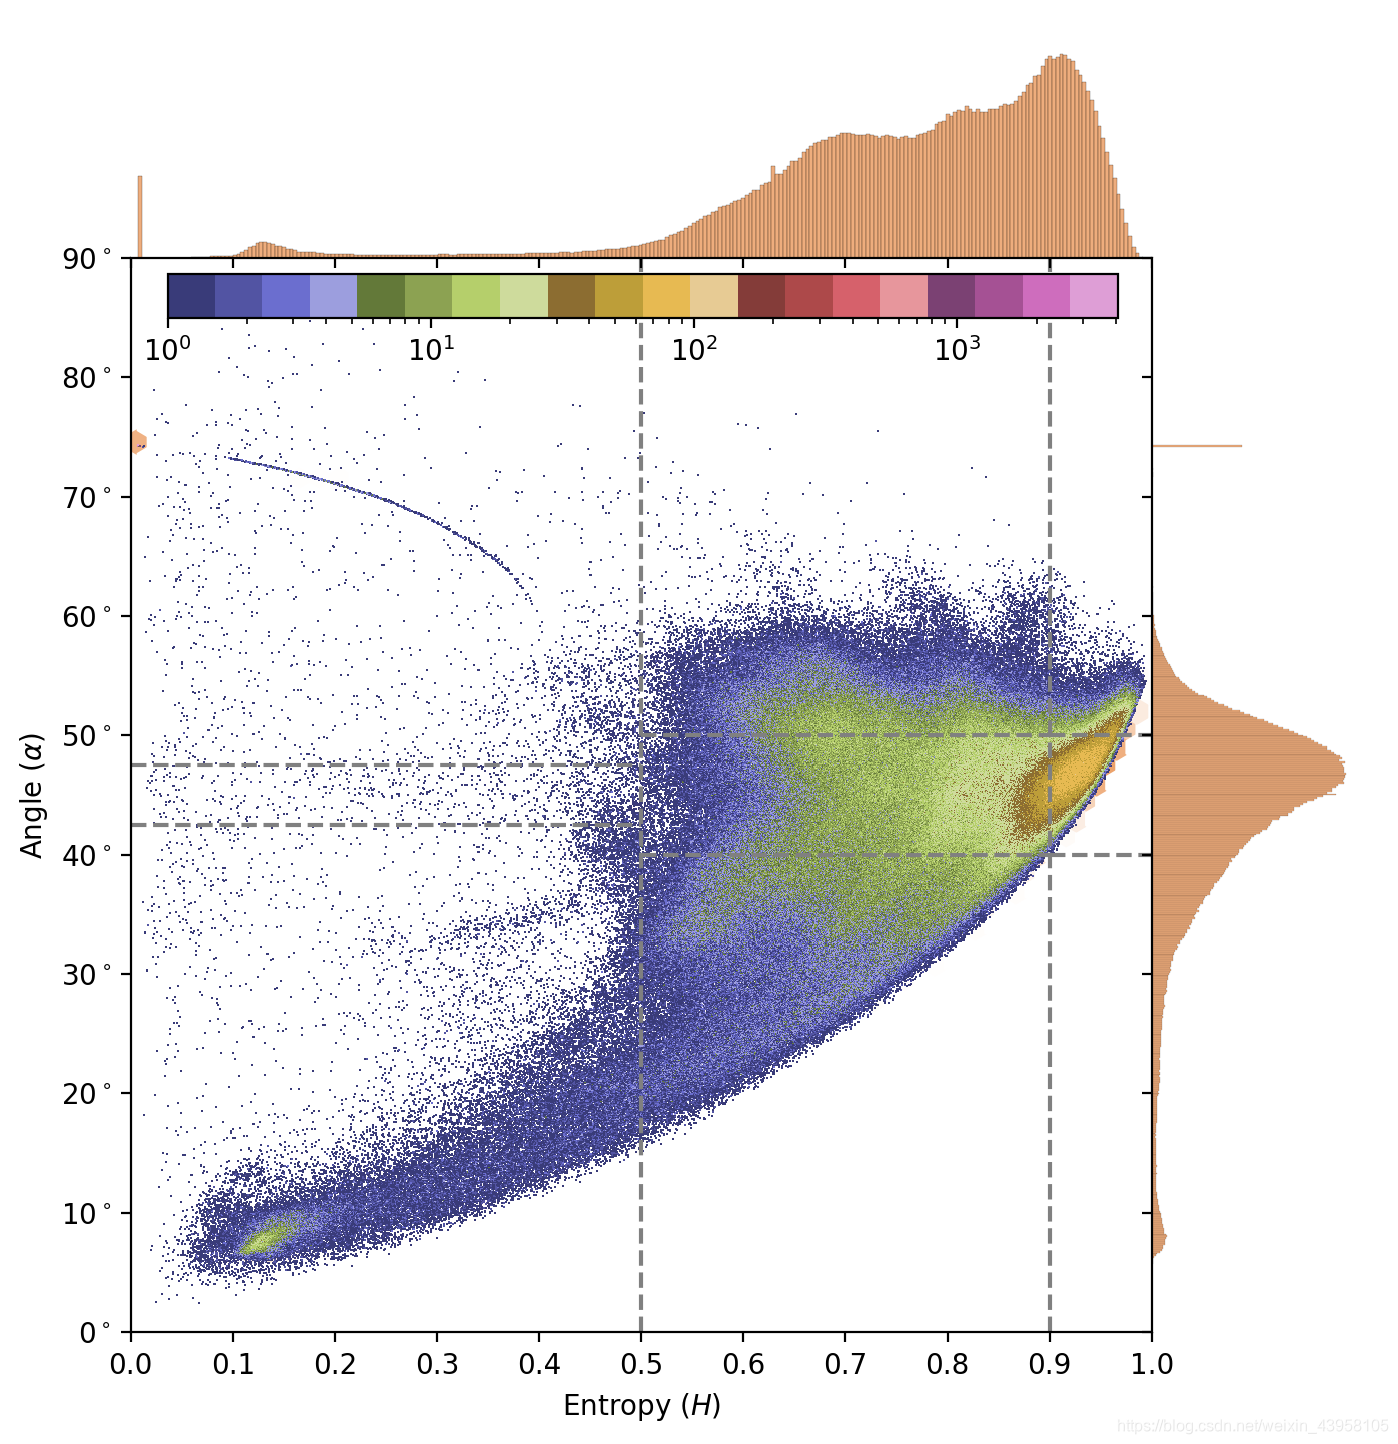 |
前后代码示例
修改前
ax = sns.jointplot(...)
plt.sca(ax.ax_joint)
plt.hist2d(...)
plt.colorbar(...)
修改后
ax = sns.jointplot(...)
plt.sca(ax.ax_joint)
plt.hist2d(...)
cbar_ax = ax.fig.add_axes(...)
plt.colorbar(cax=cbar_ax, ...)
关于 ax.fig.add_axes 的用法:Joint and marginal histograms


 1395
1395

 被折叠的 条评论
为什么被折叠?
被折叠的 条评论
为什么被折叠?
 到【灌水乐园】发言


