思路
- 五个tab公用一个柱状图组件
- 切换tab以及切换时间改变数据,传入子组件,子组件监听数据重新更新
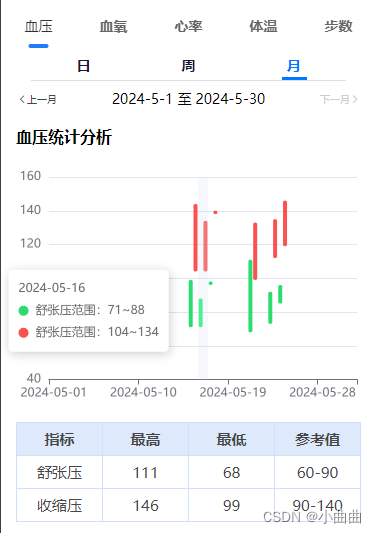
- 点击柱状图显示具体数值
- 每个时间点有两个柱子(高压和低压),柱状图显示高压的最大值到最小值的范围
- 除了血压其余只有一条柱子
- 步数比较特殊,不是范围,而是一个具体的步数数值
- 根据tab设置不同的最小值
- 假如最大值==最小值,显示一个点
- 所有横坐标全部显示,不滚动
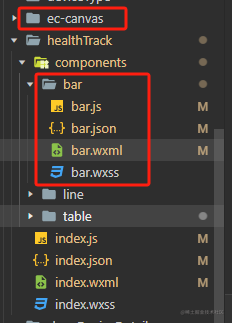
堆叠柱状图子组件
{
"component": true,
"usingComponents": {
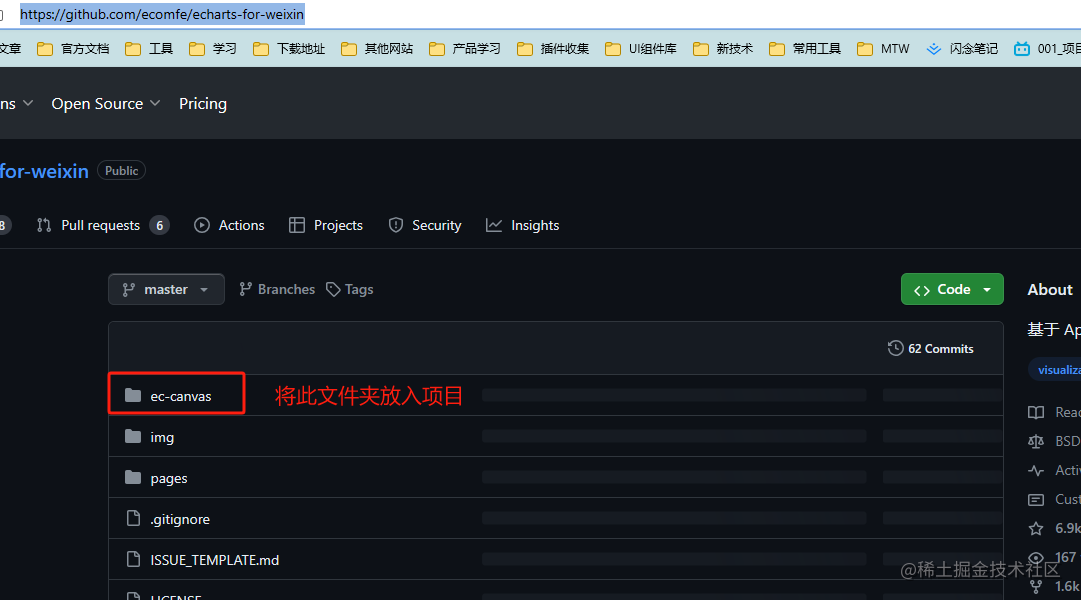
"ec-canvas": "../../../ec-canvas/ec-canvas"
}
}
<view class="w100 h100">
  <ec-canvas id="mychart-bar" canvas-id="mychart-bar" ec="{
   { ec }}"></ec-canvas>
</view>
import * as echarts from '../../../ec-canvas/echarts';
Component({
options: {
addGlobalClass: true,
},
data: {
ec: {
lazyLoad: true
},
time: [],
low1: [],
high1: [],
low2: [],
high2: [],
step: []
},
properties: {
list: {
type: Array,
observer: function (newVal, oldVal) {
if (newVal.length || oldVal.length) {
console.log(newVal, oldVal, 88)
let time = newVal.map(item => item.date)
let low1 = newVal.map(item => item.firstLowIndicators * 1)
let high1 = newVal.map(item => item.firstHighIndicators && item.firstHighIndicators == item.firstLowIndicators ? 'solo' : item.firstHighIndicators * 1 - item.firstLowIndicators * 1)
let low2 = newVal.map(item => item.secondLowIndicators * 1)
let high2 = newVal.map(item => item.secondHighIndicators && item.secondHighIndicators == item.secondLowIndicators ? 'solo' : item.secondHighIndicators * 1 - item.secondLowIndicators * 1)
let step = newVal.map(item => item.firstHighIndicators)
this.setData({
time,
low1,
high1,
low2,
high2,
step
})
this.initChart();
}
}
},
tab: {
type: Number,
value: 1
}
},
methods: {
initChart() {
this.barComponent = this.selectComponent("#mychart-bar");
this.barComponent.init((canvas, width, height, dpr) => {
const chart = echarts.init(canvas, null, {
width: width,
height: height,
devicePixelRatio: dpr
})
chart.setOption(this.getOption())
return chart
})
},
getOption() {
var option = {
tooltip: {
trigger: "axis",
axisPointer: {
type: "shadow",
},
formatter: (params) => {
if (this.data.tab == 5) {
return (
params[0].axisValue +
"\n" +
params[0].marker +
params[1].seriesName +
":" +
(params[0].value || 0)
)
} else if (this.data.tab == 1) {
return (
params[0].axisValue +
"\n" +
params[1].marker +
params[0].seriesName +
":" +
params[0].value +
"~" +
(params[0].value + ((params[1].value + '').slice(-6) == '521125' ? 0 : params[1].value)) +
"\n" +
params


 最低0.47元/天 解锁文章


 708
708

 被折叠的 条评论
为什么被折叠?
被折叠的 条评论
为什么被折叠?
 到【灌水乐园】发言


