


 该博客是Python学习笔记,主要对比Matplotlib中subplot和subplots画子图的功能。两者都能实现画子图,subplots会规划好画板并返回坐标数组对象,可直接指定画板大小;subplot每次仅返回一个坐标对象。
Python学习笔记之Matplotlib画子图——subplot和subplots简单对比
subplot和subplots区别
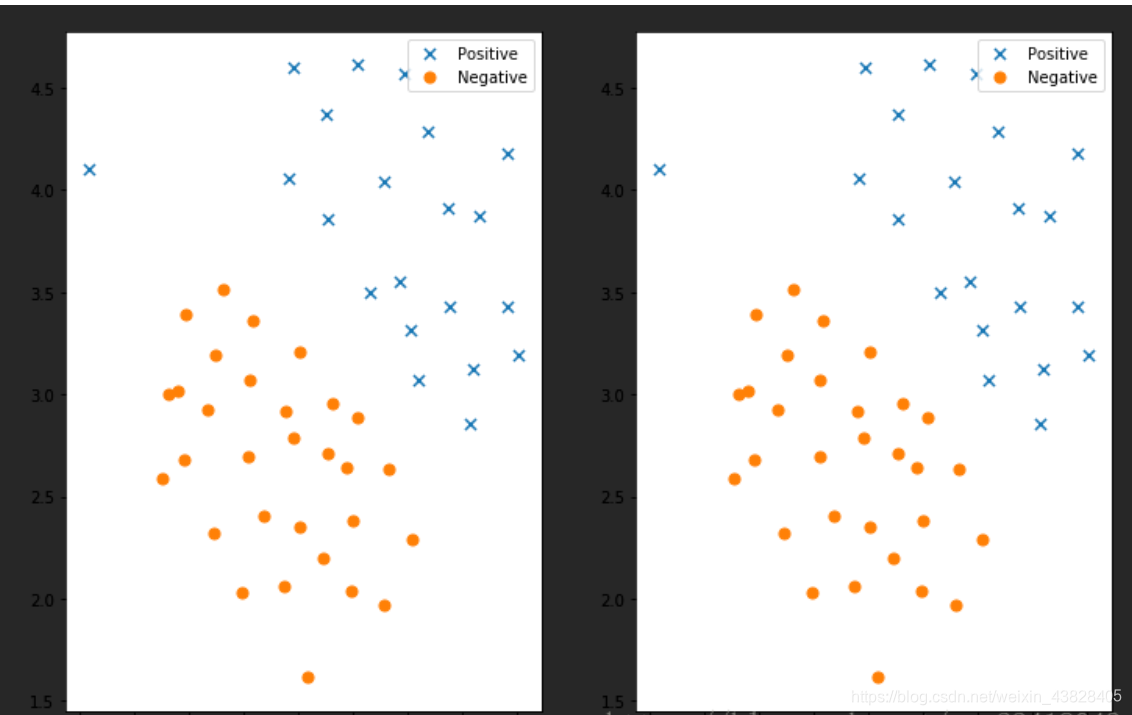
subplot代码:
ax1 = plt.subplot(1,2,1)
ax1.scatter(positive['X1'],positive['X2'],s = 50,marker = 'x', label  = 'positive')
ax1.scatter(negative['X1'], negative['X2'], s=50, marker='o', label='Negative')
ax1.legend()#添加图列(就是右上角的说明)
ax2 = plt.subpolt(1,2,2)
ax2.scatter(positive['X1'], positive['X2'], s=50, marker='x', label='Positive')
ax2.scatter(negative['X1'], negative['X2'], s=50, marker='o', label='Negative')
ax2.legend()#添加图列就是右上角的点说明
subplots代码:
fig,ax = plt.subplots(figsize = (12,8),ncols = 2,nrows = 1) #该方法会返回画图对象和坐标对象ax,figsize是设置子图长宽(1200,800)
ax[0].scatter(positive["X1"],positive["X2"],s = 50, marker = 'x', label = 'positive')
ax[0].scatter(negative['X1'], negative['X2'], s=50, marker='o', label='Negative')
ax[0].legend()#添加图列就是右上角的点说明
ax[1].scatter(positive['X1'], positive['X2'], s=50, marker='x', label='Positive')
ax[1].scatter(negative['X1'], negative['X2'], s=50, marker='o', label='Negative')
ax[1].legend()#添加图列就是右上角的点说明
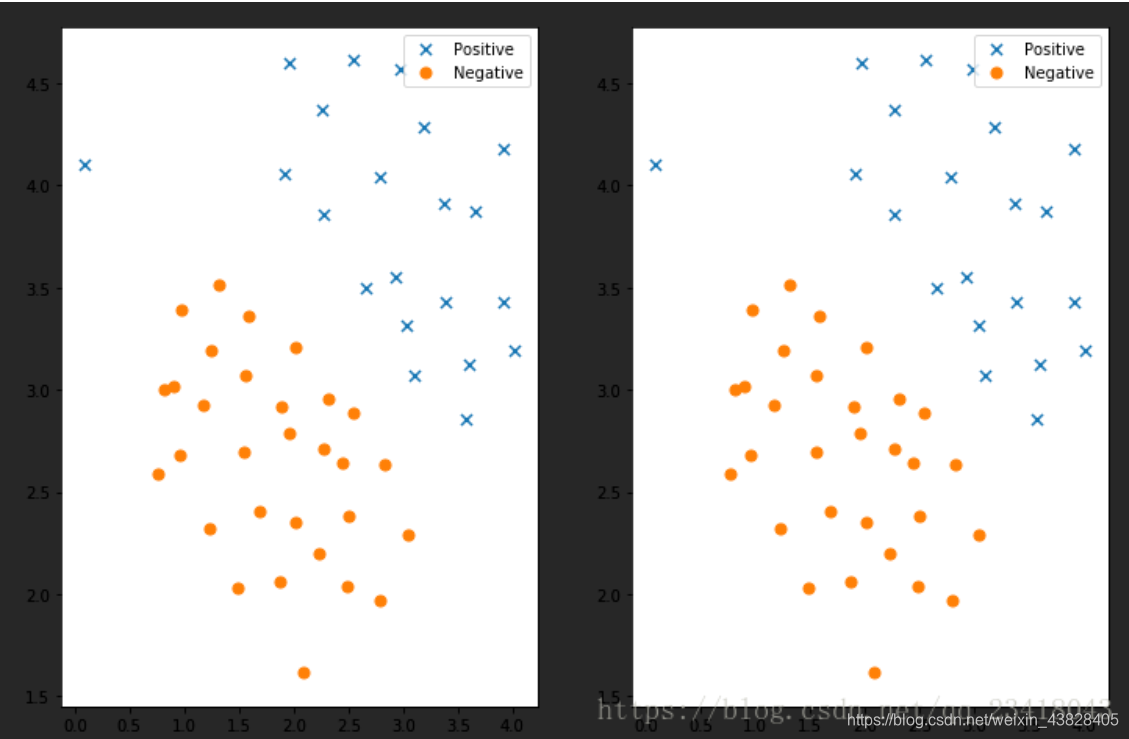
可以看出来两者都可以实现画子图功能,只不过subplots帮我们把画板规划好了,返回一个坐标数组对象,而subplot每次只能返回一个坐标对象,subplots可以直接指定画板的大小。


 2575
2575

 被折叠的 条评论
为什么被折叠?
被折叠的 条评论
为什么被折叠?
 到【灌水乐园】发言


