


 本文介绍了使用Python的Matplotlib库创建条形图和散点图的方法。通过示例展示了如何绘制条形图,包括设置x轴和y轴标签,以及如何创建水平条形图。同时,也展示了如何利用Matplotlib创建散点图,并且在一个图表中展示两个散点图对比。
Matplotlib–数据可视化库–条形图与散点图
-
对fandango_scores.csv文件,将’FILM’,‘RT_user_norm’, ‘Metacritic_user_nom’, ‘IMDB_norm’, ‘Fandango_Ratingvalue’, 'Fandango_Stars’这6列的前1行的数据提取出来
import pandas as pd
reviews = pd.read_csv(‘fandango_scores.csv’)
cols = [‘FILM’, ‘RT_user_norm’, ‘Metacritic_user_nom’, ‘IMDB_norm’, ‘Fandango_Ratingvalue’, ‘Fandango_Stars’]
norm_reviews = reviews[cols]
print(norm_reviews[:1]) -
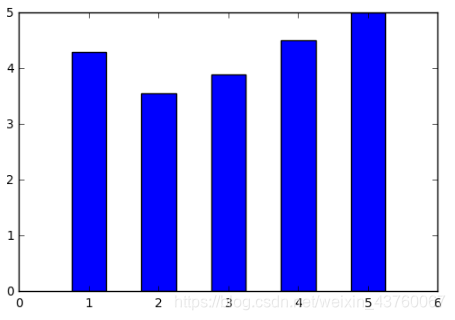
条形图.bar()方法有两个必需的参数,左和高。使用左参数来指定bar左侧的x坐标。使用height参数来指定每个bar的高度
import matplotlib.pyplot as plt
from numpy import arange
num_cols = [‘RT_user_norm’, ‘Metacritic_user_nom’, ‘IMDB_norm’, ‘Fandango_Ratingvalue’, ‘Fandango_Stars’]
bar_heights = norm_reviews.ix[0, num_cols].values
#print(bar_heights)
bar_positions = arange(5) + 0.75
#print(bar_positions)
fig, ax = plt.subplots()
ax.bar(bar_positions, bar_heights, 0.5)
plt.show()
-
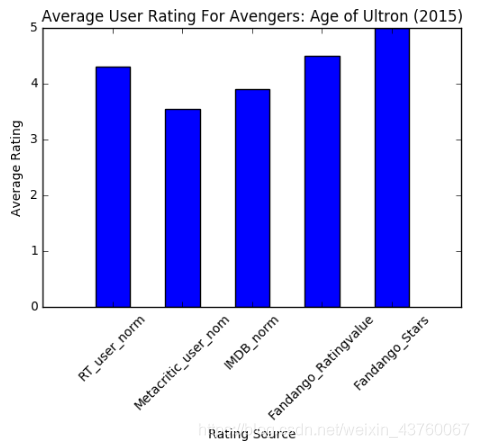
(标题,x轴,y轴)默认情况下,matplotlib将x轴标记标签设置为条形图中的整数值
num_cols = [‘RT_user_norm’, ‘Metacritic_user_nom’, ‘IMDB_norm’, ‘Fandango_Ratingvalue’, ‘Fandango_Stars’]
bar_heights = norm_reviews.ix[0, num_cols].values
bar_positions = arange(5) + 0.75
tick_positions = range(1,6)
fig, ax = plt.subplots()
ax.bar(bar_positions, bar_heights, 0.5)
ax.set_xticks(tick_positions)
ax.set_xticklabels(num_cols, rotation=45)
ax.set_xlabel(‘Rating Source’)
ax.set_ylabel(‘Average Rating’)
ax.set_title(‘Average User Rating For Avengers: Age of Ultron (2015)’)
plt.show()
-
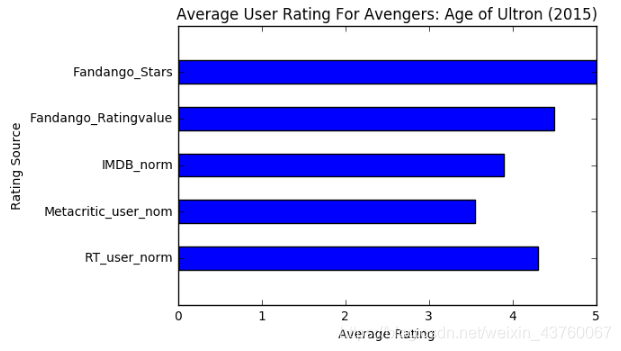
将条形图横过来(.barh方法)
import matplotlib.pyplot as plt
from numpy import arange
num_cols = [‘RT_user_norm’, ‘Metacritic_user_nom’, ‘IMDB_norm’, ‘Fandango_Ratingvalue’, ‘Fandango_Stars’]
bar_widths = norm_reviews.ix[0, num_cols].values
bar_positions = arange(5) + 0.75
tick_positions = range(1,6)
fig, ax = plt.subplots()
ax.barh(bar_positions, bar_widths, 0.5)
ax.set_yticks(tick_positions)
ax.set_yticklabels(num_cols)
ax.set_ylabel(‘Rating Source’)
ax.set_xlabel(‘Average Rating’)
ax.set_title(‘Average User Rating For Avengers: Age of Ultron (2015)’)
plt.show()
-
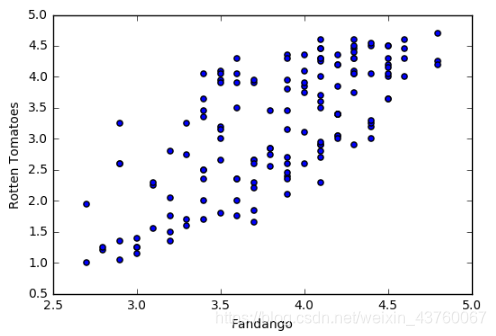
散点图(.ax方法)
fig, ax = plt.subplots()
ax.scatter(norm_reviews[‘Fandango_Ratingvalue’], norm_reviews[‘RT_user_norm’])
ax.set_xlabel(‘Fandango’)
ax.set_ylabel(‘Rotten Tomatoes’)
plt.show()
-
散点图(一个区域两个图)
fig = plt.figure(figsize=(5,10))
ax1 = fig.add_subplot(2,1,1)
ax2 = fig.add_subplot(2,1,2)
ax1.scatter(norm_reviews[‘Fandango_Ratingvalue’], norm_reviews[‘RT_user_norm’])
ax1.set_xlabel(‘Fandango’)
ax1.set_ylabel(‘Rotten Tomatoes’)
ax2.scatter(norm_reviews[‘RT_user_norm’], norm_reviews[‘Fandango_Ratingvalue’])
ax2.set_xlabel(‘Rotten Tomatoes’)
ax2.set_ylabel(‘Fandango’)
plt.show()


 被折叠的 条评论
为什么被折叠?
被折叠的 条评论
为什么被折叠?
 到【灌水乐园】发言


