


接着上个案例https://blog.youkuaiyun.com/weixin_43650973/article/details/107974111
图例组件展现了不同系列的标记大小
legend: {
      itemWidth: 10,
      itemHeight: 10,
  }
修改图例的文字标签
     // 图形的文字标签
        label: {
          fontSize: 10
        },
修改饼形图的大小
 series: [
      {
        // 这个radius可以修改饼形图的大小
        // radius 第一个值是内圆的半径 第二个值是外圆的半径
        radius: ["40%", "60%"]
     }
]
链接文字和图形的线是否显示
  // 链接文字和图形的线是否显示
        labelLine: {
          show: true
        },
链接图形和文字的线条
      labelLine: {
          // length 链接图形的线条
          length: 6,
          // length2 链接文字的线条
          length2: 8
        },
完整代码
(function() {
var myChart = echarts.init(document.querySelector(".pie2 .chart"));
var option = {
color: [
"#006cff",
"#60cda0",
"#ed8884",
"#ff9f7f",
"#0096ff",
"#9fe6b8",
"#32c5e9",
"#1d9dff"
],
tooltip: {
trigger: "item",
formatter: "{a} <br/>{b} : {c} ({d}%)"
},
legend: {
bottom: "0%",
itemWidth: 10,
itemHeight: 10,
textStyle: {
color: "rgba(255,255,255,.5)",
fontSize: "12"
}
},
series: [
{
name: "地区分布",
type: "pie",
radius: ["10%", "70%"],
center: ["50%", "50%"],
roseType: "radius",
// 图形的文字标签
label: {
fontSize: 10
},
// 链接图形和文字的线条
labelLine: {
// length 链接图形的线条
length: 6,
// length2 链接文字的线条
length2: 8
},
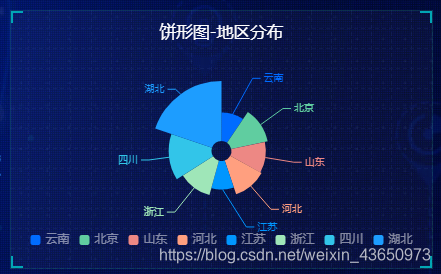
data: [
{ value: 20, name: "云南" },
{ value: 26, name: "北京" },
{ value: 24, name: "山东" },
{ value: 25, name: "河北" },
{ value: 20, name: "江苏" },
{ value: 25, name: "浙江" },
{ value: 30, name: "四川" },
{ value: 42, name: "湖北" }
]
}
]
};
myChart.setOption(option);
})();


 139
139

 被折叠的 条评论
为什么被折叠?
被折叠的 条评论
为什么被折叠?
 到【灌水乐园】发言


