


 文章介绍了科研写作中如何利用Python库scienceplots改进Matlab绘图功能,特别是在数据处理和科研图像绘制上的便利性,尽管中文支持有限,但在英文环境下提供了多种美观的主题选择,如science、ieee等。
前言
科研写作中,黑压压的文字里面如果能有一些优美的图片无疑会给论文增色不少,绘图的工具有很多,常用的有Excel、Python、Matlab等,Matlab在绘图方面相较于Python有一种更加原生的科研风,而且可视化编辑图例、坐标轴标签等方面也比Python更加便捷。但是,随着Python的流行和兴起,在数据处理方面的生态(第三方库)众多,因此,使用Python直接绘制科研图像也成为了很多人的需求,为此, John Garrett在Maplotlib的基础上进行改进,制定了很多适合于科研绘图的主题,编写了一个Python库**scienceplots**, 极大地提高了Python绘制科研图像的便捷性。
需要注意的是:这个库对于中文用户并不是很方便,尝试多次均报错,但是在英文环境下图形还是很漂亮的。
查看可以使用的主题:
import matplotlib.pyplot as plt
import scienceplots
print(plt.style.available)
['Solarize_Light2',
 '_classic_test_patch',
 '_mpl-gallery',
 '_mpl-gallery-nogrid',
 'bmh',
 'bright',
 'cjk-jp-font',
 'cjk-kr-font',
 'cjk-sc-font',
 'cjk-tc-font',
 'classic',
 'dark_background',
 'fast',
 'fivethirtyeight',
 'ggplot',
 'grayscale',
 'grid',
 'high-contrast',
 'high-vis',
 'ieee',
 'latex-sans',
 'light',
 'muted',
 'nature',
 'no-latex',
 'notebook',
 'pgf',
 'retro',
 'russian-font',
 'sans',
 'scatter',
 'science',
 'seaborn-v0_8',
 'seaborn-v0_8-bright',
 'seaborn-v0_8-colorblind',
 'seaborn-v0_8-dark',
 'seaborn-v0_8-dark-palette',
 'seaborn-v0_8-darkgrid',
 'seaborn-v0_8-deep',
 'seaborn-v0_8-muted',
 'seaborn-v0_8-notebook',
 'seaborn-v0_8-paper',
 'seaborn-v0_8-pastel',
 'seaborn-v0_8-poster',
 'seaborn-v0_8-talk',
 'seaborn-v0_8-ticks',
 'seaborn-v0_8-white',
 'seaborn-v0_8-whitegrid',
 'std-colors',
 'tableau-colorblind10',
 'turkish-font',
 'vibrant']
使用方法
下面举例说明scienceplots的使用
import matplotlib.pyplot as plt
import scienceplots
import numpy as np

# choose your theme
theme = 'science'
plt.style.use(theme)
x = np.linspace(0, np.pi, 100)
y1 = np.sin(x)
y2 = np.cos(x)
y3 = np.sin(2*x)
y4 = np.cos(2*x)

ax = plt.subplot(111)
ax.plot(x, y1, label='sinx')
ax.plot(x, y2, label='cosx')
ax.plot(x, y3, label='sin2x')
ax.plot(x, y4, label='cos2x')
ax.set_xlabel('axis x')
ax.set_ylabel('axis y')
ax.set_title('current theme: ' + theme)
plt.legend()
plt.tight_layout()
plt.savefig('test.svg', dpi=200)
plt.show()
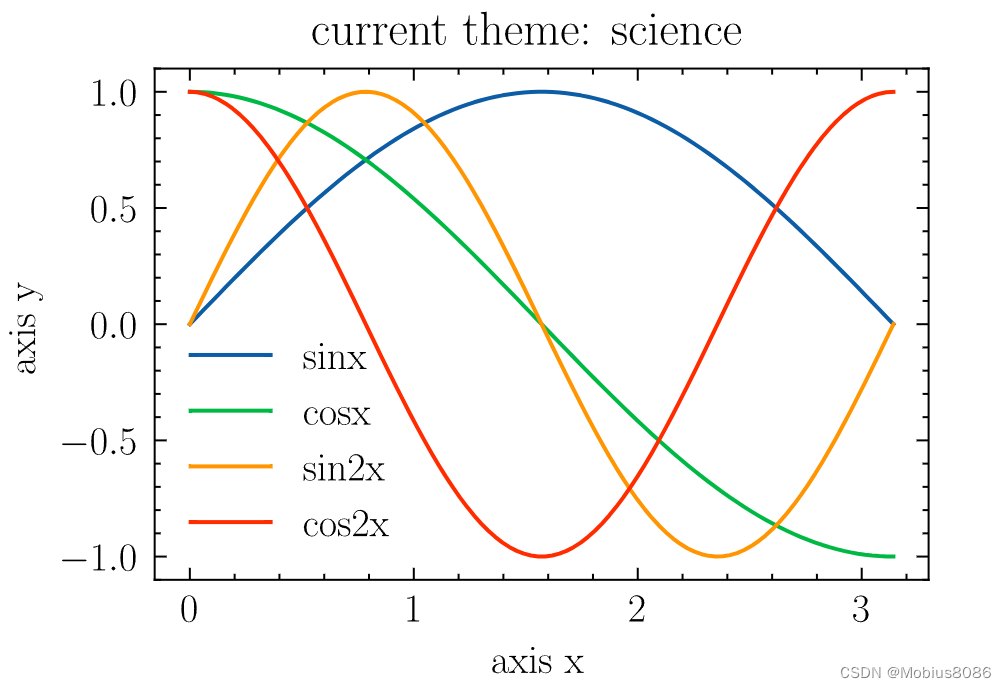
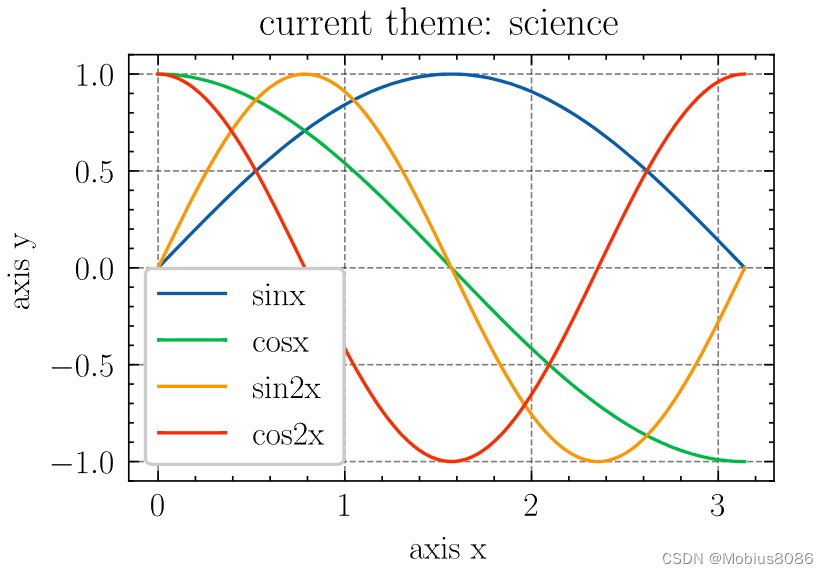
1. science主题
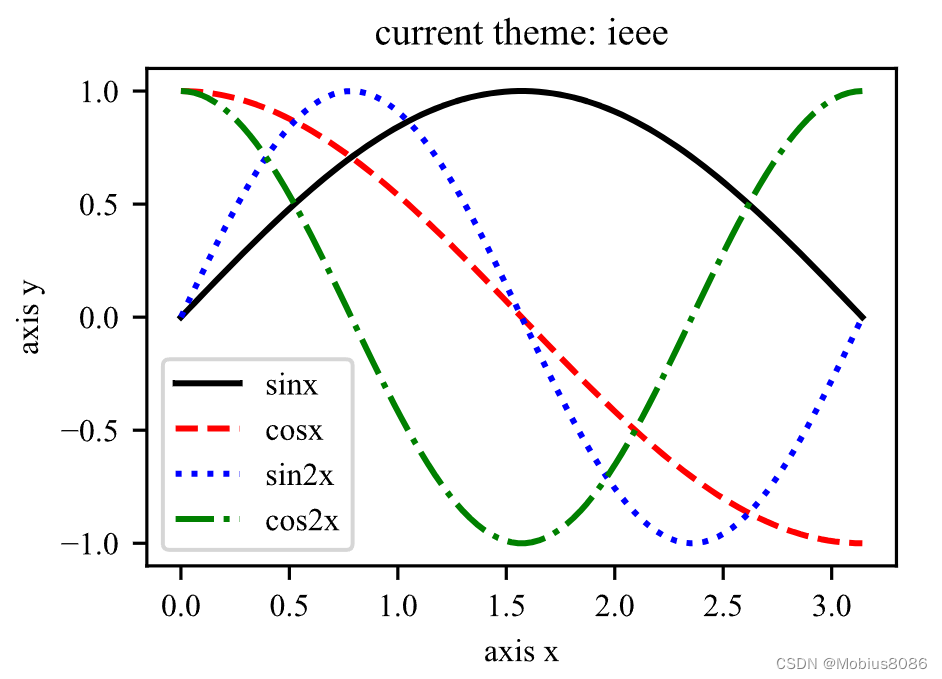
2. ieee主题
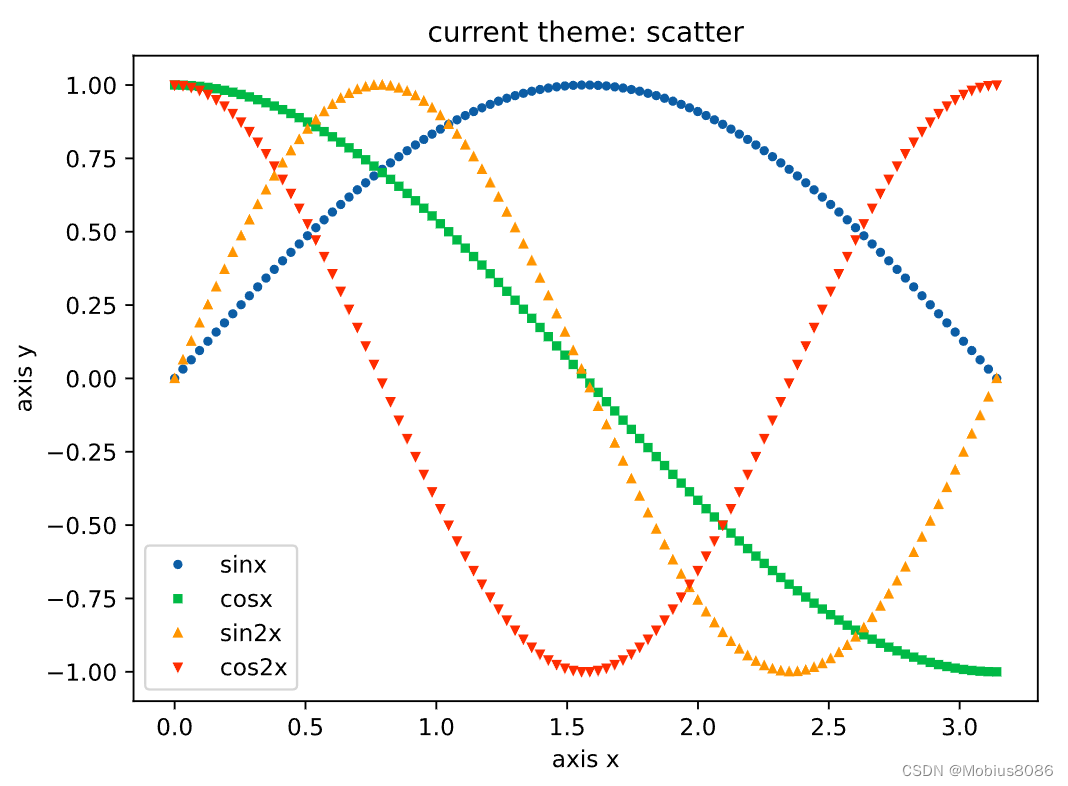
3. scatter主题(绘制散点图)
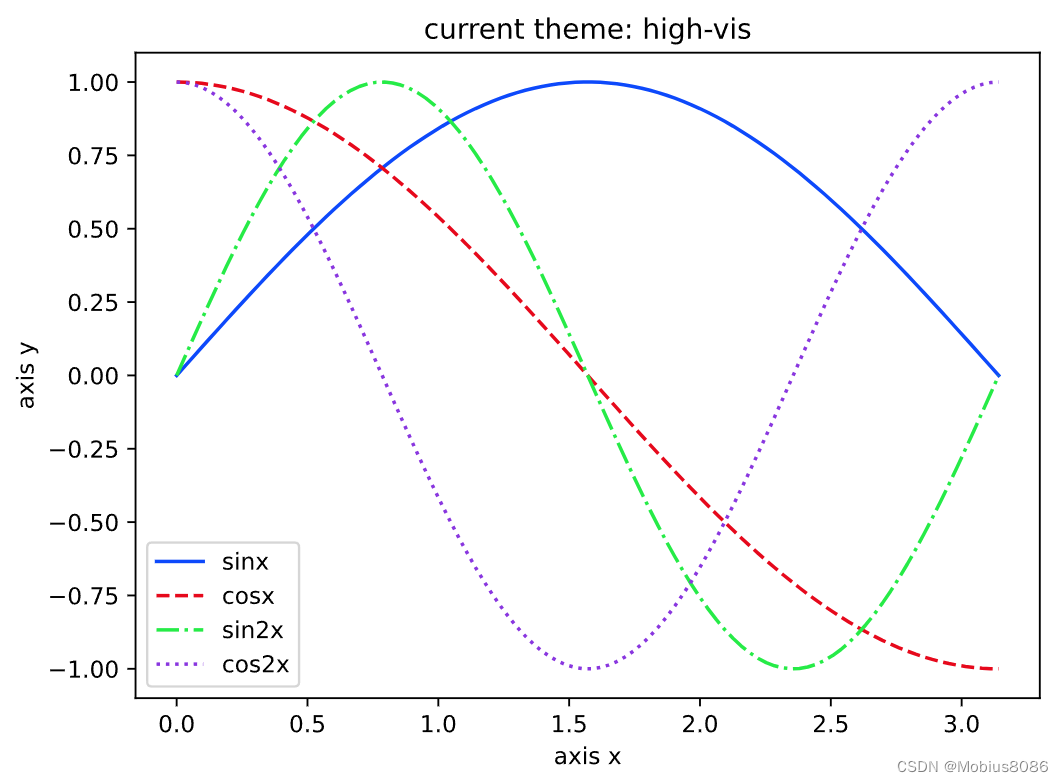
4. high-vis主题
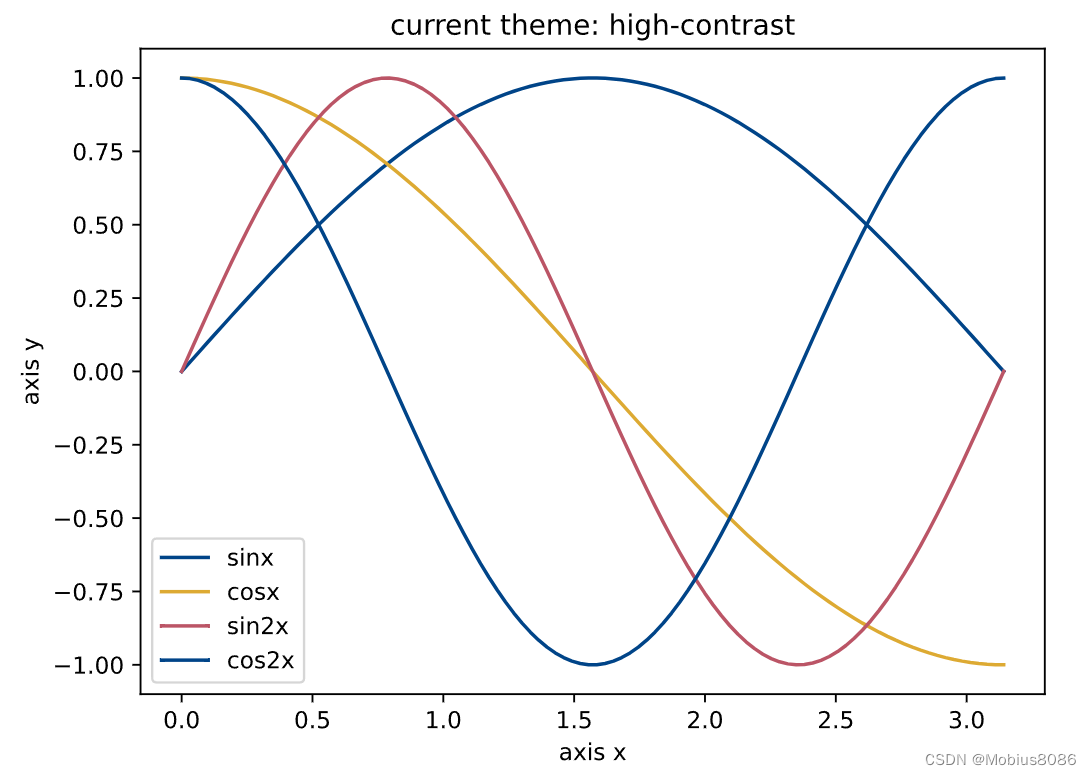
5. high-contrast主题
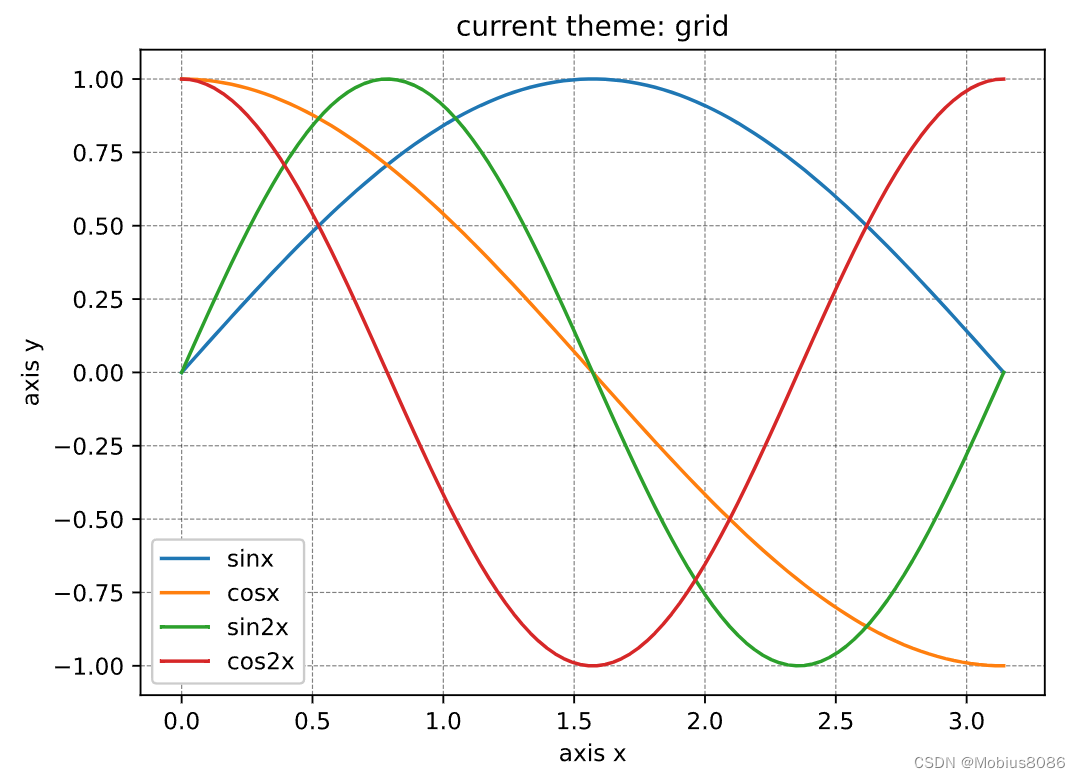
6. grid主题
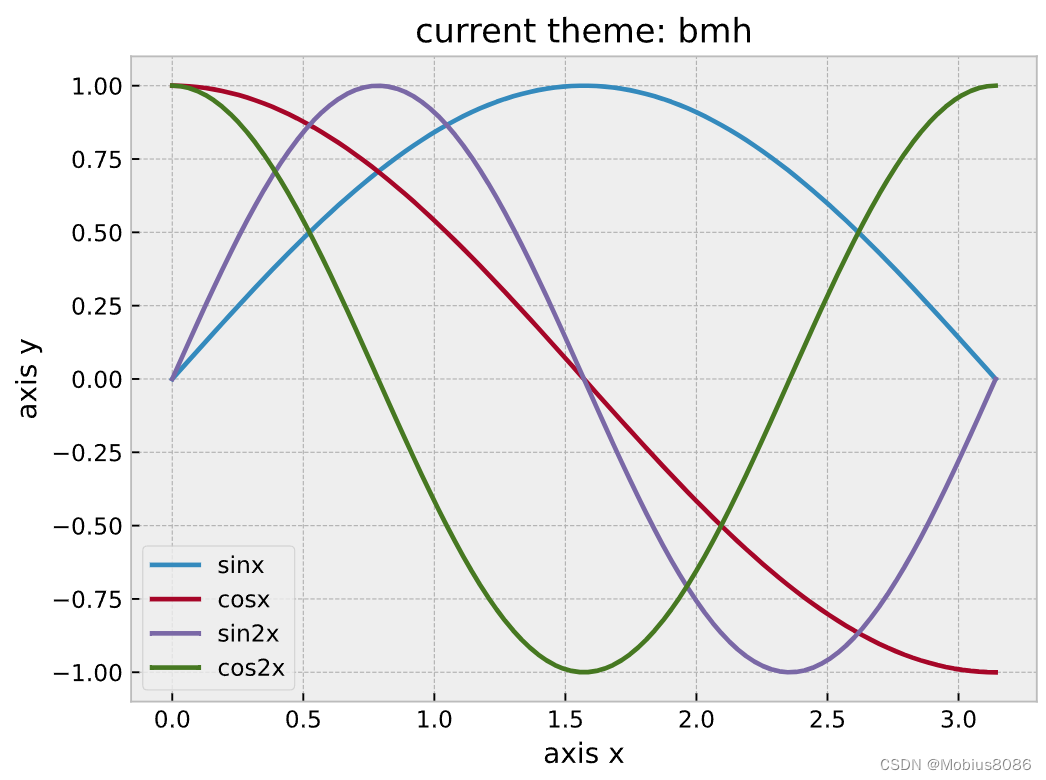
7. bmh主题
8. 主题可以叠加使用
仅需在绘图之前增加如下代码:
plt.style.use(['science', 'grid'])
多个主题通过字符串链表的形式传递进去即可。


 被折叠的 条评论
为什么被折叠?
被折叠的 条评论
为什么被折叠?
 到【灌水乐园】发言


