import cv2

import numpy as np

import matplotlib.pyplot as plt

# 加载图像

img1=cv2.imread('2.jpg',0)

img=cv2.imread('num.jpg',0)


#简单二值化
ret1,th1 = cv2.threshold(img,127,255,cv2.THRESH_BINARY)

# Otsu's thresholding

ret2,th2 = cv2.threshold(img,0,255,cv2.THRESH_BINARY+cv2.THRESH_OTSU)
# Otsu's thresholding after Gaussian filtering
# ( 5,5 )为高斯核的大小, 0 为标准差  滤波处理

blur = cv2.GaussianBlur(img,(5,5),0)

# 阈值一定要设为 0 !

ret3,th3 = cv2.threshold(blur,0,255,cv2.THRESH_BINARY+cv2.THRESH_OTSU)
# plot all the images and their histograms

images = [img, 0, th1,
img, 0, th2,
blur, 0, th3]
titles = ['Original Noisy Image','Histogram','Global Thresholding (v=127)',
'Original Noisy Image','Histogram',"Otsu's Thresholding",
'Gaussian filtered Image','Histogram',"Otsu's Thresholding"]

# 这里使用了 pyplot 中画直方图的方法, plt.hist, 要注意的是它的参数是一维数组
# 所以这里使用了( numpy ) ravel 方法,将多维数组转换成一维,也可以使用 flatten 方法
#ndarray.flat 1-D iterator over an array.
#ndarray.flatten 1-D array copy of the elements of an array in row-major order.
for i in range(3):

    plt.subplot(3,3,i*3+1),plt.imshow(images[i*3],'gray')
    plt.title(titles[i*3]), plt.xticks([]), plt.yticks([])
    plt.subplot(3,3,i*3+2),plt.hist(images[i*3].ravel(),256)
    plt.title(titles[i*3+1]), plt.xticks([]), plt.yticks([])
    plt.subplot(3,3,i*3+3),plt.imshow(images[i*3+2],'gray')
    plt.title(titles[i*3+2]), plt.xticks([]), plt.yticks([])
plt.show()
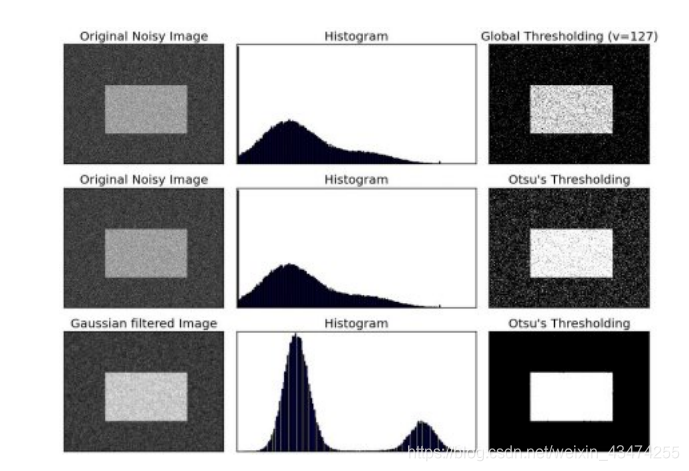


 该博客主要围绕基于Python的OpenCV展开,涉及Oust二值化和高斯滤波操作,属于图像处理领域,利用Python和OpenCV工具实现相关图像处理技术。


 被折叠的 条评论
为什么被折叠?
被折叠的 条评论
为什么被折叠?
 到【灌水乐园】发言


