


用TensorBoard查看数据流图
9.1 graph1
程序:
import tensorflow as tf

x = tf.placeholder(shape=[1, 3], dtype=tf.float32)

w = tf.Variable(tf.ones([3, 3]), dtype=tf.float32)
b = tf.Variable(1, dtype=tf.float32)

y = tf.matmul(x, w) + b

sess = tf.Session()
sess.run(tf.global_variables_initializer())

sess.run(y, feed_dict={x: [[1, 2, 3]]})

writer = tf.summary.FileWriter("graph", sess.graph)
cmd命令行输入:
tensorboard --logdir=E:\PycharmProjects\test20190712\graph
结果:
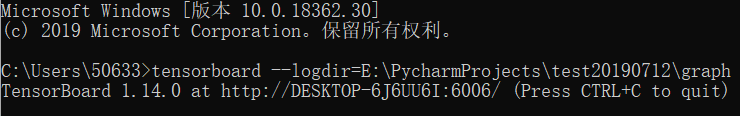
浏览器输入:
http://DESKTOP-6J6UU6I:6006/
控制TensorBoard图中对象的名称
7.2 graph2
程序:
import tensorflow as tf

x = tf.placeholder(shape=[1, 3], dtype=tf.float32, name="x")

w = tf.Variable(tf.ones([3, 3]), dtype=tf.float32, name="w")
b = tf.Variable(1, dtype=tf.float32, name="b")

y = tf.matmul(x, w, name="MatMul") + b

sess = tf.Session()
sess.run(tf.global_variables_initializer())

sess.run(y, feed_dict={x: [[1, 2, 3]]})

writer = tf.summary.FileWriter("graph", sess.graph)
结果:
9.3 graph3
程序:
import tensorflow as tf

x = tf.placeholder(shape=[1, 3], dtype=tf.float32, name="x")

w = tf.Variable(tf.ones([3, 3]), dtype=tf.float32, name="w")
b = tf.Variable(1, dtype=tf.float32, name="b")

y = tf.add(tf.matmul(x, w, name="MatMul"), b, name="y-Add")

sess = tf.Session()
sess.run(tf.global_variables_initializer())

sess.run(y, feed_dict={x: [[1, 2, 3]]})

writer = tf.summary.FileWriter("graph", sess.graph)
结果:


 5万+
5万+

 被折叠的 条评论
为什么被折叠?
被折叠的 条评论
为什么被折叠?
 到【灌水乐园】发言


