


本文总结使用python绘制折线图,使用的函数为matplotlib.pyplot模块。
方法很简单,首先定义两个列表,一个列表作为x轴数值,一个列表作为y轴数值。使用plot函数即可以绘制曲线图。
import matplotlib.pyplot as plt
class ZheXianPlot(object):
def __init__(self):
self.run()
def run(self):
plt.figure(figsize=(8,4))
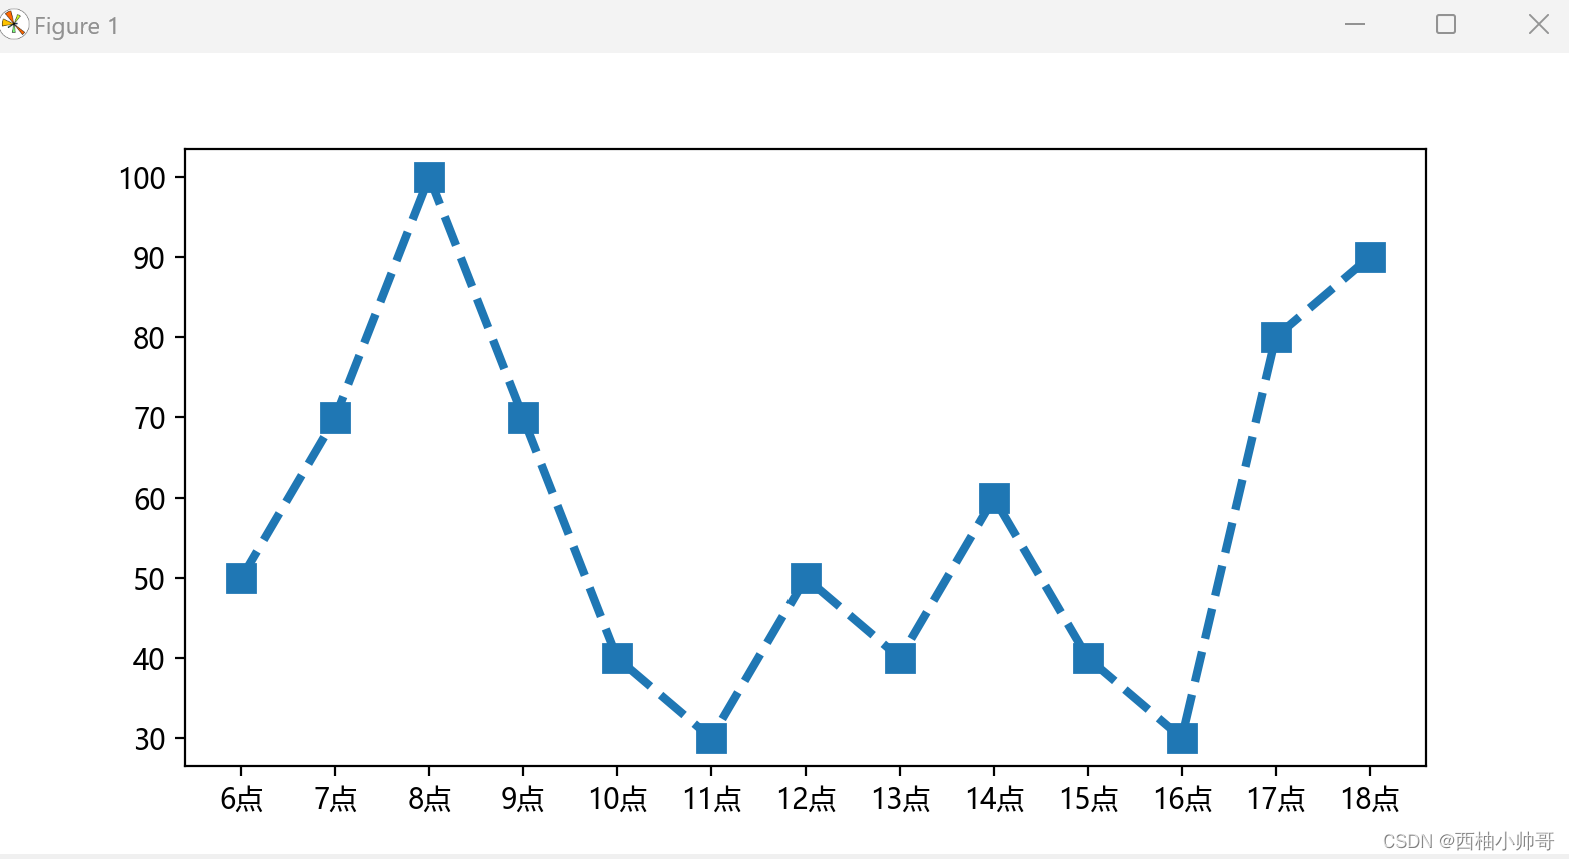
x=['6点','7点','8点','9点','10点','11点','12点','13点','14点','15点','16点','17点','18点']
y=[50,70,100,70,40,30,50,40,60,40,30,80,90]
plt.plot(x,y,linewidth=3,linestyle='dashed',marker='s',markersize=10)
plt.rcParams['font.sans-serif']=['Microsoft YaHei'] #设置字体为微软雅黑体,保证正常显示中文
plt.rcParams['axes.unicode_minus']=False
plt.show()
if __name__=="__main__":
ZheXianPlot()
生成的图片样式如下:
在plot函数中,通过定义不同的参数可以修改折线图的样式,修改曲线的形状的参数为linestyle:
| 参数 | 线形 |
|---|---|
| solid | ————— |
| dashed | ----------- |
| dotted | … |
| dashdot | -.-.-.-.-. |
| None | 不划线 |
修改折线的标记为:marker
marker参数列表包含:
| 参数 | 样式 |
|---|---|
| . | 点圆 |
| o | 圆 |
| v | 倒三角 |
| ^ | 正三角 |
| s | 正方向 |
| * | 五角星 |
| p | 五边形 |
| h | 六边形 |
| D | 斜四边形 |
| d | 菱形 |
| + | + |
| x | X |


 1422
1422

 被折叠的 条评论
为什么被折叠?
被折叠的 条评论
为什么被折叠?
 到【灌水乐园】发言


