


 本文介绍了一种使用Python的Turtle模块绘制复杂树形图案的方法。通过递归调用tree函数,可以创建出多分支的树状结构。文章详细展示了如何通过调整参数来改变树的形状,包括树干长度、分支角度和颜色。通过修改代码,读者可以尝试绘制出不同的图形。
复制代码到Python中运行:
#coding=utf-8
import turtle
import time
turtle.tracer(False) #1、这行代码如果注释后再运行,是每一画都显示;2、如不注释就运行,直接出结果
def tree(branchLen,t):
if branchLen > 5:
t.forward(branchLen)
t.right(20) #右转20度
tree(branchLen-15,t) #画枝丫,代码越多越密
tree(branchLen-30,t) #画枝丫,代码越多越密
tree(branchLen-10,t) #画枝丫,代码越多越密
tree(branchLen-20,t) #画枝丫,代码越多越密
tree(branchLen-25,t) #画枝丫,代码越多越密
tree(branchLen-35,t) #画枝丫,代码越多越密
tree(branchLen-40,t) #画枝丫,代码越多越密
tree(branchLen-45,t) #画枝丫,代码越多越密
t.left(40)
tree(branchLen-15,t)
tree(branchLen-30,t)
tree(branchLen-10,t)
tree(branchLen-20,t)
tree(branchLen-25,t)
tree(branchLen-35,t)
tree(branchLen-40,t)
tree(branchLen-45,t)
t.right(20)
t.backward(branchLen)
def main():
t = turtle.Turtle()
myWin = turtle.Screen()
time.sleep(2)
t.left(0)
t.up() #海龟尾巴向上,移动不划线
t.backward(15)
t.down() #海龟尾巴向下
t.color("green") #设置画笔颜色,绿色
tree(75,t) #枝丫的幅度
tree(60,t) #枝丫的幅度
tree(30,t) #枝丫的幅度
tree(10,t) #枝丫的幅度
t.left(90)
t.up()#海龟尾巴向上,移动不划线
t.backward(15)
t.down()#海龟尾巴向下
t.color("gold")#设置画笔颜色,金色
tree(75,t)
tree(60,t)
tree(30,t)
tree(10,t)
t.left(180)
t.up()#海龟尾巴向上,移动不划线
t.backward(15)
t.down()#海龟尾巴向下
t.color("black")#设置画笔颜色,黑色
tree(75,t)
tree(60,t)
tree(30,t)
tree(10,t)
t.left(270)
t.up()#海龟尾巴向上,移动不划线
t.backward(15)
t.down()#海龟尾巴向下
t.color("red")#设置画笔颜色,红色
tree(75,t)
tree(60,t)
tree(30,t)
tree(10,t)
myWin.exitonclick()
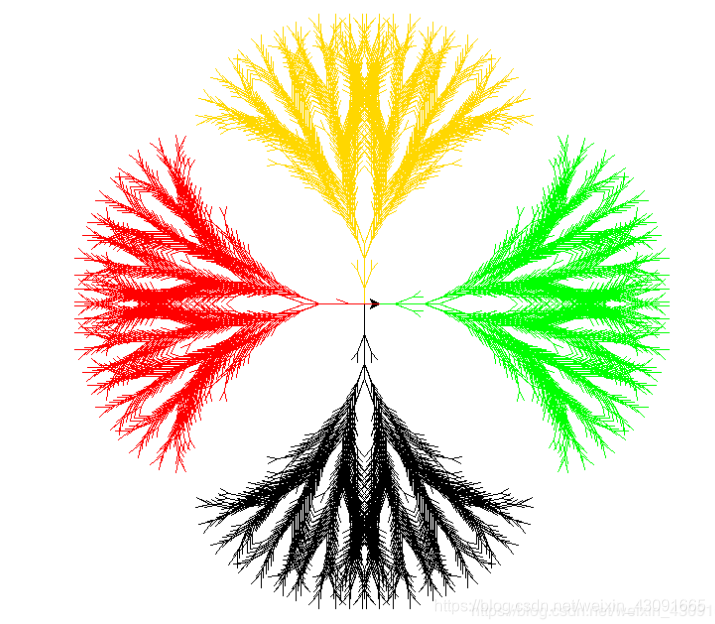
main()所得图形,中间代码改改,能得到其他图形


 3382
3382

 被折叠的 条评论
为什么被折叠?
被折叠的 条评论
为什么被折叠?
 到【灌水乐园】发言


