


 本文通过一组训练数据探讨了数据分类的方法,展示了如何使用简单的边界曲线来区分数据集,并讨论了复杂曲线在提高训练数据分类准确性的同时可能带来的过拟合问题。
我们需要把图中的数据位置(或坐标)分成两组。
We need to divide the position (orcoordinate) data into two groups.
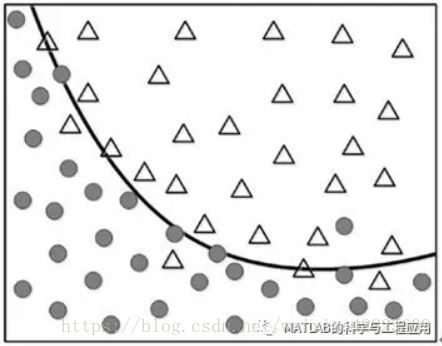
图1-6中的数据点是训练数据。
The points on the figure are the trainingdata.
设计目标是使用训练数据确定两组数据边界的曲线。
The objective is to determine a curve thatdefines the border of the two groups using the training data.
虽然我们看到一些偏离适当区域的异常值,但是图1-7中所示的曲线似乎充当了两组数据之间的合理边界。
Although we see some outliers that deviatefrom the adequate area, the curve shown in Figure 1-7 seems to act as areasonable border between the groups.
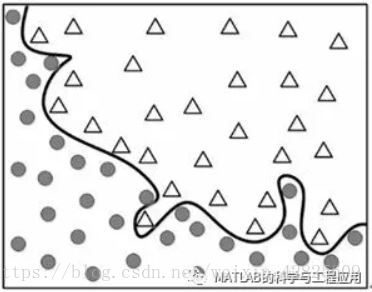
图1-7 区分两类数据集合的曲线Curve to differentiatebetween two types of data
当我们研判这条曲线时,在曲线边界附近存在一些不正确分类的数据点。
When we judge this curve, there are somepoints that are not correctly classified according to the border.
如何用复杂的曲线完美地将这些数据点进行分类呢,如图1-8所示?
What about perfectly grouping the pointsusing a complex curve, as shown in Figure 1-8?
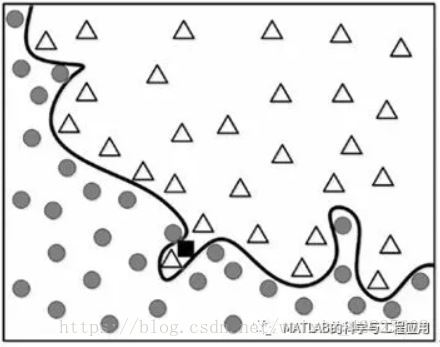
图1-8 更完美的数据分组,但是随之而来的代价呢?Better grouping,but at what cost?
图1-8中的模型得到了训练数据的完美分组性能。
This model yields the perfect groupingperformance for the training data.
它看起来如何呢?
How does it look?
你喜欢这个模型吗?
Do you like this model better?
它似乎正确地反映了数据分组的一般行为吗?
Does it seem to reflect correctly thegeneral behavior?
现在,让我们在现实世界中使用这个模型。
Now, let’s use this model in the realworld.
如图1-9所示,输入模型的新数据用符号■表示。
The new input to the model is indicatedusing the symbol ■, as shown inFigure 1-9.
图1-9 新输入的数据放置在训练数据集合中The new input isplaced into the data
这个傲慢无误的模型将新数据标识为∆类。
This proud error-free model identifies thenew data as a class ∆.
然而,训练数据的总趋势告诉我们,这是值得怀疑的。
However, the general trend of the trainingdata tells us that this is doubtable.
将这个新数据归为•类似乎更合理。
Grouping it as a class• seems morereasonable.
由训练数据产生的100%准确度的模型究竟发生了什么问题?(居然出现了错误!)
What happened to the model that yielded100% accuracy for the training data?
让我们再看一下这些数据集合。
Let’s take another look at the data points.
——本文译自Phil Kim所著的《Matlab Deep Learning》
更多精彩文章请关注微信号:


 2446
2446

 被折叠的 条评论
为什么被折叠?
被折叠的 条评论
为什么被折叠?
 到【灌水乐园】发言


