


一、 简介
Grafana 是基于JS开发的,功能齐全的度量仪表盘和图形编辑器,帮助开发人员发现问题的工具。官网:https://grafana.com。
二、安装
1. grafana安装
1).官网地址有各个系统的安装介绍:https://grafana.com/grafana/download
 wget https://dl.grafana.com/enterprise/release/grafana-enterprise-9.2.0-1.x86_64.rpm
 yum install grafana-enterprise-9.2.0-1.x86_64.rpm
2). 启动
# 开机启动
/sbin/chkconfig --add grafana-server
# 启动
service grafana-server start
3). 访问 ip:3000
2. 安装
# 下载安装包
wget https://github.com/prometheus/prometheus/releases/download/v2.39.1/prometheus-2.39.1.linux-amd64.tar.gz
# 解压
tar -xvf prometheus-2.39.1.linux-amd64.tar.gz
# 移动位置
mv prometheus-2.39.1.linux-amd64/ /usr/local/prometheus/
# 使用默认配置文件启动
/usr/local/prometheus/prometheus --config.file="/usr/local/prometheus/prometheus.yml" &
# 确认端口
ss -anltp | grep 9090
# 浏览器查看服务请情况 http://服务器IP:9090/metrics
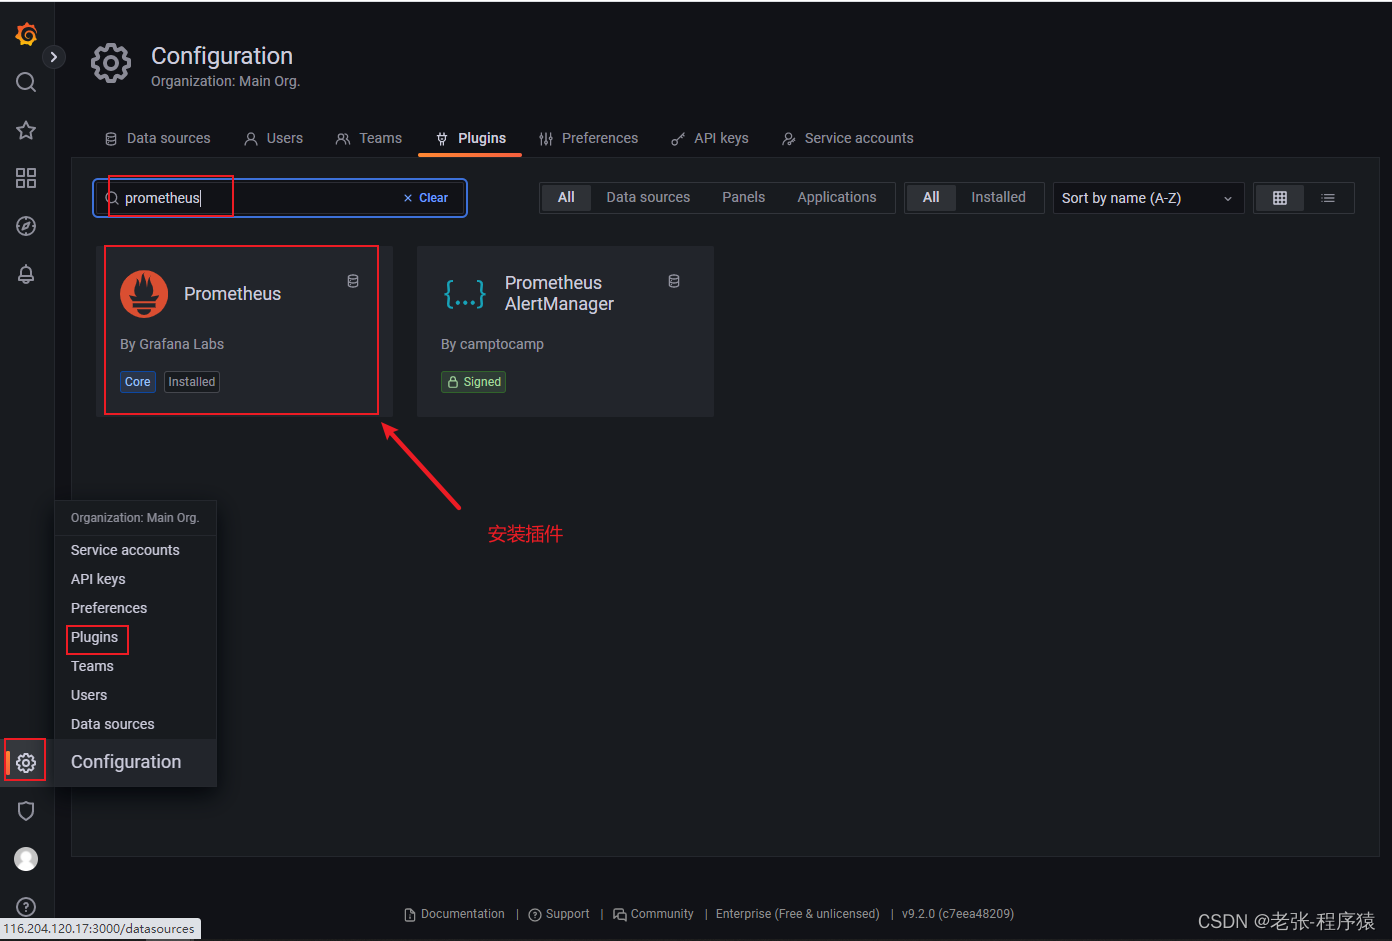
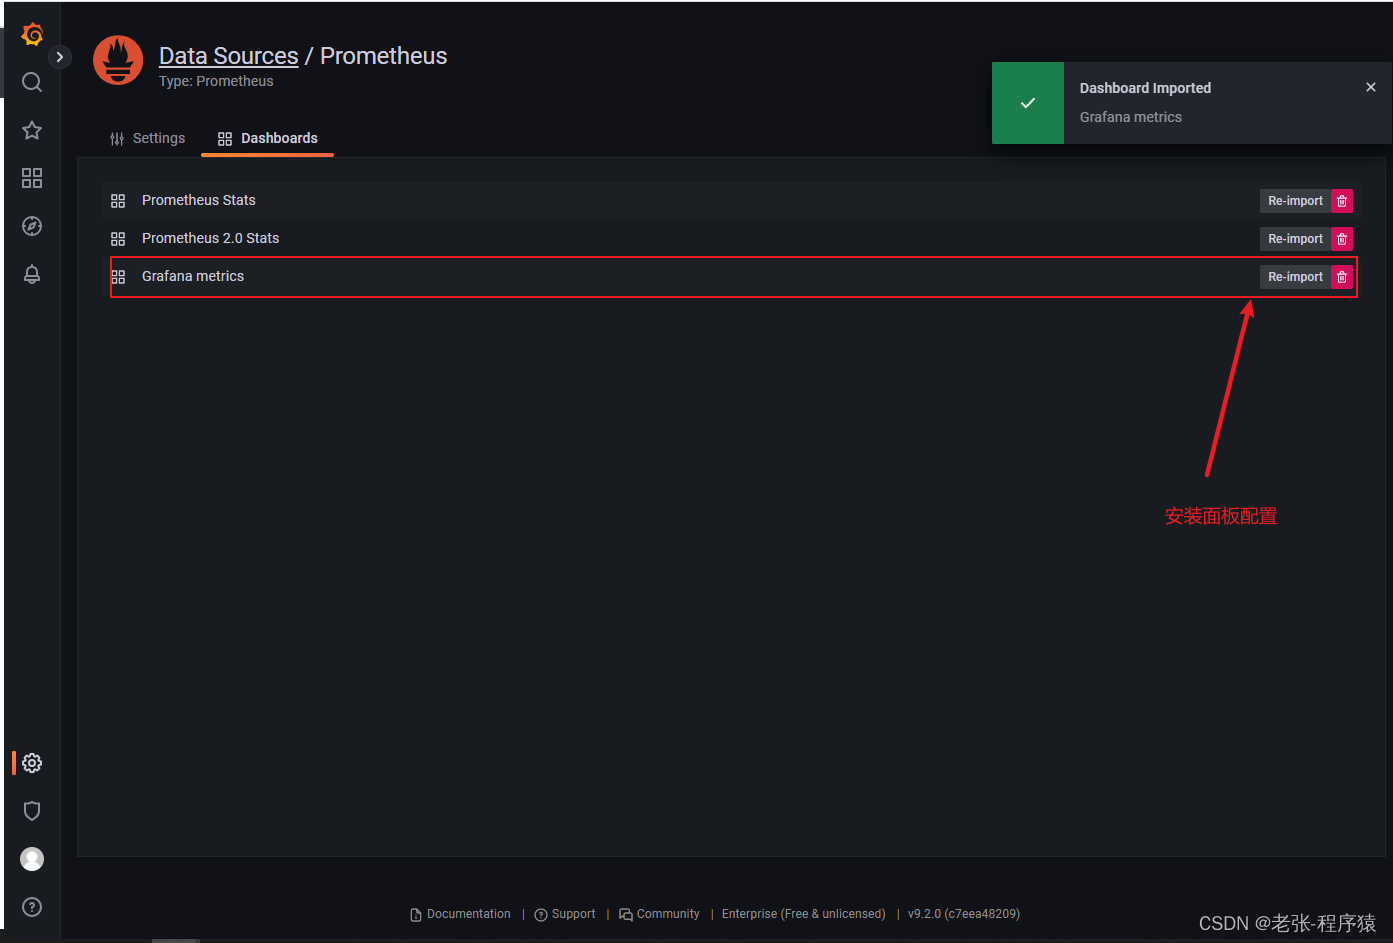
二、配置


 被折叠的 条评论
为什么被折叠?
被折叠的 条评论
为什么被折叠?
 到【灌水乐园】发言


