


<div id="main" style="width: 700px;height:400px;"></div>
$(function () {
$.post('[[${ctx}]]/mine/opinions/getCharts2', {
/* complaintsType: $('#feedbackTypeList').val(),
departmentId: $('#departmentList').val(),*/
}, function (result) {
var scrollingNumber = echarts.init(document.getElementById('main'));
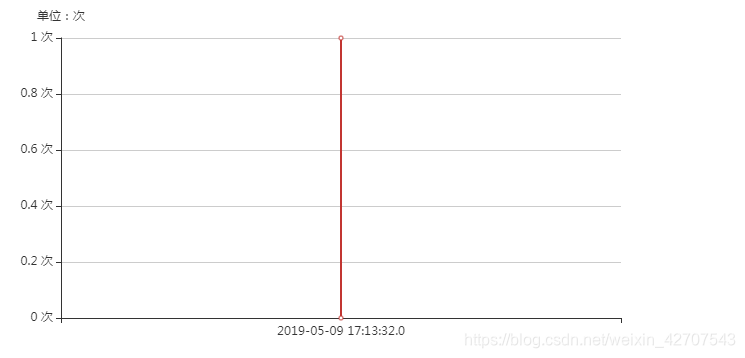
option = {
xAxis: {
type: 'category',
data: result.date
},
yAxis: {
name: '单位:次', //Y轴提示
type: 'value',
axisLabel: {
formatter: '{value} 次' //Y轴单位
}
},
series: [{
data: result.count,
type: 'line'
}]
};
scrollingNumber.setOption(option);
})
});
后台代码
@Log("统计收入折线图")
	@RequestMapping("getCharts2")
	@ResponseBody
	public Map<String,Object> getCharts2(OpinionsSuggestions opinionsSuggestions){
		Map<String,Object> map = new HashMap<>();
		List<OpinionsSuggestions> getList = opinionsSuggestionsService.getChart(opinionsSuggestions);    //查询获取数据
		SimpleDateFormat simpleDateFormat = new SimpleDateFormat("yyyy-MM-dd");
		List<Integer>  count = new ArrayList<>();
		List<String> date = new ArrayList<>();
		for(int i=0;i<getList.size();i++){                                     //循环获取数据
			count.add(getList.get(i).getCount());
			if (getList.get(i).getCreateTime()!=null){
				date.add(getList.get(i).getCreateTime());
			}
		}
		map.put("date",date);
		map.put("count",count);
		return map;

	}


 被折叠的 条评论
为什么被折叠?
被折叠的 条评论
为什么被折叠?
 到【灌水乐园】发言


