


 本文展示了如何在Python中使用matplotlib库绘制分段函数,并提供了详细的代码示例。通过加载latex数学符号包,可以实现公式在图例中的正确显示。函数`f(x)`根据x值的不同返回不同的表达式,然后在图表上展示出来。
好的,这是解决办法。它包括加载latex mathsymbols包。假设您已在PC中安装了所需的latex软件包。有关详细信息,请参阅MatplotlibRC
代码:#/usr/bin/env python3
# -*- coding: utf-8 -*-
import numpy as np
import matplotlib.pyplot as plt
from matplotlib import rcParams
rcParams['text.latex.unicode'] = True
rcParams['text.usetex'] = True
rcParams['text.latex.preamble'] = '\usepackage{amsthm}', '\usepackage{amsmath}', '\usepackage{amssymb}',
'\usepackage{amsfonts}', '\usepackage[T1]{fontenc}', '\usepackage[utf8]{inputenc}, \usepackage{multicol}'
rcParams['legend.handleheight'] = 3.0
#This fixes the legend line be placed at same height that text legend
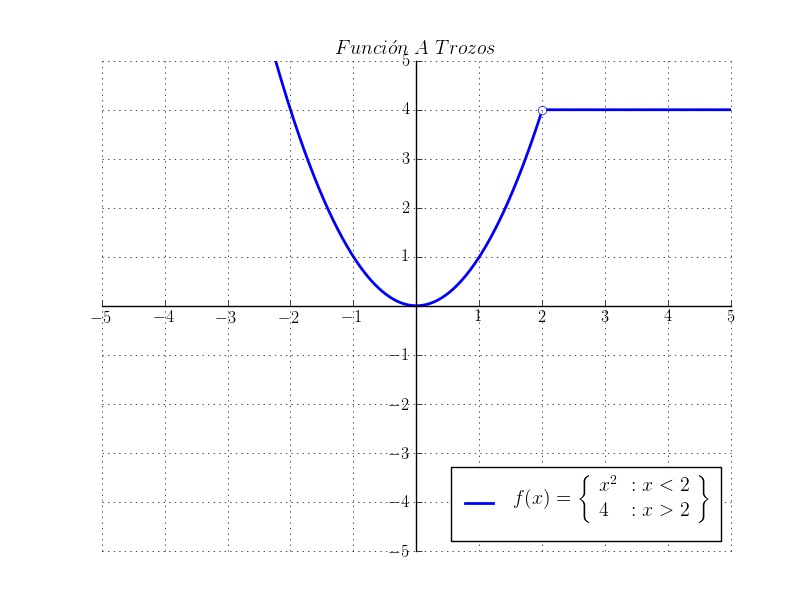
def f(x):
return np.piecewise(x, [x < 2.0, x > 2.0], [lambda x: x ** 2.0, lambda x: 4.0])
fig, ax = plt.subplots()
x = np.linspace(-5.0, 5.0, 1000)
ax.axis([x[0], x[-1], x[0], x[-1]])
ax.spines['left'].set_position('center')
ax.spines['right'].set_color('none')
ax.spines['bottom'].set_position('center')
ax.spines['top'].set_color('none')
ax.spines['left']
ax.spines['bottom']
ax.xaxis.set_ticks_position('bottom')
ax.yaxis.set_ticks_position('left')
ticks = []
for i in range(int(x[0]), int(x[-1] + 1), 1):
ticks.append(i)
ticks.remove(0)
ax.set_xticks(ticks)
ax.set_yticks(ticks)
ax.plot(x, f(x), 'b-', 2, 4, 'wo', markeredgecolor='b',
markerfacecolor='w', lw=2.0)
tlegend = r'$f(x)=\left\{\begin{array}{lr} x^2 & : x<2\\ 4 & : x>2\end{array}\right\}$'
ax.legend([tlegend], loc='lower right')
ax.set_title(ur'$Función\; A\; Trozos$') # If you use accents put ur option.
ax.grid('on')
plt.show()
图像:
如果有人知道如何改进下面的代码,我们欢迎:
^{pr2}$


 1413
1413

 被折叠的 条评论
为什么被折叠?
被折叠的 条评论
为什么被折叠?
 到【灌水乐园】发言


