


算法学习、4对1辅导、论文辅导、核心期刊
项目的代码和数据下载可以通过公众号滴滴我
一、项目背景
本期我们通过分析某医院半年内的药品销售数据,看看医院那些药物购买者较多,那些天购药者较多等等,希望对小伙伴们有所帮助,如有疑问或者需要改进的地方可以在评论区留言。
二、数据说明
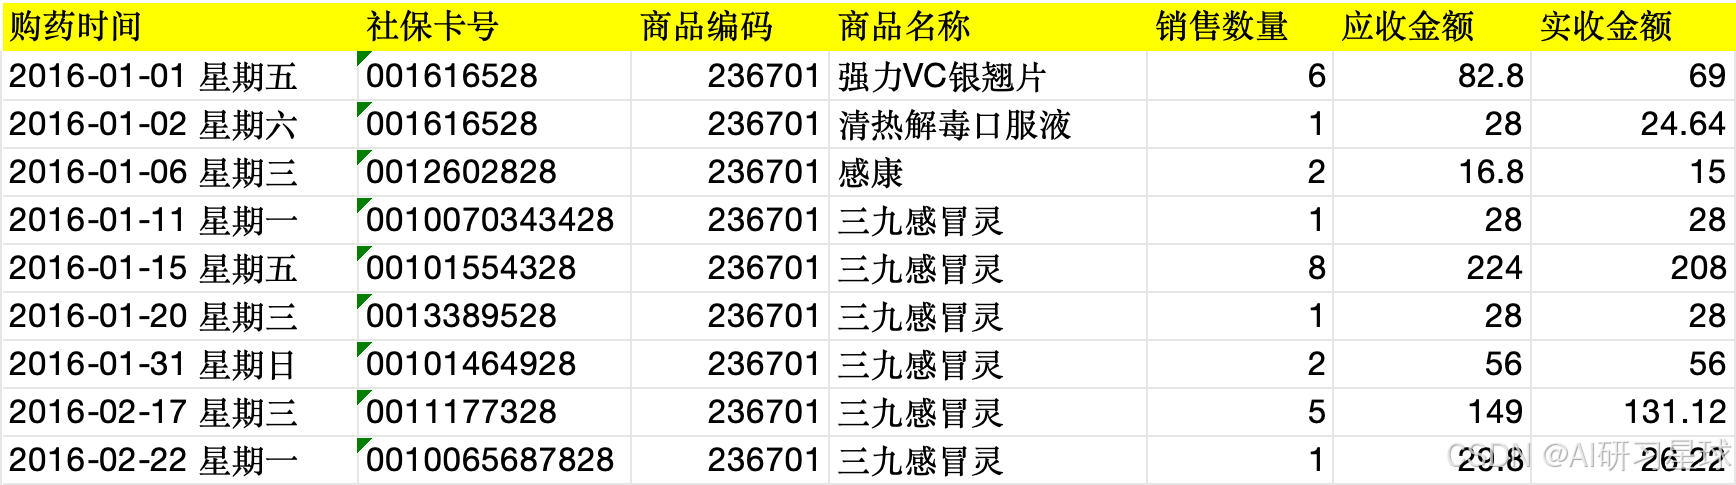
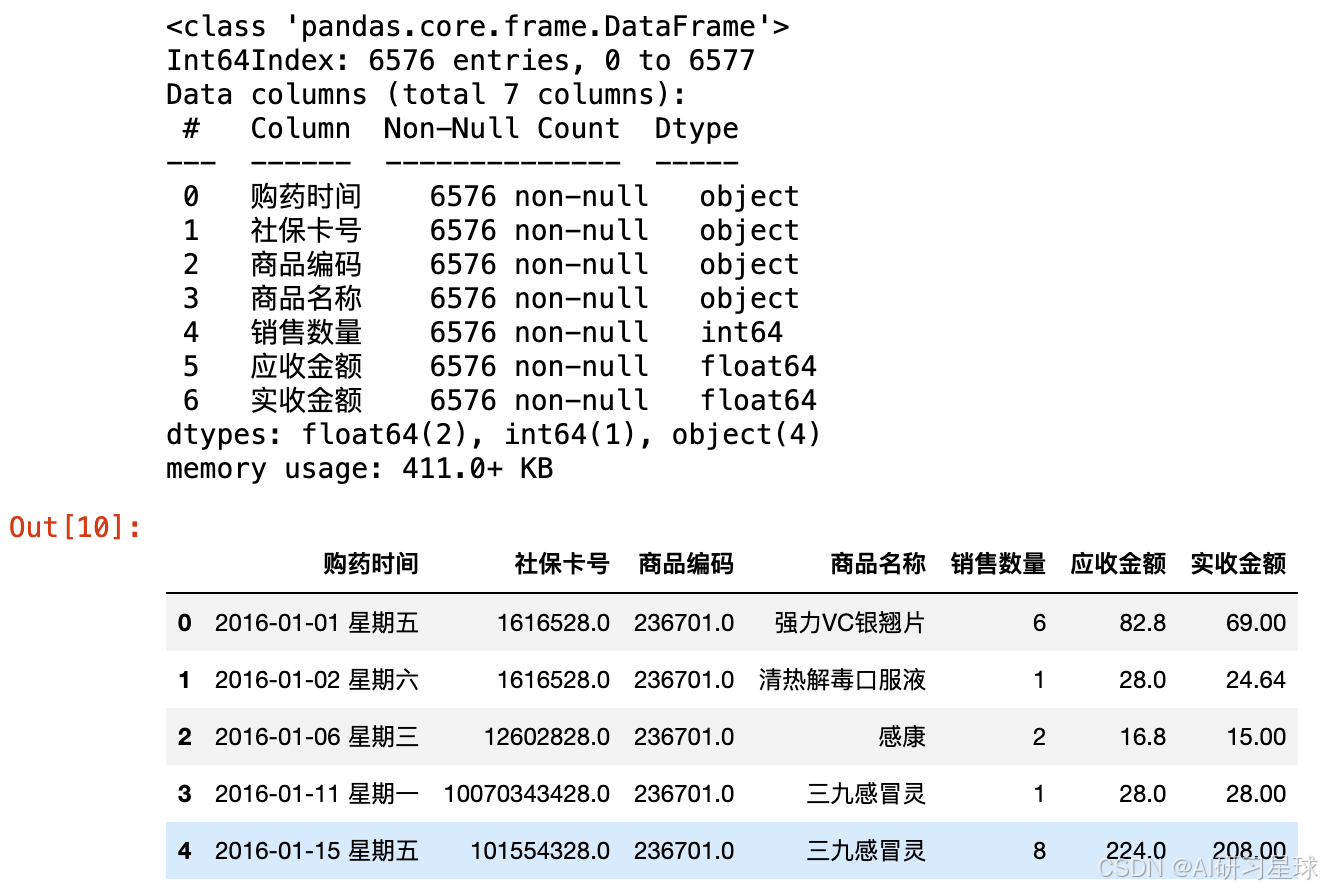
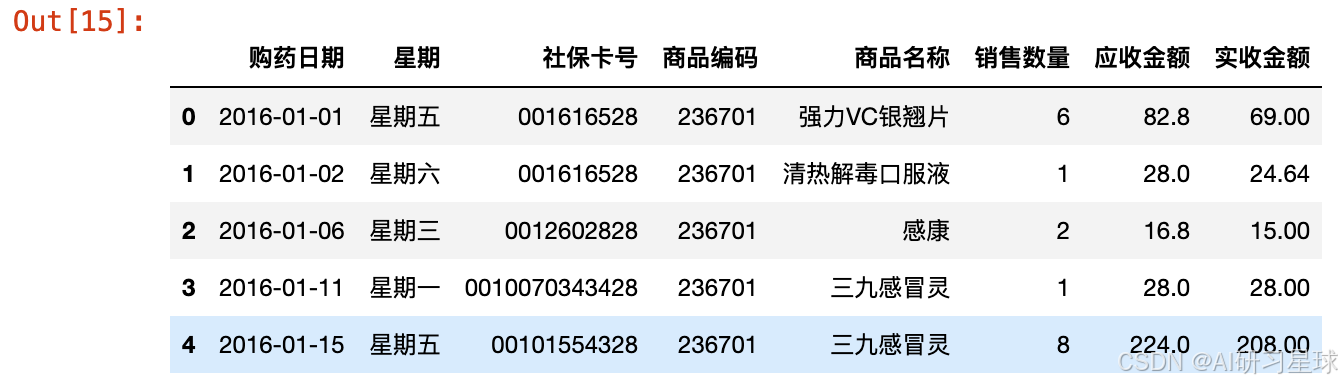
该数据共6578条数据,共7个字段。分别是:购药时间、社保卡号、商品编码、商品名称、销售数量、应收金额、实收金额。
以下是表的部分数据:
三、数据分析
1、导入模块
import pandas as pd
import stylecloud
from PIL import Image
from collections import Counter
from pyecharts.charts import Bar
from pyecharts.charts import Line
from pyecharts.charts import Calendar
from pyecharts import options as opts
from pyecharts.commons.utils import JsCode
from pyecharts.globals import SymbolType
2、Pandas数据处理
2.1 读取数据
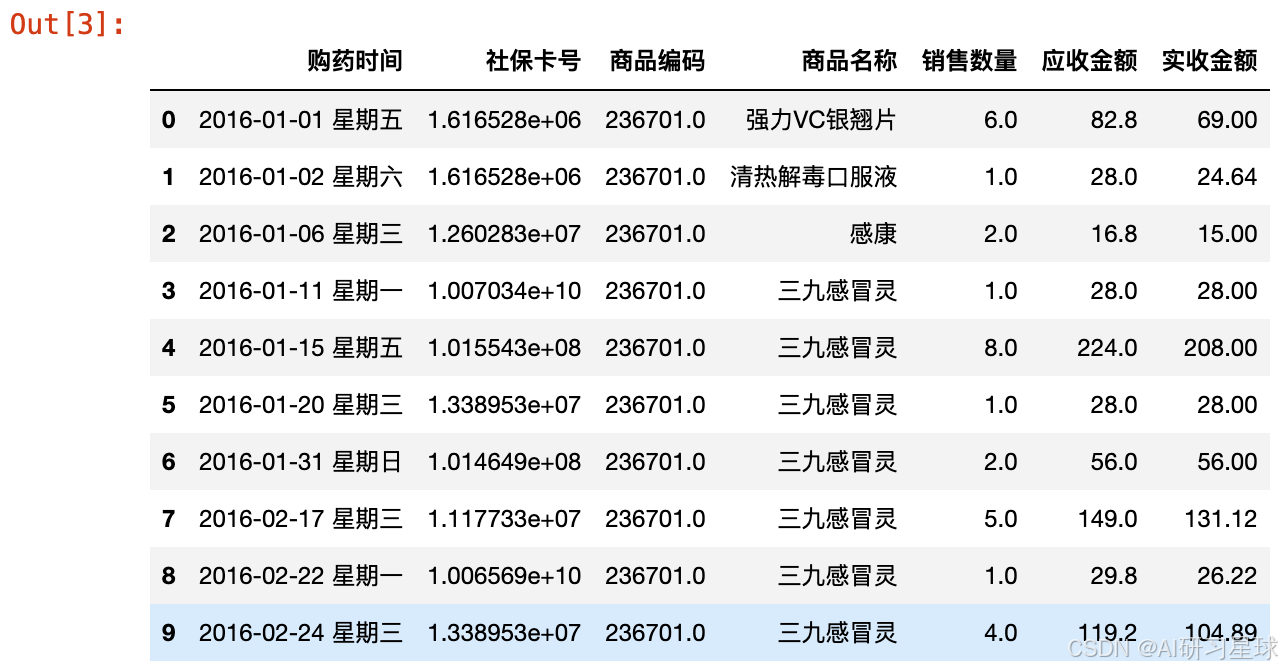
df = pd.read_excel('医院药品销售数据.xlsx')
df.head(10)
2.2 数据大小
df.shape
(6578, 7)
一共6578条药品购买数据。
2.3 查看索引、数据类型和内存信息
df.info()

部分列存在数据缺失
2.4 统计空值数据
df.isnull().sum()

2.5 输出包含空值的行
df[df.isnull().T.any()]
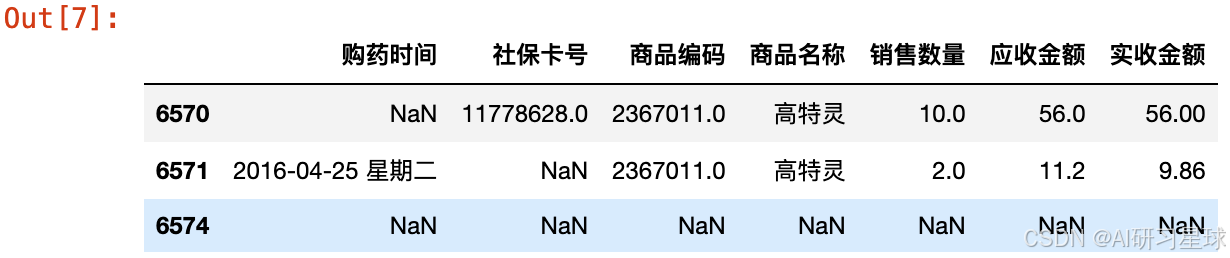
因为购药时间在后面的分析中会用到,所以我们将购药时间为空的行删除
df1 = df.copy()
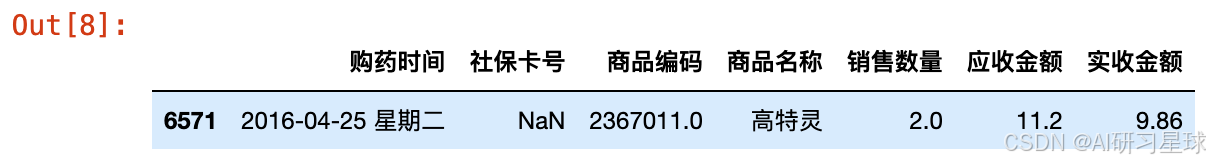
df1 = df1.dropna(subset=['购药时间'])
df1[df1.isnull().T.any()]
2.6 社保卡号用"000"填充
df1['社保卡号'].fillna('0000', inplace=True)
df1.isnull().sum()

可以看到没有空值了
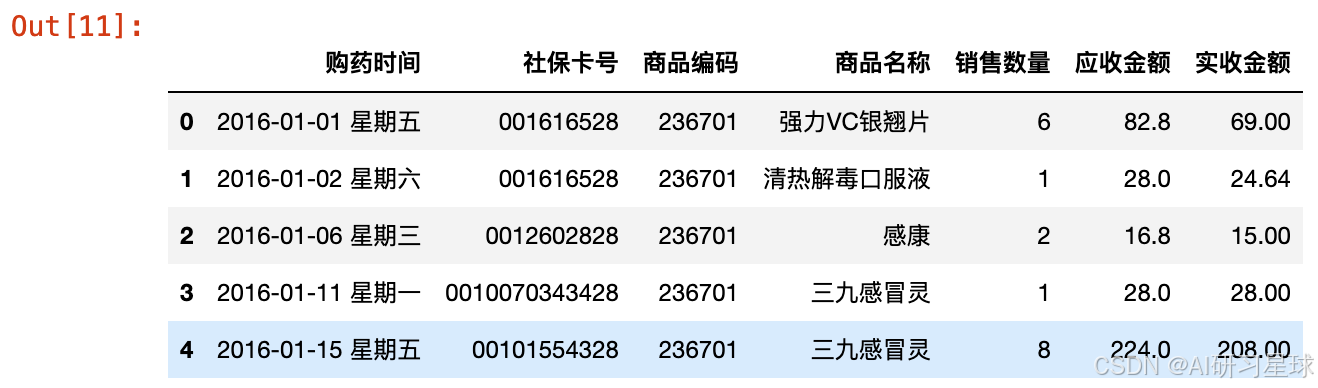
2.7 社保卡号、商品编码为一串数字,应为str类型,销售数量应为int类型
df1['社保卡号'] = df1['社保卡号'].astype(str)
df1['商品编码'] = df1['商品编码'].astype(str)
df1['销售数量'] = df1['销售数量'].astype(int)
df1.info()
df1.head()
虽然这里我们强制转换社保卡号、商品编码为str类型,但是在读取表格的时候是以float读取的,所以存在小数点,这里我们可以在读取表格文件时指定相应列的数据类型(需要注意如果数据存在空值,那么转换数值型时会失效):
df_tmp = pd.read_excel('医院药品销售数据.xlsx', converters={'社保卡号':str, '商品编码':str, '销售数量':int})
df_tmp.head()
2.8 销售数量、应收金额、实收金额分布情况
df2 = df_tmp.copy()
df2 = df2.dropna(subset=['购药时间'])
df2['社保卡号'].fillna('0000', inplace=True)
df2['销售数量'] = df2['销售数量'].astype(int)
df2[['销售数量','应收金额','实收金额']].describe()
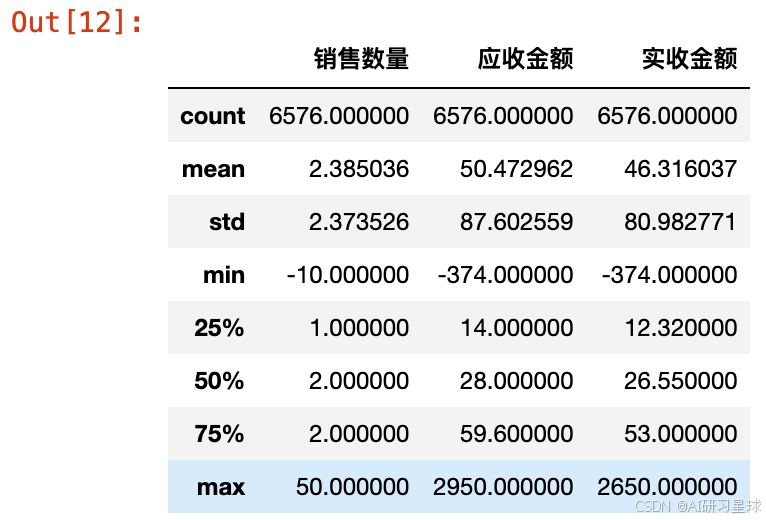
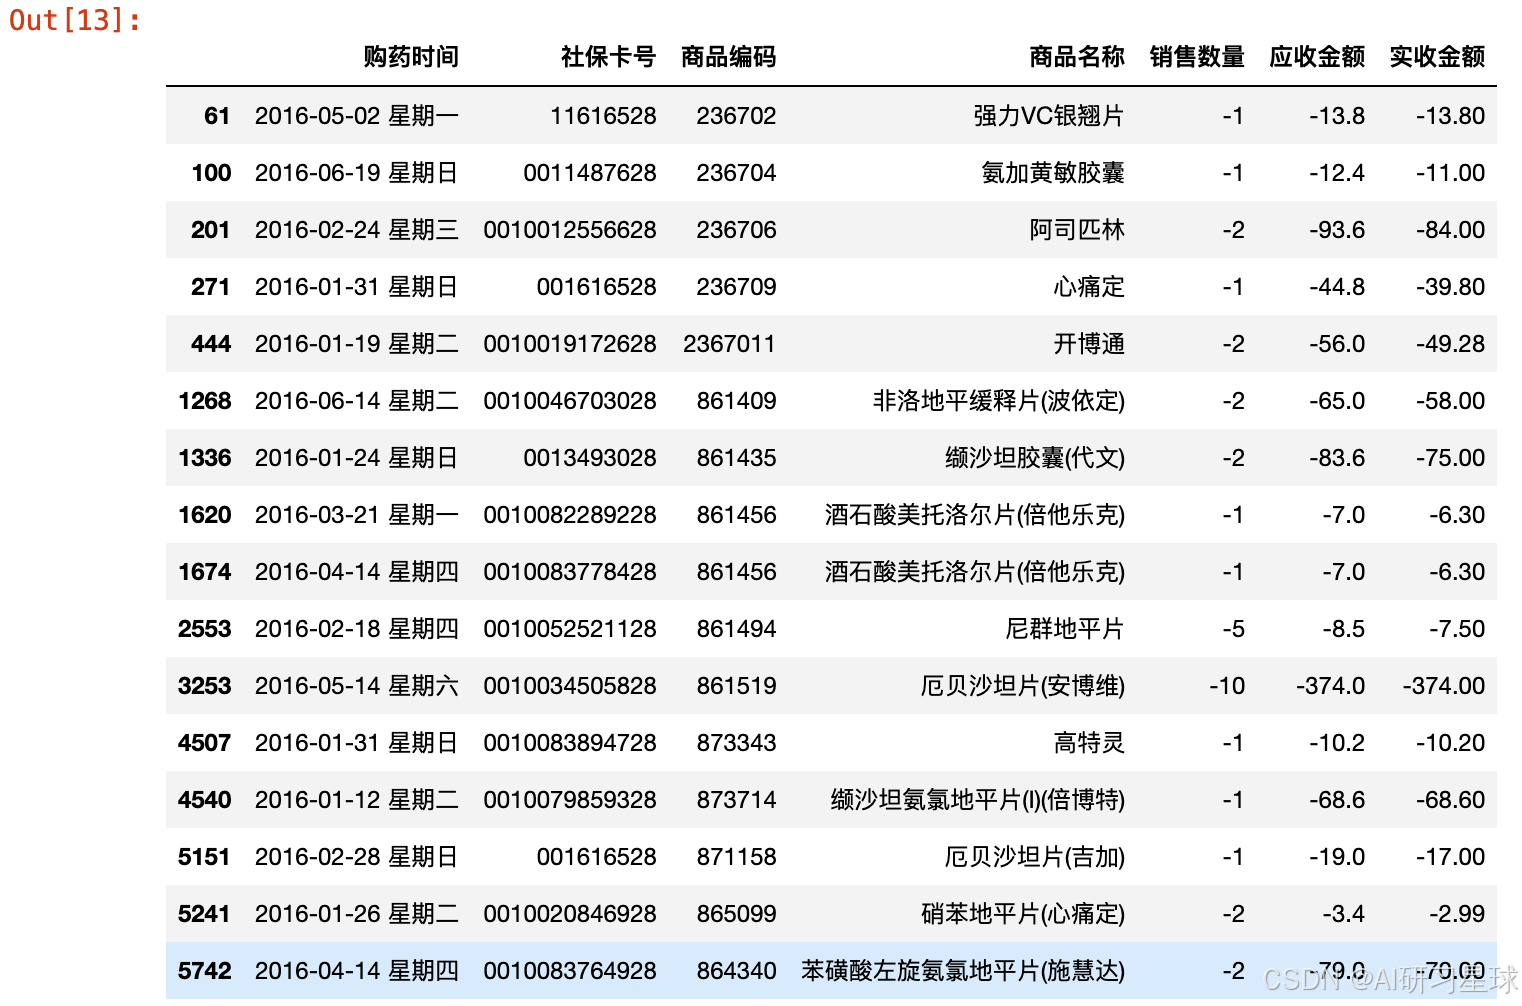
数据中存在负值,显然不合理,我们看一下负值所在的行:
df2.loc[(df2['销售数量'] < 0)]
2.9 负值转正值
df2['销售数量'] = df2['销售数量'].abs()
df2['应收金额'] = df2['应收金额'].abs()
df2['实收金额'] = df2['实收金额'].abs()
df2.loc[(df2['销售数量'] < 0) | (df2['应收金额'] < 0) | (df2['实收金额'] < 0)].sum()

2.10 列拆分(购药时间列拆分为两列)
df3 = df2.copy()
df3[['购药日期', '星期']] = df3['购药时间'].str.split(' ', 2, expand = True)
df3 = df3[['购药日期', '星期','社保卡号','商品编码', '商品名称', '销售数量', '应收金额', '实收金额' ]]
df3.head()
2.11 数据时间范围
len(df3['购药日期'].unique())
df3.groupby('购药日期').sum()
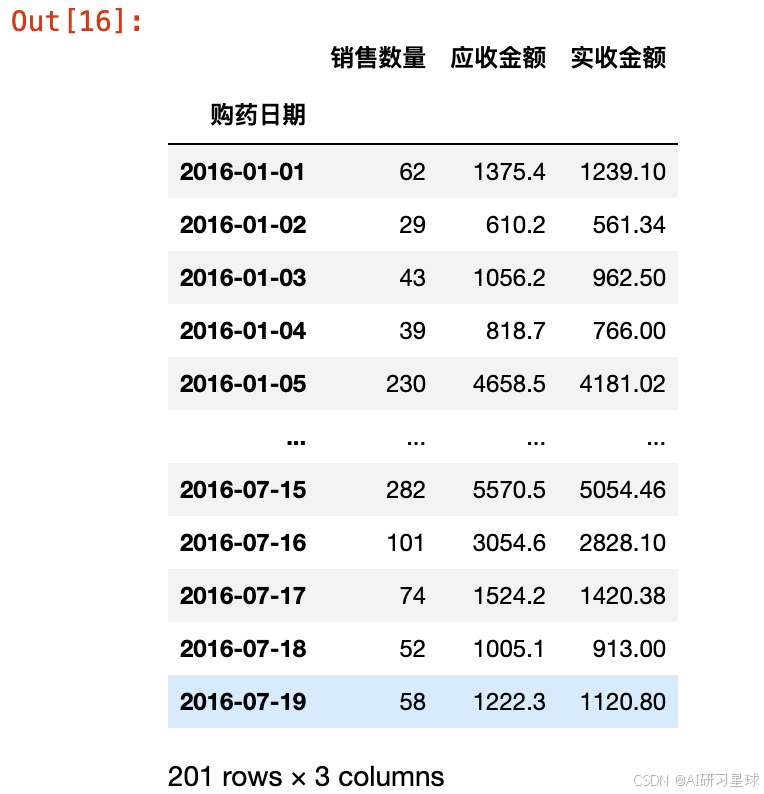
一共201个购买日期,时间范围2016-01-01至2016-07-19
3、Pyecharts数据可视化
3.1 一周各天药品销售柱状图
color_js = """new echarts.graphic.LinearGradient(0, 1, 0, 0,
    [{offset: 0, color: '#FFFFFF'}, {offset: 1, color: '#ed1941'}], false)"""

g1 = df3.groupby('星期').sum()
x_data = list(g1.index)
y_data = g1['销售数量'].values.tolist()
b1 = (
        Bar()
        .add_xaxis(x_data)
        .add_yaxis('',y_data ,itemstyle_opts=opts.ItemStyleOpts(color=JsCode(color_js)))
        .set_global_opts(title_opts=opts.TitleOpts(title='一周各天药品销量',pos_top='2%',pos_left = 'center'),
            legend_opts=opts.LegendOpts(is_show=False),
            xaxis_opts=opts.AxisOpts(axislabel_opts=opts.LabelOpts(rotate=-15)),
            yaxis_opts=opts.AxisOpts(name="销量",name_location='middle',name_gap=50,name_textstyle_opts=opts.TextStyleOpts(font_size=16)))

    )
b1.render_notebook()
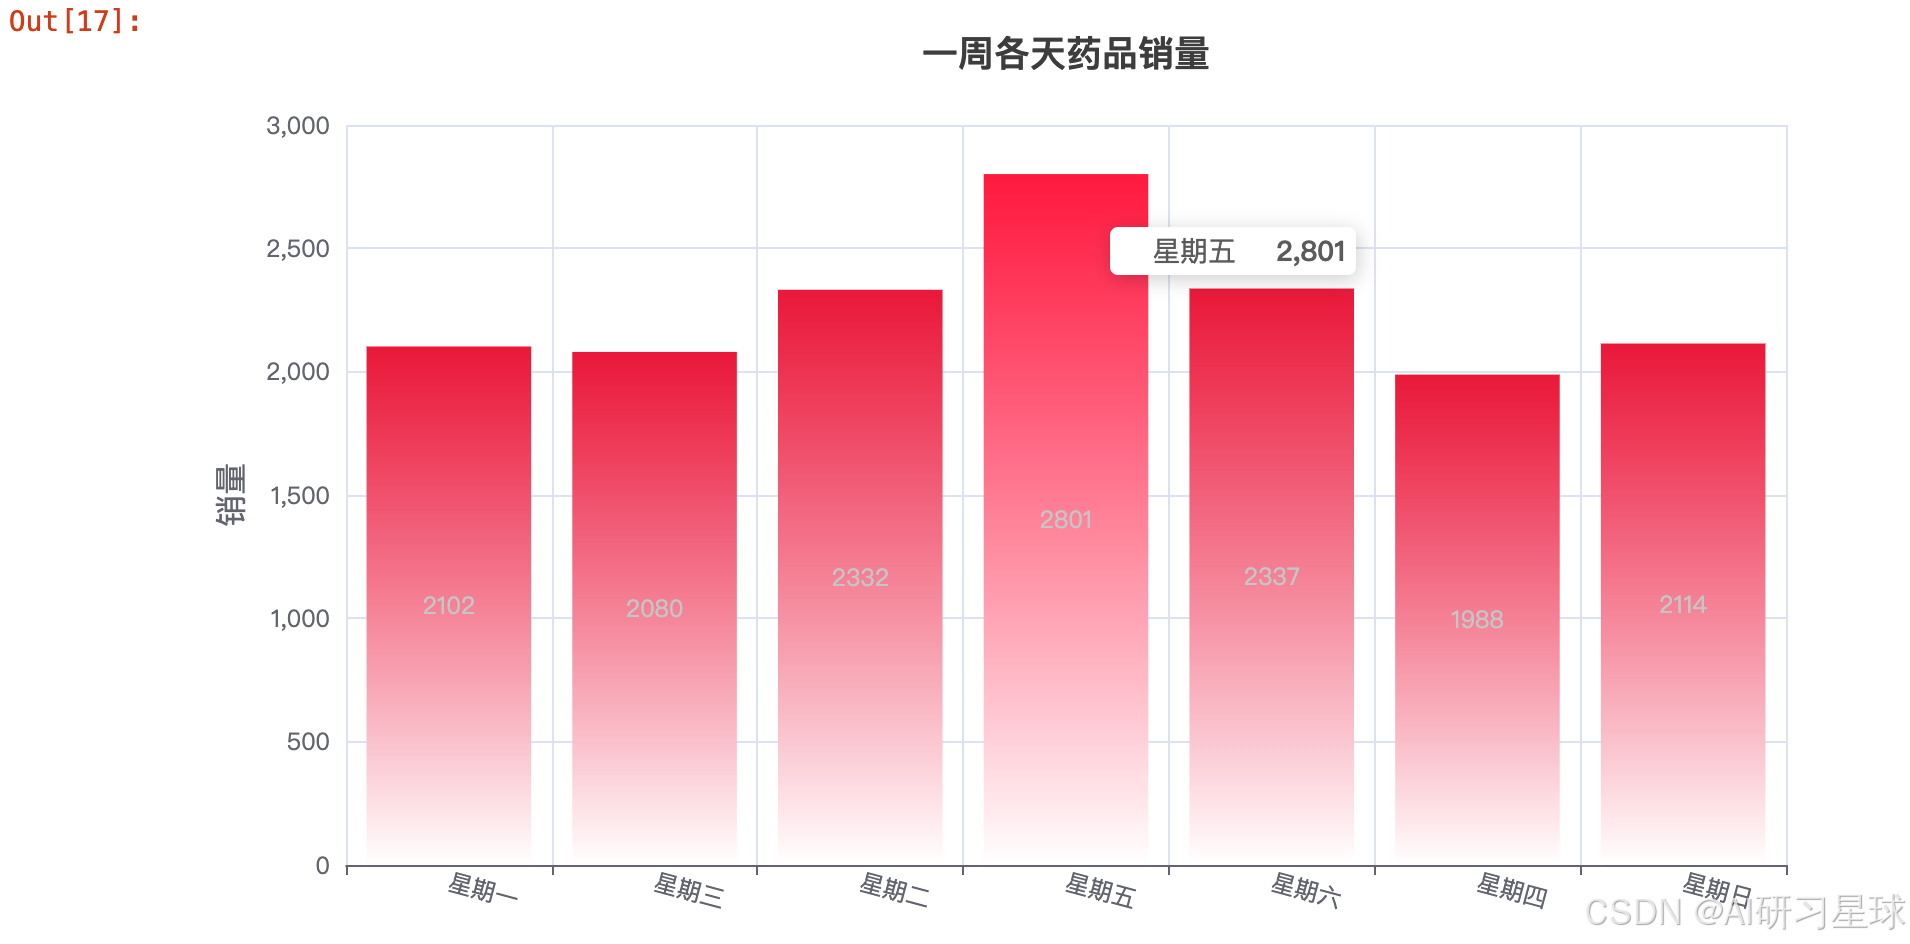
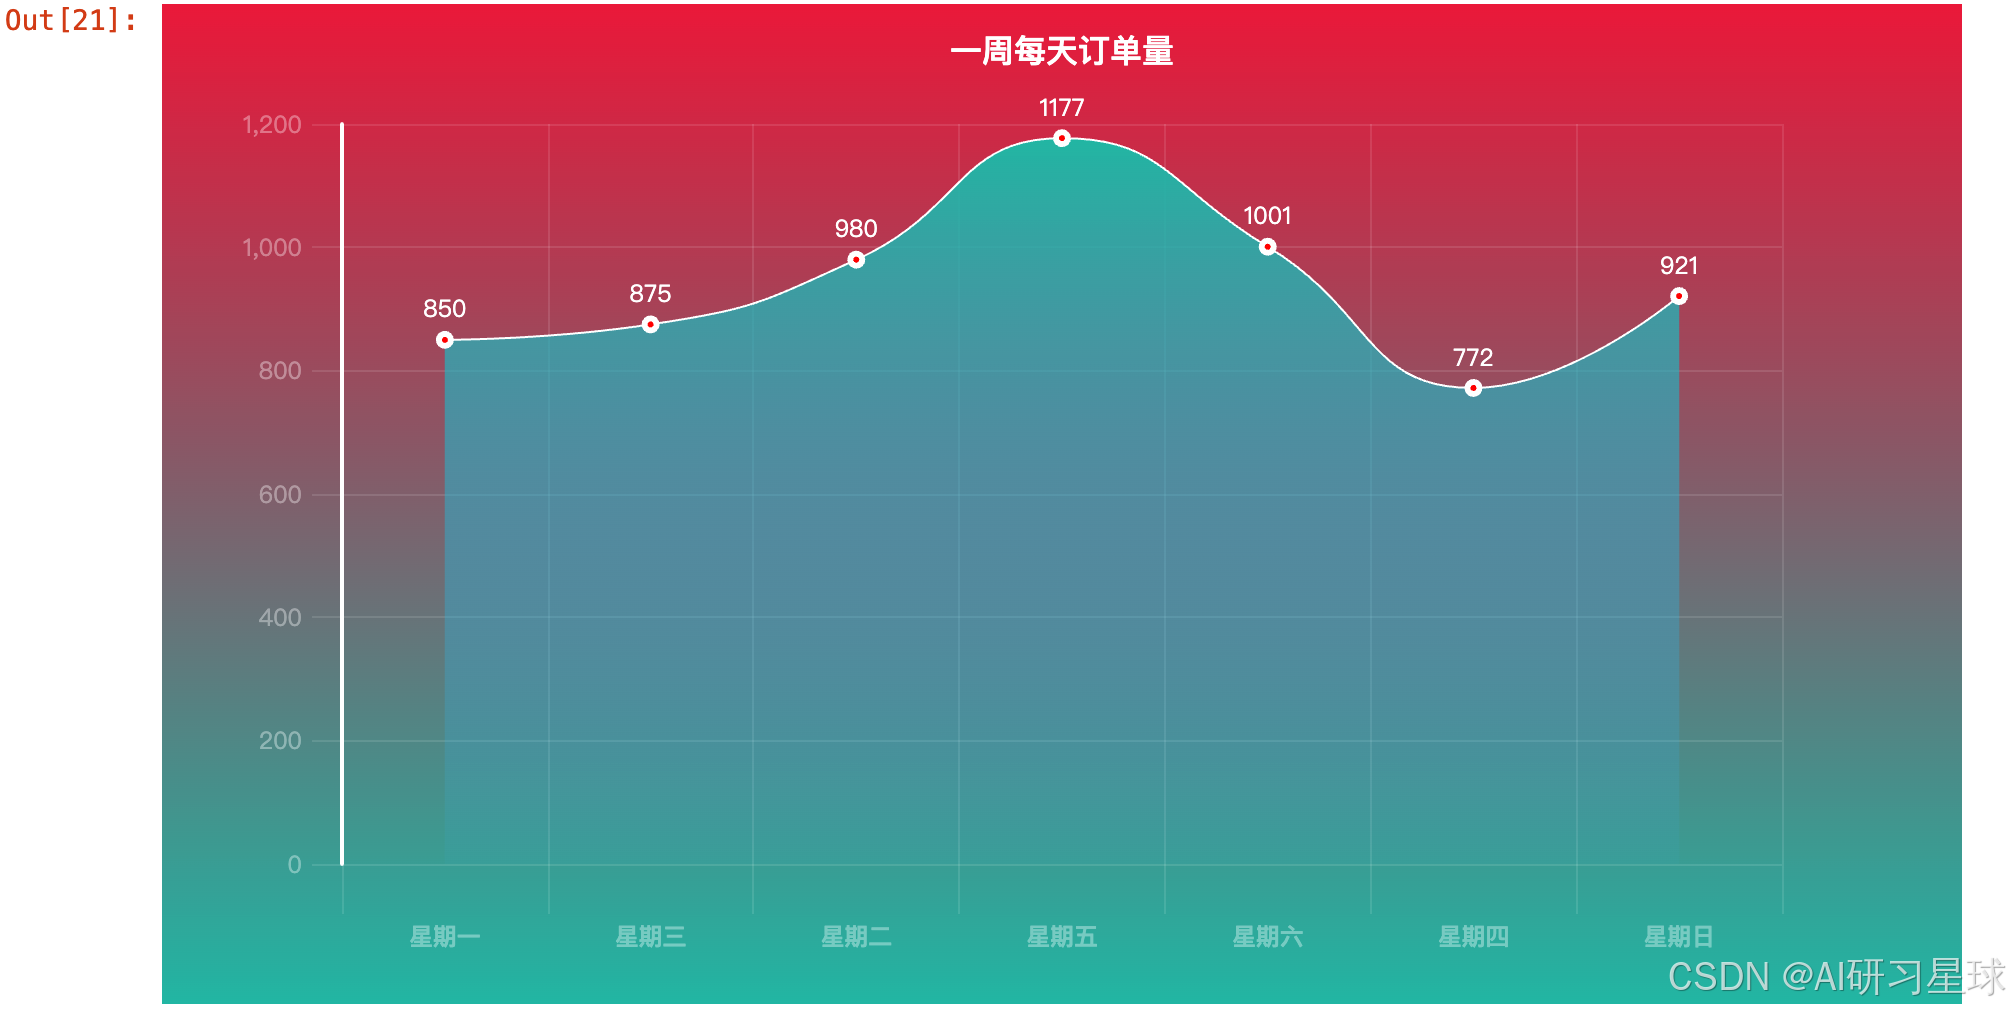
每天销量整体相差不大,周五、周六偏于购药高峰
3.2 药品销量前十柱状图
color_js = """new echarts.graphic.LinearGradient(0, 1, 0, 0,
    [{offset: 0, color: '#FFFFFF'}, {offset: 1, color: '#08519c'}], false)"""

g2 = df3.groupby('商品名称').sum().sort_values(by='销售数量', ascending=False)
x_data = list(g2.index)[:10]
y_data = g2['销售数量'].values.tolist()[:10]
b2 = (
        Bar()
        .add_xaxis(x_data)
        .add_yaxis('',y_data ,itemstyle_opts=opts.ItemStyleOpts(color=JsCode(color_js)))
        .set_global_opts(title_opts=opts.TitleOpts(title='药品销量前十',pos_top='2%',pos_left = 'center'),
            legend_opts=opts.LegendOpts(is_show=False),
            xaxis_opts=opts.AxisOpts(axislabel_opts=opts.LabelOpts(rotate=-15)),
            yaxis_opts=opts.AxisOpts(name="销量",name_location='middle',name_gap=50,name_textstyle_opts=opts.TextStyleOpts(font_size=16)))

    )
b2.render_notebook()
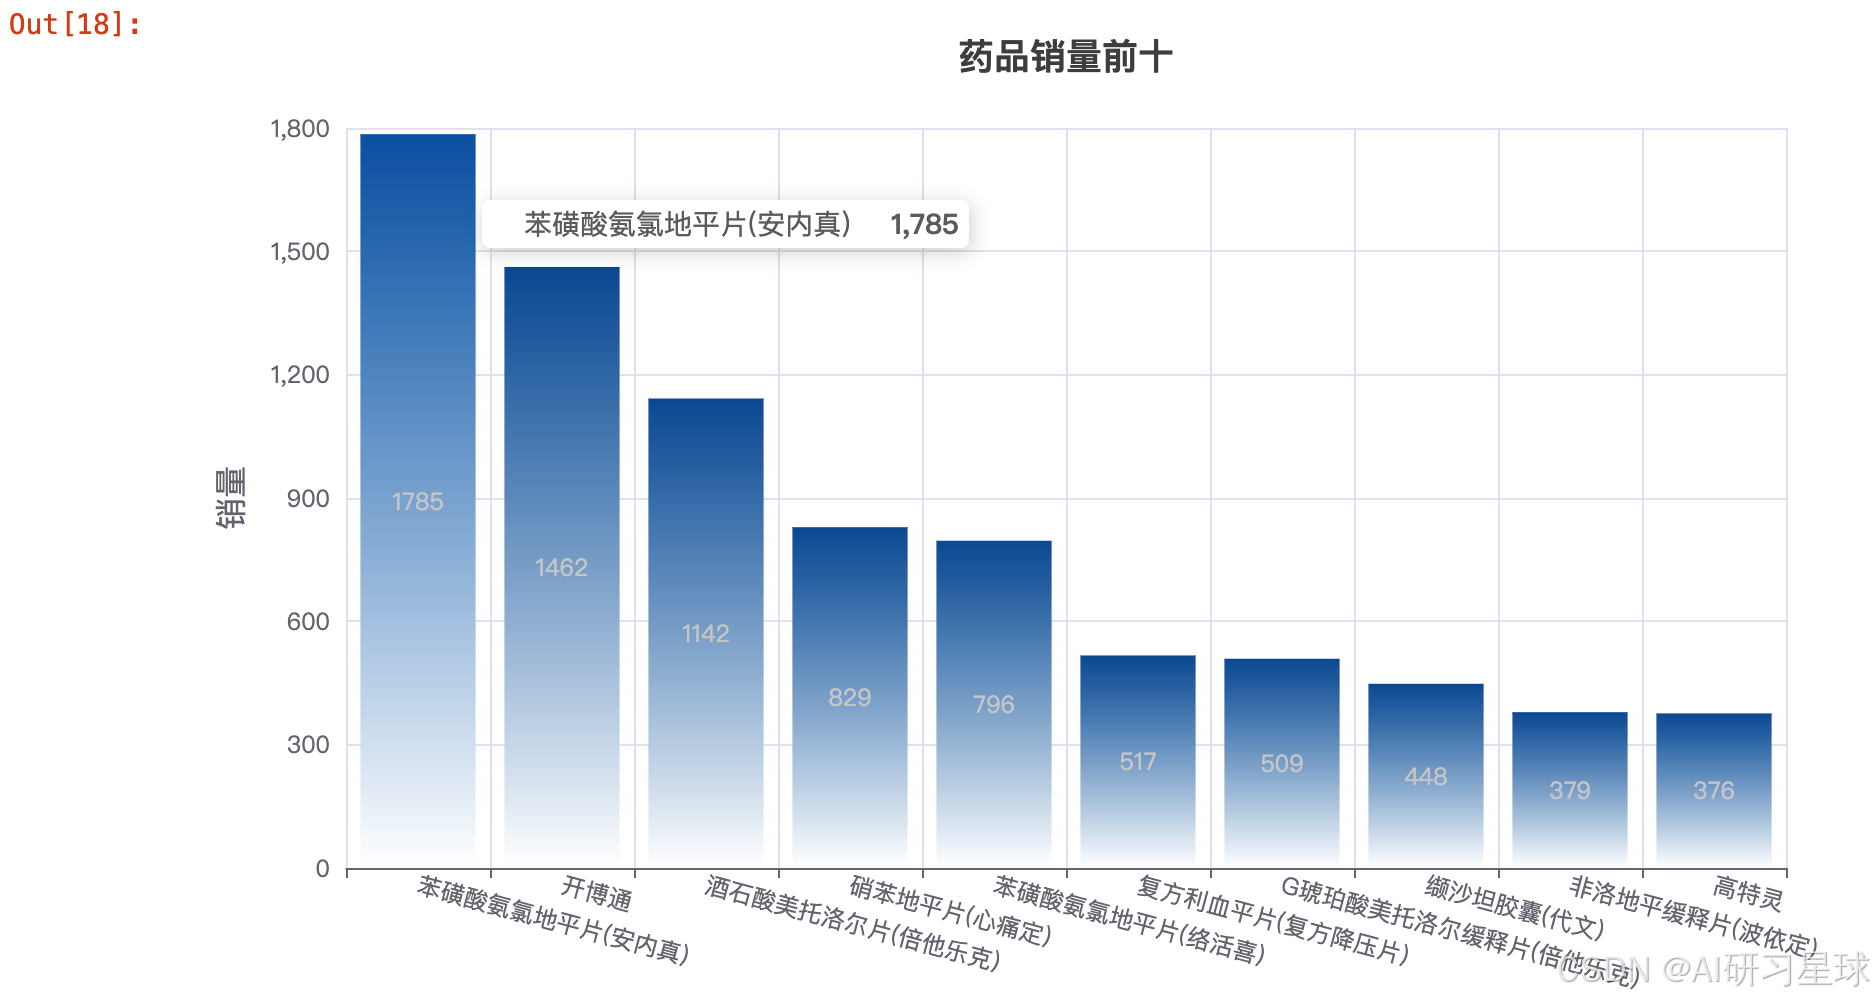
可以看出:苯磺酸氨氯地平片(安内真)、开博通、酒石酸美托洛尔片(倍他乐克)等治疗高血压、心绞痛药物购买量比较多。
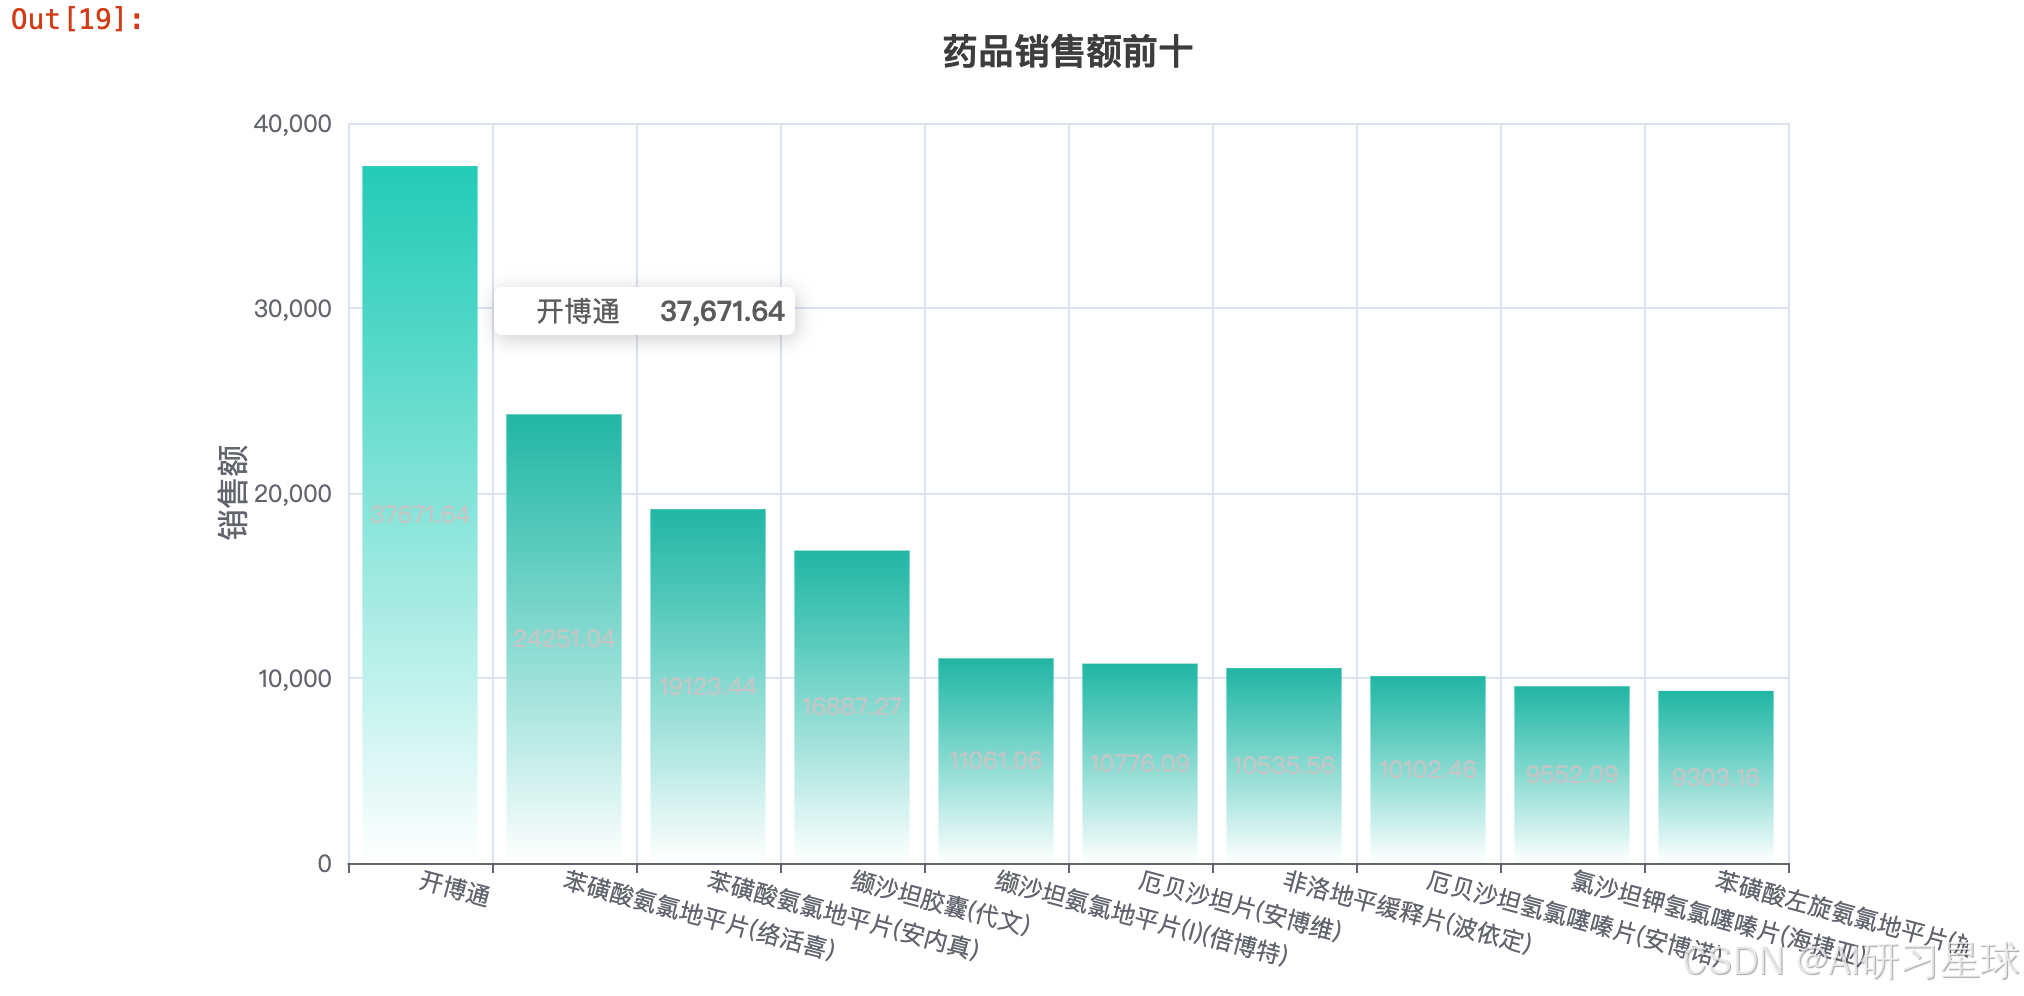
3.3 药品销售额前十柱状图
color_js = """new echarts.graphic.LinearGradient(0, 1, 0, 0,
    [{offset: 0, color: '#FFFFFF'}, {offset: 1, color: '#25BEAD'}], false)"""

g3 = df3.groupby('商品名称').sum().sort_values(by='实收金额', ascending=False)
g3 = g3.round(2)
x_data1 = list(g3.index)[:10]
y_data1 = g3['实收金额'].values.tolist()[:10]
b3 = (
        Bar()
        .add_xaxis(x_data1)
        .add_yaxis('',y_data1 ,itemstyle_opts=opts.ItemStyleOpts(color=JsCode(color_js)))
        .set_global_opts(title_opts=opts.TitleOpts(title='药品销售额前十',pos_top='2%',pos_left = 'center'),
            legend_opts=opts.LegendOpts(is_show=False),
            xaxis_opts=opts.AxisOpts(axislabel_opts=opts.LabelOpts(rotate=-15)),
            yaxis_opts=opts.AxisOpts(name="销售额",name_location='middle',name_gap=50,name_textstyle_opts=opts.TextStyleOpts(font_size=16)))

    )
b3.render_notebook()
3.4 一周每天订单量
color_js = """new echarts.graphic.LinearGradient(0, 1, 0, 0,
    [{offset: 0, color: '#25BEAD'}, {offset: 1, color: '#ed1941'}], false)"""

area_color_js = (
    "new echarts.graphic.LinearGradient(0, 0, 0, 1, "
    "[{offset: 0, color: '#25BEAD'}, {offset: 1, color: '#3fbbff0d'}], false)"
)
df_week = df3.groupby(['星期'])['实收金额'].count()
week_x_data = df_week.index
week_y_data = df_week.values.tolist()

line1 = (
    Line(init_opts=opts.InitOpts(bg_color=JsCode(color_js)))
    .add_xaxis(xaxis_data=week_x_data)
    .add_yaxis(
        series_name="",
        y_axis=week_y_data,
        is_smooth=True,
        is_symbol_show=True,
        symbol="circle",
        symbol_size=6,
        linestyle_opts=opts.LineStyleOpts(color="#fff"),
        label_opts=opts.LabelOpts(is_show=True, position="top", color="white"),
        itemstyle_opts=opts.ItemStyleOpts(
            color="red", border_color="#fff", border_width=3
        ),
        tooltip_opts=opts.TooltipOpts(is_show=False),
        areastyle_opts=opts.AreaStyleOpts(color=JsCode(area_color_js), opacity=1),
    )
    .set_global_opts(
        title_opts=opts.TitleOpts(
            title="一周每天订单量",
            pos_top="2%",
            pos_left="center",
            title_textstyle_opts=opts.TextStyleOpts(color="#fff", font_size=16),
        ),
        xaxis_opts=opts.AxisOpts(
            type_="category",
            boundary_gap=True,
            axislabel_opts=opts.LabelOpts(margin=30, color="#ffffff63",font_weight =900),
            axisline_opts=opts.AxisLineOpts(is_show=False),
            axistick_opts=opts.AxisTickOpts(
                is_show=True,
                length=25,
                linestyle_opts=opts.LineStyleOpts(color="#ffffff1f"),
            ),
            splitline_opts=opts.SplitLineOpts(
                is_show=True, linestyle_opts=opts.LineStyleOpts(color="#ffffff1f")
            ),
        ),
        yaxis_opts=opts.AxisOpts(
            type_="value",
            position="left",
            axislabel_opts=opts.LabelOpts(margin=20, color="#ffffff63"),
            axisline_opts=opts.AxisLineOpts(
                linestyle_opts=opts.LineStyleOpts(width=2, color="#fff")
            ),
            axistick_opts=opts.AxisTickOpts(
                is_show=True,
                length=15,
                linestyle_opts=opts.LineStyleOpts(color="#ffffff1f"),
            ),
            splitline_opts=opts.SplitLineOpts(
                is_show=True, linestyle_opts=opts.LineStyleOpts(color="#ffffff1f")
            ),
        ),
        legend_opts=opts.LegendOpts(is_show=False),
    )
)
line1.render_notebook()
3.5 自然月每天订单数量
linestyle_dic = { 'normal': {
                    'width': 2,
                    'shadowColor': '#696969',
                    'shadowBlur': 10,
                    'shadowOffsetY': 10,
                    'shadowOffsetX': 10,
                    }
                }
df3['购药日期'] = pd.to_datetime(df3['购药日期'])
df_day = df3.groupby(df3['购药日期'].dt.day)['星期'].count()
day_x_data = [str(i) for i in list(df_day.index)]
day_y_data = df_day.values.tolist()
line2 = (
    Line(init_opts=opts.InitOpts(bg_color=JsCode(color_js)))
    .add_xaxis(xaxis_data=day_x_data)
    .add_yaxis(
        series_name="",
        y_axis=day_y_data,
        is_smooth=True,
        is_symbol_show=True,
        symbol="circle",
        symbol_size=6,
        linestyle_opts=opts.LineStyleOpts(color="#fff"),
        label_opts=opts.LabelOpts(is_show=True, position="top", color="white"),
        itemstyle_opts=opts.ItemStyleOpts(
            color="red", border_color="#fff", border_width=3
        ),
        tooltip_opts=opts.TooltipOpts(is_show=False),
        areastyle_opts=opts.AreaStyleOpts(color=JsCode(area_color_js), opacity=1),
    )
    .set_series_opts(
        linestyle_opts=linestyle_dic,label_opts=opts.LabelOpts(font_size=12, color='red' ),
        markpoint_opts=opts.MarkPointOpts(
            data=[opts.MarkPointItem(type_="max",itemstyle_opts=opts.ItemStyleOpts(
            color="#fed976", border_width=3)),
            opts.MarkPointItem(type_="min",itemstyle_opts=opts.ItemStyleOpts(
            color="#fed976", border_width=3))],
            symbol_size=[65, 50],
            label_opts=opts.LabelOpts(position="inside", color="red", font_size=10)
            ),
    )
    .set_global_opts(
        title_opts=opts.TitleOpts(
            title="自然月每日订单量",
            pos_top="2%",
            pos_left="center",
            title_textstyle_opts=opts.TextStyleOpts(color="#fff", font_size=16),
        ),
        xaxis_opts=opts.AxisOpts(
            type_="category",
            boundary_gap=True,
            axislabel_opts=opts.LabelOpts(margin=30, color="#ffffff63",font_weight =900),
            axisline_opts=opts.AxisLineOpts(is_show=False),
            axistick_opts=opts.AxisTickOpts(
                is_show=True,
                length=25,
                linestyle_opts=opts.LineStyleOpts(color="#ffffff1f"),
            ),
            splitline_opts=opts.SplitLineOpts(
                is_show=True, linestyle_opts=opts.LineStyleOpts(color="#ffffff1f")
            ),
        ),
        yaxis_opts=opts.AxisOpts(
            type_="value",
            position="left",
            axislabel_opts=opts.LabelOpts(margin=20, color="#ffffff63"),
            axisline_opts=opts.AxisLineOpts(
                linestyle_opts=opts.LineStyleOpts(width=2, color="#fff")
            ),
            axistick_opts=opts.AxisTickOpts(
                is_show=True,
                length=15,
                linestyle_opts=opts.LineStyleOpts(color="#ffffff1f"),
            ),
            splitline_opts=opts.SplitLineOpts(
                is_show=True, linestyle_opts=opts.LineStyleOpts(color="#ffffff1f")
            ),
        ),
        legend_opts=opts.LegendOpts(is_show=False),
    )
)
line2.render_notebook()
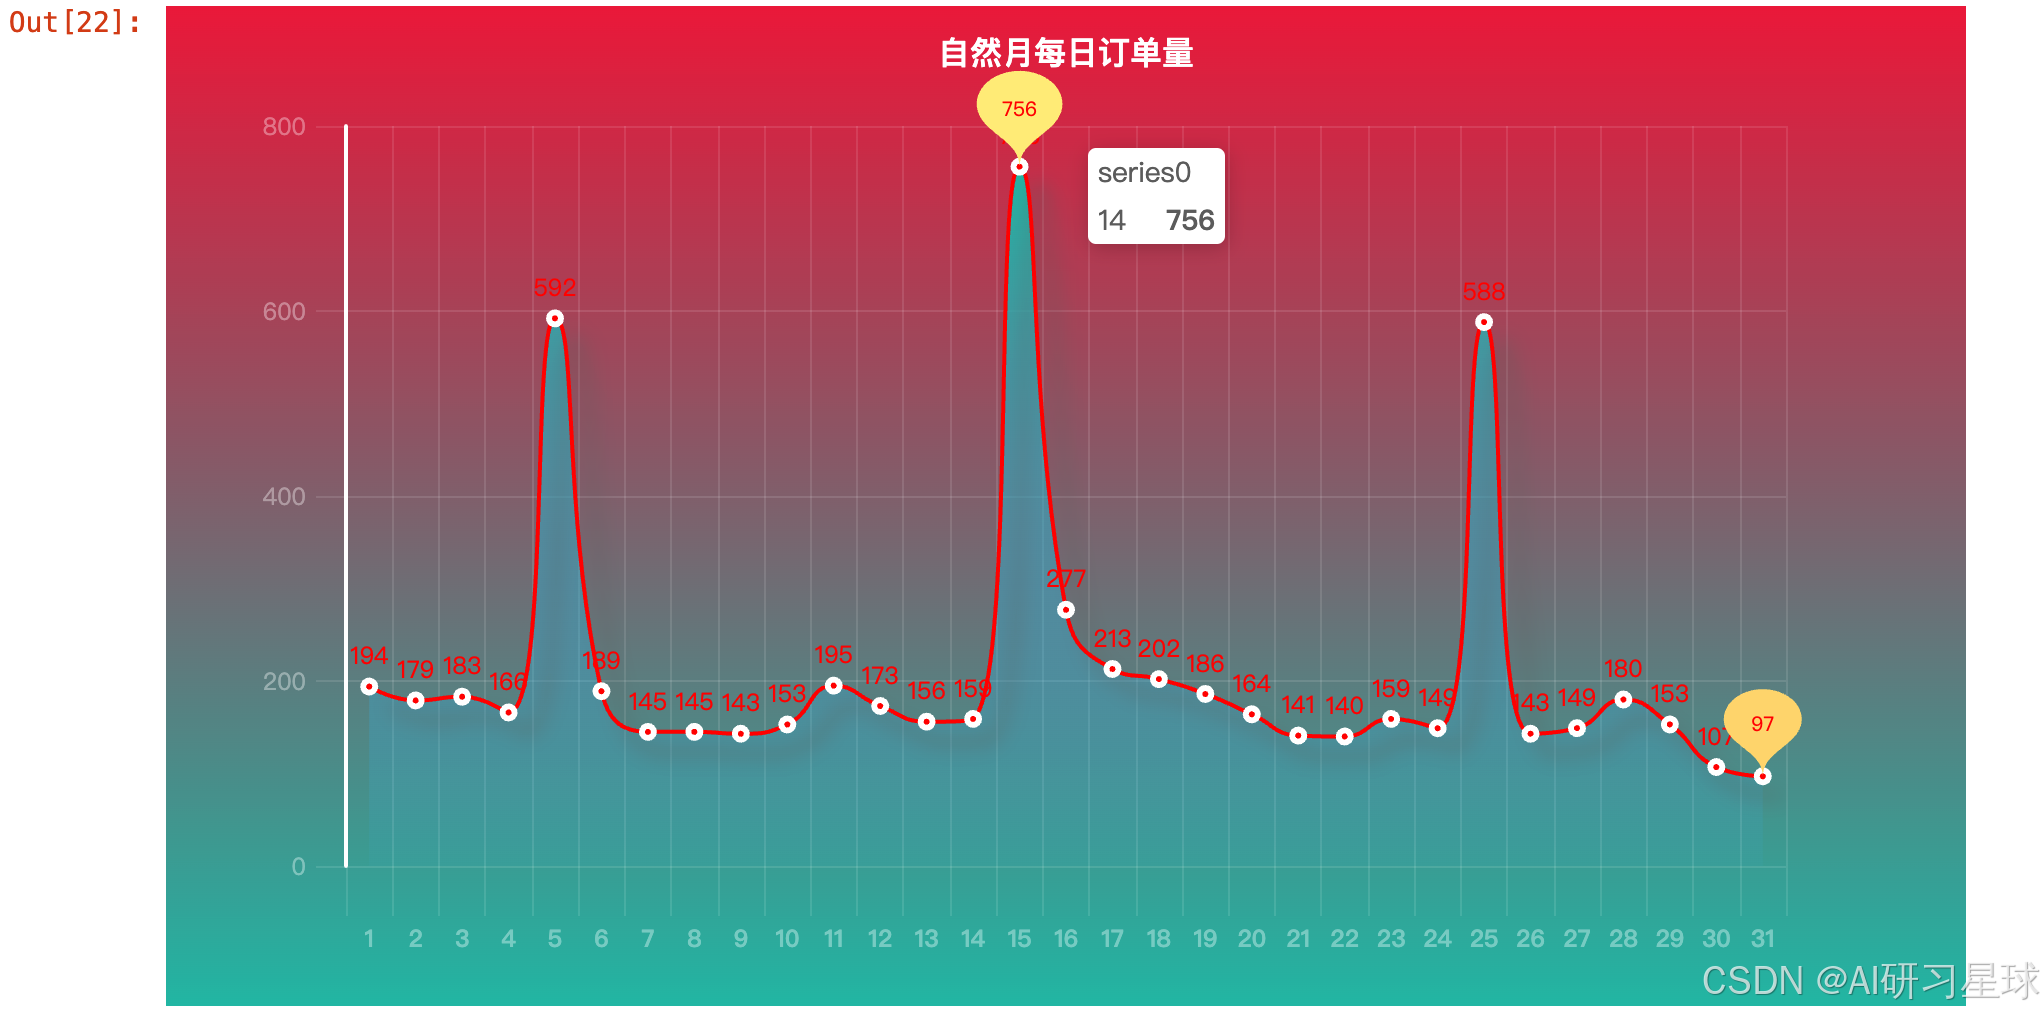
可以看出:5日、15日、25日是药品销售高峰期,尤其是每月15日
3.6 每月订单数量
df_month = df3.groupby(df3['购药日期'].dt.month)['星期'].count()
day_x_data = [str(i)+'月' for i in list(df_month.index)]
day_y_data = df_month.values.tolist()
line3 = (
    Line(init_opts=opts.InitOpts(bg_color=JsCode(color_js)))
    .add_xaxis(xaxis_data=day_x_data)
    .add_yaxis(
        series_name="",
        y_axis=day_y_data,
        is_smooth=True,
        is_symbol_show=True,
        symbol="circle",
        symbol_size=6,
        linestyle_opts=opts.LineStyleOpts(color="#fff"),
        label_opts=opts.LabelOpts(is_show=True, position="top", color="white"),
        itemstyle_opts=opts.ItemStyleOpts(
            color="red", border_color="#fff", border_width=3
        ),
        tooltip_opts=opts.TooltipOpts(is_show=False),
        areastyle_opts=opts.AreaStyleOpts(color=JsCode(area_color_js), opacity=1),
    )
    .set_global_opts(
        title_opts=opts.TitleOpts(
            title="每月订单量",
            pos_top="2%",
            pos_left="center",
            title_textstyle_opts=opts.TextStyleOpts(color="#fff", font_size=16),
        ),
        xaxis_opts=opts.AxisOpts(
            type_="category",
            boundary_gap=True,
            axislabel_opts=opts.LabelOpts(margin=30, color="#ffffff63",font_weight =900),
            axisline_opts=opts.AxisLineOpts(is_show=False),
            axistick_opts=opts.AxisTickOpts(
                is_show=True,
                length=25,
                linestyle_opts=opts.LineStyleOpts(color="#ffffff1f"),
            ),
            splitline_opts=opts.SplitLineOpts(
                is_show=True, linestyle_opts=opts.LineStyleOpts(color="#ffffff1f")
            ),
        ),
        yaxis_opts=opts.AxisOpts(
            type_="value",
            position="left",
            axislabel_opts=opts.LabelOpts(margin=20, color="#ffffff63"),
            axisline_opts=opts.AxisLineOpts(
                linestyle_opts=opts.LineStyleOpts(width=2, color="#fff")
            ),
            axistick_opts=opts.AxisTickOpts(
                is_show=True,
                length=15,
                linestyle_opts=opts.LineStyleOpts(color="#ffffff1f"),
            ),
            splitline_opts=opts.SplitLineOpts(
                is_show=True, linestyle_opts=opts.LineStyleOpts(color="#ffffff1f")
            ),
        ),
        legend_opts=opts.LegendOpts(is_show=False),
    )
)
line3.render_notebook()
1月份和4月份药品销售数据较其他几个月更多
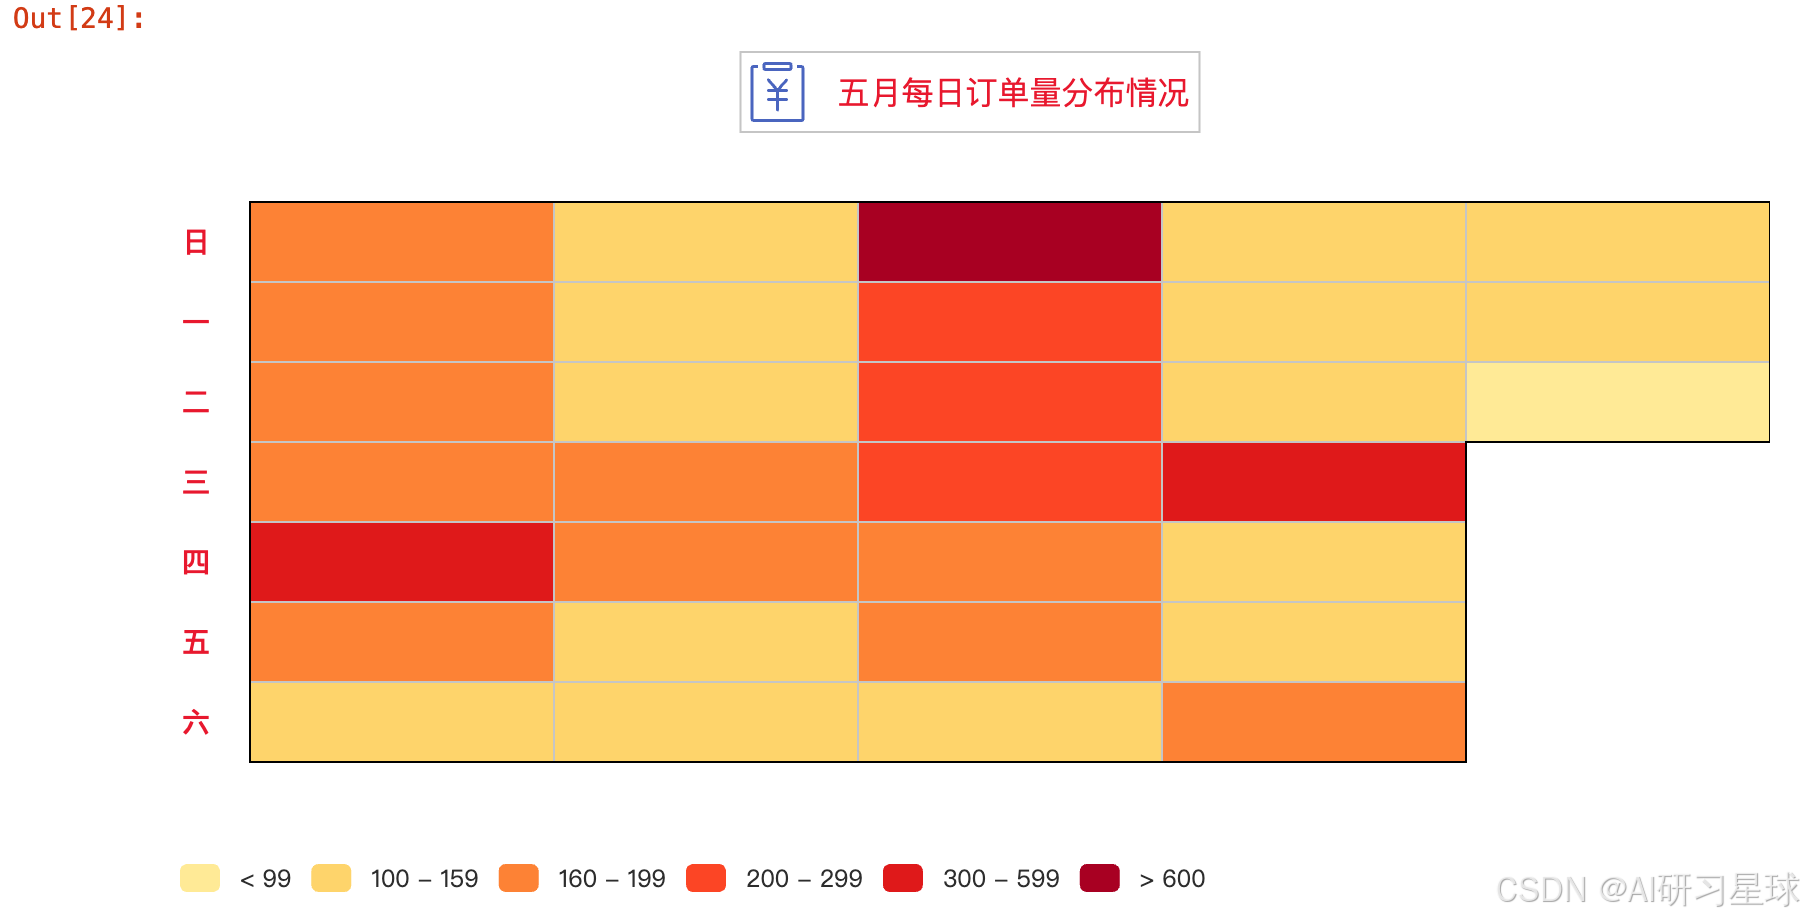
3.7 五月每日订单量
df_day = df3.groupby(df3['购药日期'].dt.day)['星期'].count()
day_x_data = [str(i) for i in list(df_day.index)]
day_y_data = df_day.values.tolist()
times = [x.strftime('%Y-%m-%d') for x in list(pd.date_range('20160501', '20160531'))]
data = [[times[index],day_y_data[index]] for index,item in enumerate( day_y_data)]
Cal = (
    Calendar(init_opts=opts.InitOpts(width="800px", height="500px"))
    .add(
        series_name="五月每日订单量分布情况",
        yaxis_data=data,
        calendar_opts=opts.CalendarOpts(
             pos_top='20%',
             pos_left='5%',
             range_="2016-05",
             cell_size=40,
             daylabel_opts=opts.CalendarDayLabelOpts(name_map="cn",
                                                     margin=20,
                                                     label_font_size=14,
                                                     label_color='#EB1934',
                                                     label_font_weight='bold'
                                                    ),
             monthlabel_opts=opts.CalendarMonthLabelOpts(name_map="cn",
                                                         margin=20,
                                                         label_font_size=14,
                                                         label_color='#EB1934',
                                                         label_font_weight='bold',
                                                         is_show=False
                                                        ),
             yearlabel_opts=opts.CalendarYearLabelOpts(is_show=False),
        ),
        tooltip_opts='{c}',
    )
    .set_global_opts(
        title_opts=opts.TitleOpts(
            pos_top="2%",
            pos_left="center",
            title=""
        ),
        visualmap_opts=opts.VisualMapOpts(
            orient="horizontal",
            max_=800,
            pos_bottom='10%',
            is_piecewise=True,
            pieces=[{"min": 600},
                    {"min": 300, "max": 599},
                    {"min": 200, "max": 299},
                    {"min": 160, "max": 199},
                    {"min": 100, "max": 159},
                    {"max": 99}],
            range_color=['#ffeda0','#fed976','#fd8d3c','#fc4e2a','#e31a1c','#b10026']

        ),
        legend_opts=opts.LegendOpts(is_show=True,
                                    pos_top='5%',
                                    item_width = 50,
                                    item_height = 30,
                                    textstyle_opts=opts.TextStyleOpts(font_size=16,color='#EB1934'),
                                    legend_icon ='path://path://M465.621333 469.333333l-97.813333-114.133333a21.333333 21.333333 0 1 1 32.384-27.733333L512 457.856l111.786667-130.432a21.333333 21.333333 0 1 1 32.426666 27.776L558.357333 469.333333h81.493334c11.84 0 21.461333 9.472 21.461333 21.333334 0 11.776-9.6 21.333333-21.482667 21.333333H533.333333v85.333333h106.517334c11.861333 0 21.482667 9.472 21.482666 21.333334 0 11.776-9.6 21.333333-21.482666 21.333333H533.333333v127.850667c0 11.861333-9.472 21.482667-21.333333 21.482666-11.776 0-21.333333-9.578667-21.333333-21.482666V640h-106.517334A21.354667 21.354667 0 0 1 362.666667 618.666667c0-11.776 9.6-21.333333 21.482666-21.333334H490.666667v-85.333333h-106.517334A21.354667 21.354667 0 0 1 362.666667 490.666667c0-11.776 9.6-21.333333 21.482666-21.333334h81.472zM298.666667 127.957333C298.666667 104.405333 317.824 85.333333 341.12 85.333333h341.76C706.304 85.333333 725.333333 104.490667 725.333333 127.957333v42.752A42.645333 42.645333 0 0 1 682.88 213.333333H341.12C317.696 213.333333 298.666667 194.176 298.666667 170.709333V127.957333zM341.333333 170.666667h341.333334V128H341.333333v42.666667z m-105.173333-42.666667v42.666667H170.752L170.666667 895.893333 853.333333 896V170.773333L789.909333 170.666667V128h63.296C876.842667 128 896 147.072 896 170.773333v725.12C896 919.509333 877.013333 938.666667 853.333333 938.666667H170.666667a42.666667 42.666667 0 0 1-42.666667-42.773334V170.773333C128 147.157333 147.114667 128 170.752 128h65.408z'
                                   ),
    )
)
Cal.render_notebook()
3.8 药品名称词云
g = df3.groupby('商品名称').sum()
drug_list = []
for idx, value in enumerate(list(g.index)):
    drug_list += [value] * list(g['销售数量'].values)[idx]
stylecloud.gen_stylecloud(
    text=' '.join(drug_list),
    font_path=r'/Library/Fonts/Arial Unicode.ttf',
    palette='cartocolors.qualitative.Bold_5',
    max_font_size=200,
    output_name='药品词云1.png',
    )
Image.open("药品词云1.png")

stylecloud.gen_stylecloud(
    text=' '.join(drug_list),
    font_path=r'/Library/Fonts/Arial Unicode.ttf',
    palette='tableau.TrafficLight_9',
    max_font_size=200,
    background_color='black',
    icon_name='fas fa-lock',
    output_name='药品词云2.png',
    )
Image.open("药品词云2.png")

算法学习、4对1辅导、论文辅导、核心期刊
项目的代码和数据下载可以通过公众号滴滴我


 被折叠的 条评论
为什么被折叠?
被折叠的 条评论
为什么被折叠?
 到【灌水乐园】发言


