let option;
option = {
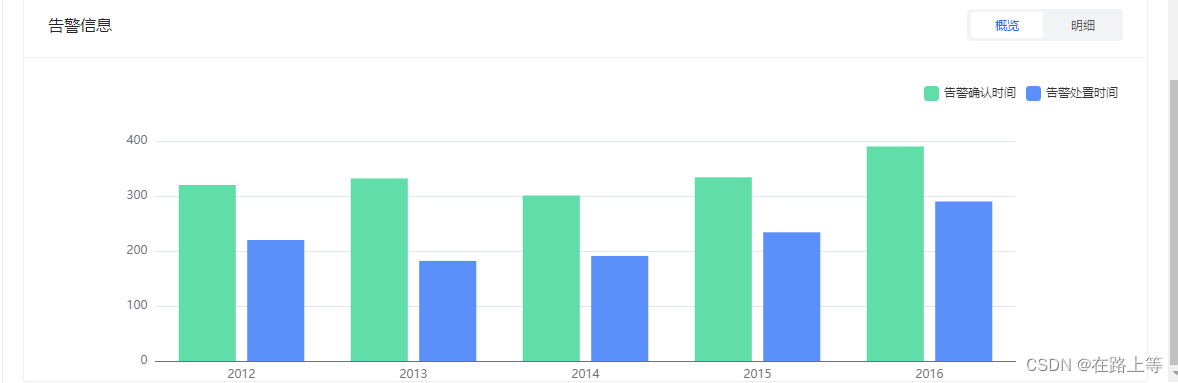
color: ['#61DDAA', '#5B8FF9'],
dataset: {
source: [
['type', '2012', '2013', '2014', '2015', '2016'],
['告警确认时间', 320, 332, 301, 334, 390],
['告警处置时间', 220, 182, 191, 234, 290],
]
},
legend: { // 控制图例组件
right: 'left',
itemWidth: 15,
itemHeight: 15
},
xAxis: {
type: 'category',
axisTick: {
show: false
}
},
yAxis: {},
series: [
{
type: 'bar',
seriesLayoutBy: 'row',
itemStyle: {
barWidth: 20 // 设置柱子宽度为30
}
},
{
type: 'bar',
seriesLayoutBy: 'row',
itemStyle: {
barWidth: 20 // 设置柱子宽度为30
}
},
]
};
option && myChart.setOption(option);


 被折叠的 条评论
为什么被折叠?
被折叠的 条评论
为什么被折叠?
 到【灌水乐园】发言


