


 本文介绍如何在Vue项目中集成ECharts实现数据可视化。通过npm安装ECharts包,然后在main.js中引入,并创建组件定义图表配置。文章还提供了完整的组件代码示例。
一、在工程目录下,使用npm安装echarts包
npm install echarts -s
二、在main.js中引入echarts
import echarts from 'echarts'
三、新建一个组件文件,在组件的methods中添加echarts的配置信息
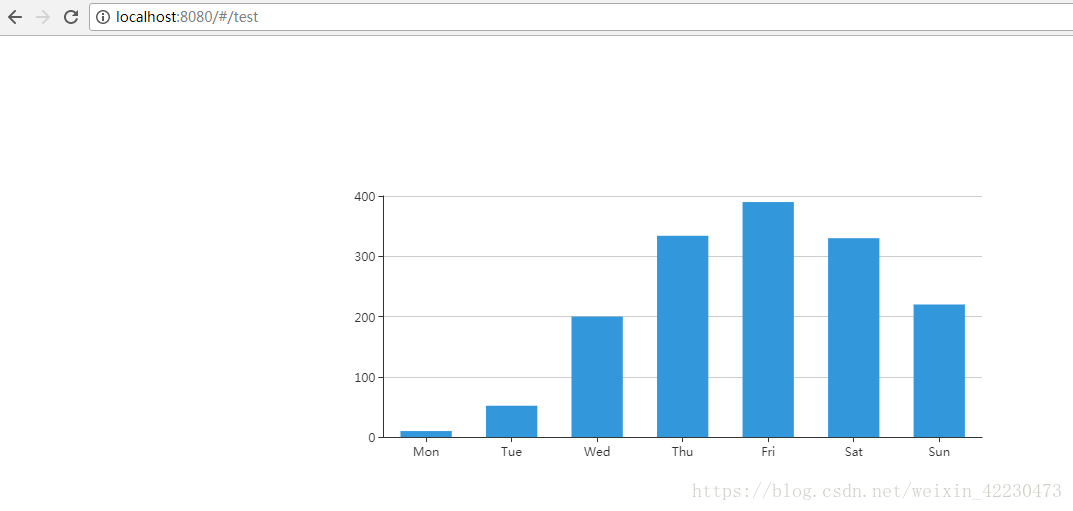
<template>
        <div id="chart"></div>
</template>
<script>
    export default {
        name: 'BarTest',
        data () {
            return {}
        },
        methods:{
            drawBar(id){
                this.mybar = this.$echarts.init(document.getElementById('chart'))
                this.mybar.showLoading();
                var option = {
                        color: ['#3398DB'],
                        tooltip : {
                            trigger: 'axis',
                            axisPointer : {            // 坐标轴指示器,坐标轴触发有效
                                type : 'shadow'        // 默认为直线,可选为:'line' | 'shadow'
                            }
                        },
                        grid: {
                            left: '3%',
                            right: '4%',
                            bottom: '3%',
                            containLabel: true
                        },
                        xAxis : [
                            {
                                type : 'category',
                                data : ['Mon', 'Tue', 'Wed', 'Thu', 'Fri', 'Sat', 'Sun'],
                                axisTick: {
                                    alignWithLabel: true
                                }
                            }
                        ],
                        yAxis : [
                            {
                                type : 'value'
                            }
                        ],
                        series : [
                            {
                                name:'直接访问',
                                type:'bar',
                                barWidth: '60%',
                                data:[10, 52, 200, 334, 390, 330, 220]
                            }
                        ]
                };
                this.mybar.setOption(option);
                this.mybar.hideLoading();
            },
        },

        created: function () {
        },

        //所有视图都加载后,再调用图表方法
        mounted(){
            this.$nextTick(function() {
              var _this=this;
              _this.drawBar();
            })
        }
    }
</script>
<style scoped>
    * {
        margin: 0;
        padding: 0;
        list-style: none;
    }

    #chart{
        width: 50%;
        height: 50%;
        margin: 100px auto;
    }
</style>
四、此处使用了vue的路由,配置路由后,打开浏览器即可看到效果


 1450
1450

 被折叠的 条评论
为什么被折叠?
被折叠的 条评论
为什么被折叠?
 到【灌水乐园】发言


