


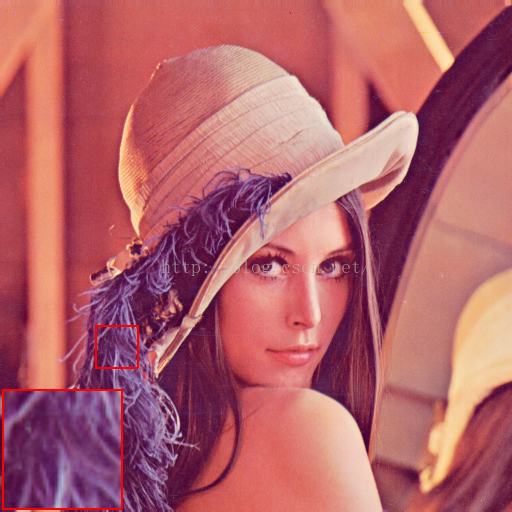
 本文介绍了一种图像处理方法,能够实现图像中特定区域的放大显示,并在原图上标记放大区域的位置。通过调整参数,可以控制放大倍数、边框宽度及放大区域的位置。
function I_rgb = ShowEnlargedRectangle(I, LeftUpPoint, RightBottomPoint, Enlargement_Factor, LineWidth, gap)
% example  I_rgb = ShowEnlargedRectangle(I, [10,20], [50,60], 1.5, 1)

if size(I,3)==1
    I_rgb(:,:,1) = I;
    I_rgb(:,:,2) = I;
    I_rgb(:,:,3) = I;
else
    I_rgb = I;
end

if ~exist('LineWidth','var')
    LineWidth = 1;
end

if ~exist('Enlargement_Factor','var')
    Enlargement_Factor = 1.5;
end

if ~exist('gap','var') %离左下方距离
    gap = 1;
end

%% 画矩形
I_rgb = DrawRectangle(I_rgb, LeftUpPoint, RightBottomPoint, LineWidth);

%% 提取矩形区域内图像
UpRow = LeftUpPoint(1);
LeftColumn = LeftUpPoint(2);
BottomRow = RightBottomPoint(1);
RightColumn = RightBottomPoint(2);

for i = 1 : size(I_rgb,3)
    Patch(:,:,i) = I_rgb(UpRow + LineWidth:BottomRow  - LineWidth,LeftColumn  + LineWidth:RightColumn  - LineWidth,i);
end

%% 对提取到的区域进行放大
% Enlargement_Factor = 0.5;
Interpolation_Method = 'bilinear'; %bilinear,bicubic
Enlarged = imresize(Patch,Enlargement_Factor,Interpolation_Method);

%% 对放大的区域进行显示
[m, n, c] = size(Enlarged);
[row, ~, ~] = size(I_rgb);
% EnlargedShowStartRow = row - 1 - LineWidth;
% EnlargedShowStartColumn = 2 + LineWidth;
% for j = 1 : c
%     I_rgb(EnlargedShowStartRow - m + 1:EnlargedShowStartRow,EnlargedShowStartColumn:EnlargedShowStartColumn + n - 1,j) = Enlarged(:,:,j);
% end
EnlargedShowStartRow = row - gap - LineWidth;
EnlargedShowStartColumn = 1 + gap + LineWidth;
for j = 1 : c
    I_rgb(EnlargedShowStartRow - m + 1:EnlargedShowStartRow,EnlargedShowStartColumn:EnlargedShowStartColumn + n - 1,j) = Enlarged(:,:,j);
end

%% 对放大显示后的区域画矩形
Point1 = [EnlargedShowStartRow - m + 1 - LineWidth,EnlargedShowStartColumn - LineWidth];
Point2 = [EnlargedShowStartRow + 1,EnlargedShowStartColumn + n -1 + 1];
I_rgb = DrawRectangle(I_rgb, Point1, Point2, LineWidth);

end
function I_rgb = DrawRectangle(I, LeftUpPoint, RightBottomPoint,LineWidth)
% example  I_rgb = ShowEnlargedRectangle(I, [10,20], [50,60], 1)

if size(I,3)==1
    I_rgb(:,:,1) = I;
    I_rgb(:,:,2) = I;
    I_rgb(:,:,3) = I;
else
    I_rgb = I;
end

if ~exist('LineWidth','var')
    LineWidth = 1;
end

UpRow = LeftUpPoint(1);
LeftColumn = LeftUpPoint(2);
BottomRow = RightBottomPoint(1);
RightColumn = RightBottomPoint(2);

% 上面线
I_rgb(UpRow:UpRow + LineWidth - 1,LeftColumn:RightColumn,1) = 255;
I_rgb(UpRow:UpRow + LineWidth - 1,LeftColumn:RightColumn,2) = 0;
I_rgb(UpRow:UpRow + LineWidth - 1,LeftColumn:RightColumn,3) = 0;
% 下面线
I_rgb(BottomRow:BottomRow + LineWidth - 1,LeftColumn:RightColumn,1) = 255;
I_rgb(BottomRow:BottomRow + LineWidth - 1,LeftColumn:RightColumn,2) = 0;
I_rgb(BottomRow:BottomRow + LineWidth - 1,LeftColumn:RightColumn,3) = 0;
% 左面线
I_rgb(UpRow:BottomRow,LeftColumn:LeftColumn + LineWidth - 1,1) = 255;
I_rgb(UpRow:BottomRow,LeftColumn:LeftColumn + LineWidth - 1,2) = 0;
I_rgb(UpRow:BottomRow,LeftColumn:LeftColumn + LineWidth - 1,3) = 0;
% 右面线
I_rgb(UpRow:BottomRow,RightColumn:RightColumn + LineWidth - 1,1) = 255;
I_rgb(UpRow:BottomRow,RightColumn:RightColumn + LineWidth - 1,2) = 0;
I_rgb(UpRow:BottomRow,RightColumn:RightColumn + LineWidth - 1,3) = 0;

end
Demo:
clear

I = imread('lena.png');

I1 = ShowEnlargedRectangle(I,[326,96],[368,138],3,2,2);
% figure;imshow(I);
figure;imshow(I1);</span>


 2452
2452

 被折叠的 条评论
为什么被折叠?
被折叠的 条评论
为什么被折叠?
 到【灌水乐园】发言


