


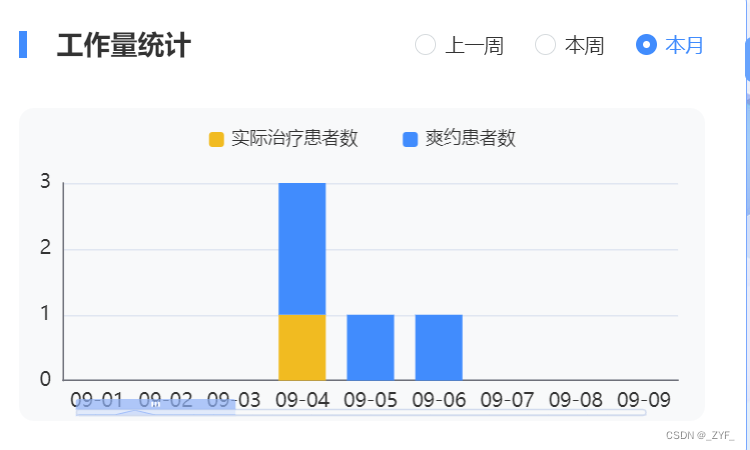
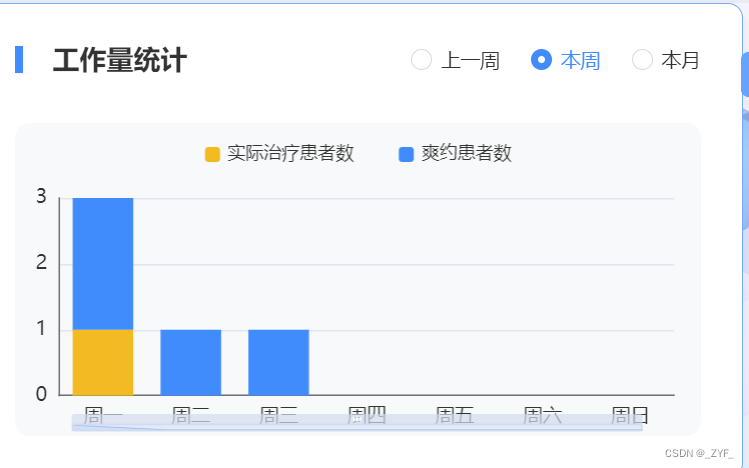
1.当柱状图x轴数据项过多时,无法很好的显示,可以通过加滚动条来实现较好的使用体验
如图:
添加代码:
//滚动条样式
              dataZoom:[{
                type: "slider",
                show:true,
                xAxisIndex: 0,
                bottom: 10,
                left: 35,
                right: 42,
                start: 25,
                end: 0,
                height: 5,
                handleSize:'0px',
                handleStyle:{
                  color: "#3AAAF0",
                  borderColor: "#007acc",
                },
              }],
可以通过start属性控制初始展示数据项的比例
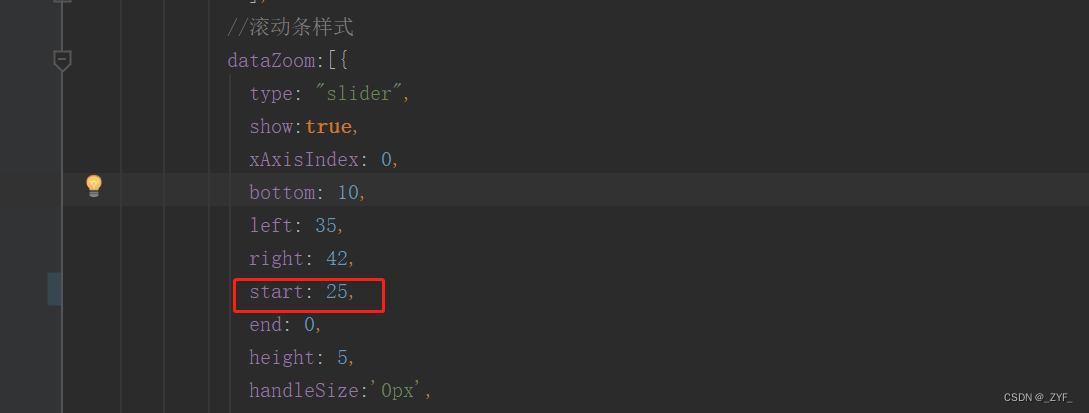
若start的值为100,则全部显示
柱状图完整代码:
// 工作量柱状图
            optionWorkload: {
                tooltip: {
                    trigger: 'axis',
                    axisPointer: {
                        type: 'shadow'
                    }
                },
                legend: {},
                grid: {
                    left: '3%',
                    right: '4%',
                    bottom: '3%',
                    containLabel: true
                },
                xAxis: [
                    {
                        type: 'category',
                        axisLabel: {
                            interval: 0,
                            // rotate: 45
                        },
                        data: []
                    }
                ],
              //滚动条样式
              dataZoom:[{
                type: "slider",
                show:true,
                xAxisIndex: 0,
                bottom: 10,
                left: 35,
                right: 42,
                start: 25,
                end: 0,
                height: 5,
                handleSize:'0px',
                handleStyle:{
                  color: "#3AAAF0",
                  borderColor: "#007acc",
                },
              }],
              yAxis: [
                    {
                        type: 'value',
                        minInterval: 1,
                    }
                ],
                series: [
                    {
                        name: '实际治疗患者数',
                        type: 'bar',
                        stack: 'Ad',
                        emphasis: {
                            focus: 'series'
                        },
                        data: []
                    },
                    {
                        name: '爽约患者数',
                        type: 'bar',
                        stack: 'Ad',
                        emphasis: {
                            focus: 'series'
                        },
                        data: []
                    }
                ]
            },
2.echarts图形无数据时,实现不显示动画,显示【暂无数据】文字
添加代码:
 graphic: [{
                  type: 'text',
                  left: 'center',
                  top: 'middle',
                  invisible: optionClassifyData.length != 0,
                  style: {
                    text: '暂无数据',
                    textAlign: 'center',
                    fontSize: 14,
                    fill: '#909399',
                  },
                }],
如图:
完整代码:
 optionClassify() {
            const { optionClassifyData, optionClassifyTotal, optionClassifyLegend, optionClassifyRadius } = this;
            return {
                color: ['#F1BB21', '#419CEF', '#3F83E8', '#1EB3FF', '#73c0de', '#00BABA', '#00CBA7', '#C7E316'],
                tooltip: {
                    trigger: 'item'
                },
                graphic: [{
                  type: 'text',
                  left: 'center',
                  top: 'middle',
                  invisible: optionClassifyData.length != 0,
                  style: {
                    text: '暂无数据',
                    textAlign: 'center',
                    fontSize: 14,
                    fill: '#909399',
                  },
                }],
                legend: {
                    show: optionClassifyLegend,
                    top: '3%',
                    left: '55%',
                    orient: 'vertical',
                    top: 'middle',
                    itemGap: 9,
                    formatter: (name) => {
                        const item = optionClassifyData.filter(item => item.name === name)
                        return item[0] ? item[0].name + '    ' + (item[0].value / optionClassifyTotal * 100).toFixed(2) + '%' : ''
                    }
                },
                series: [
                    {
                        name: '订单占比',
                        type: 'pie',
                        center: ['25%', '50%'],
                        radius: optionClassifyRadius,
                        label: {
                            show: false
                        },
                        labelLine: {
                            show: false
                        },
                        data: optionClassifyData
                    }
                ]
            }
        },


 被折叠的 条评论
为什么被折叠?
被折叠的 条评论
为什么被折叠?
 到【灌水乐园】发言


