


首先是安装和引用pptxgenjs 这里不再赘述。目前我使用的版本是 “pptxgenjs”: “^3.12.0”,官方链接pptxgenjs官方文档里面由大量的样例可以参考。
官方文档的主要解决的是导出的问题,除此之外往往实际业务中渲染和导出要同步进行,这个组件就是为了解决渲染和导出同步的问题。
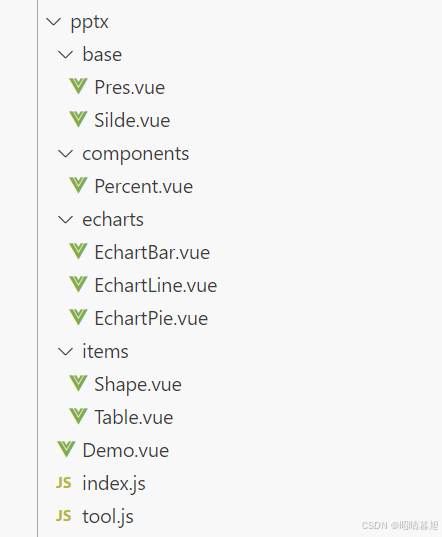
组件简介
PptPres:ppt文件的主体,导出方法挡在这个文件中
PptSilde:单张幻灯片
组件
PptShape:方块元素、带文字的方块元素(没有使用官方的文字元素,文字元素可以用方块代替)
PptTable:表格元素
// Echarts图表(目前只使用到这几个图标其他的未封装)
PptEchartBar:柱状图
PptEchartLine: 折线图
PptEchartPie:饼图图
// 组件
PptCompPercent, // 进度条
使用逻辑
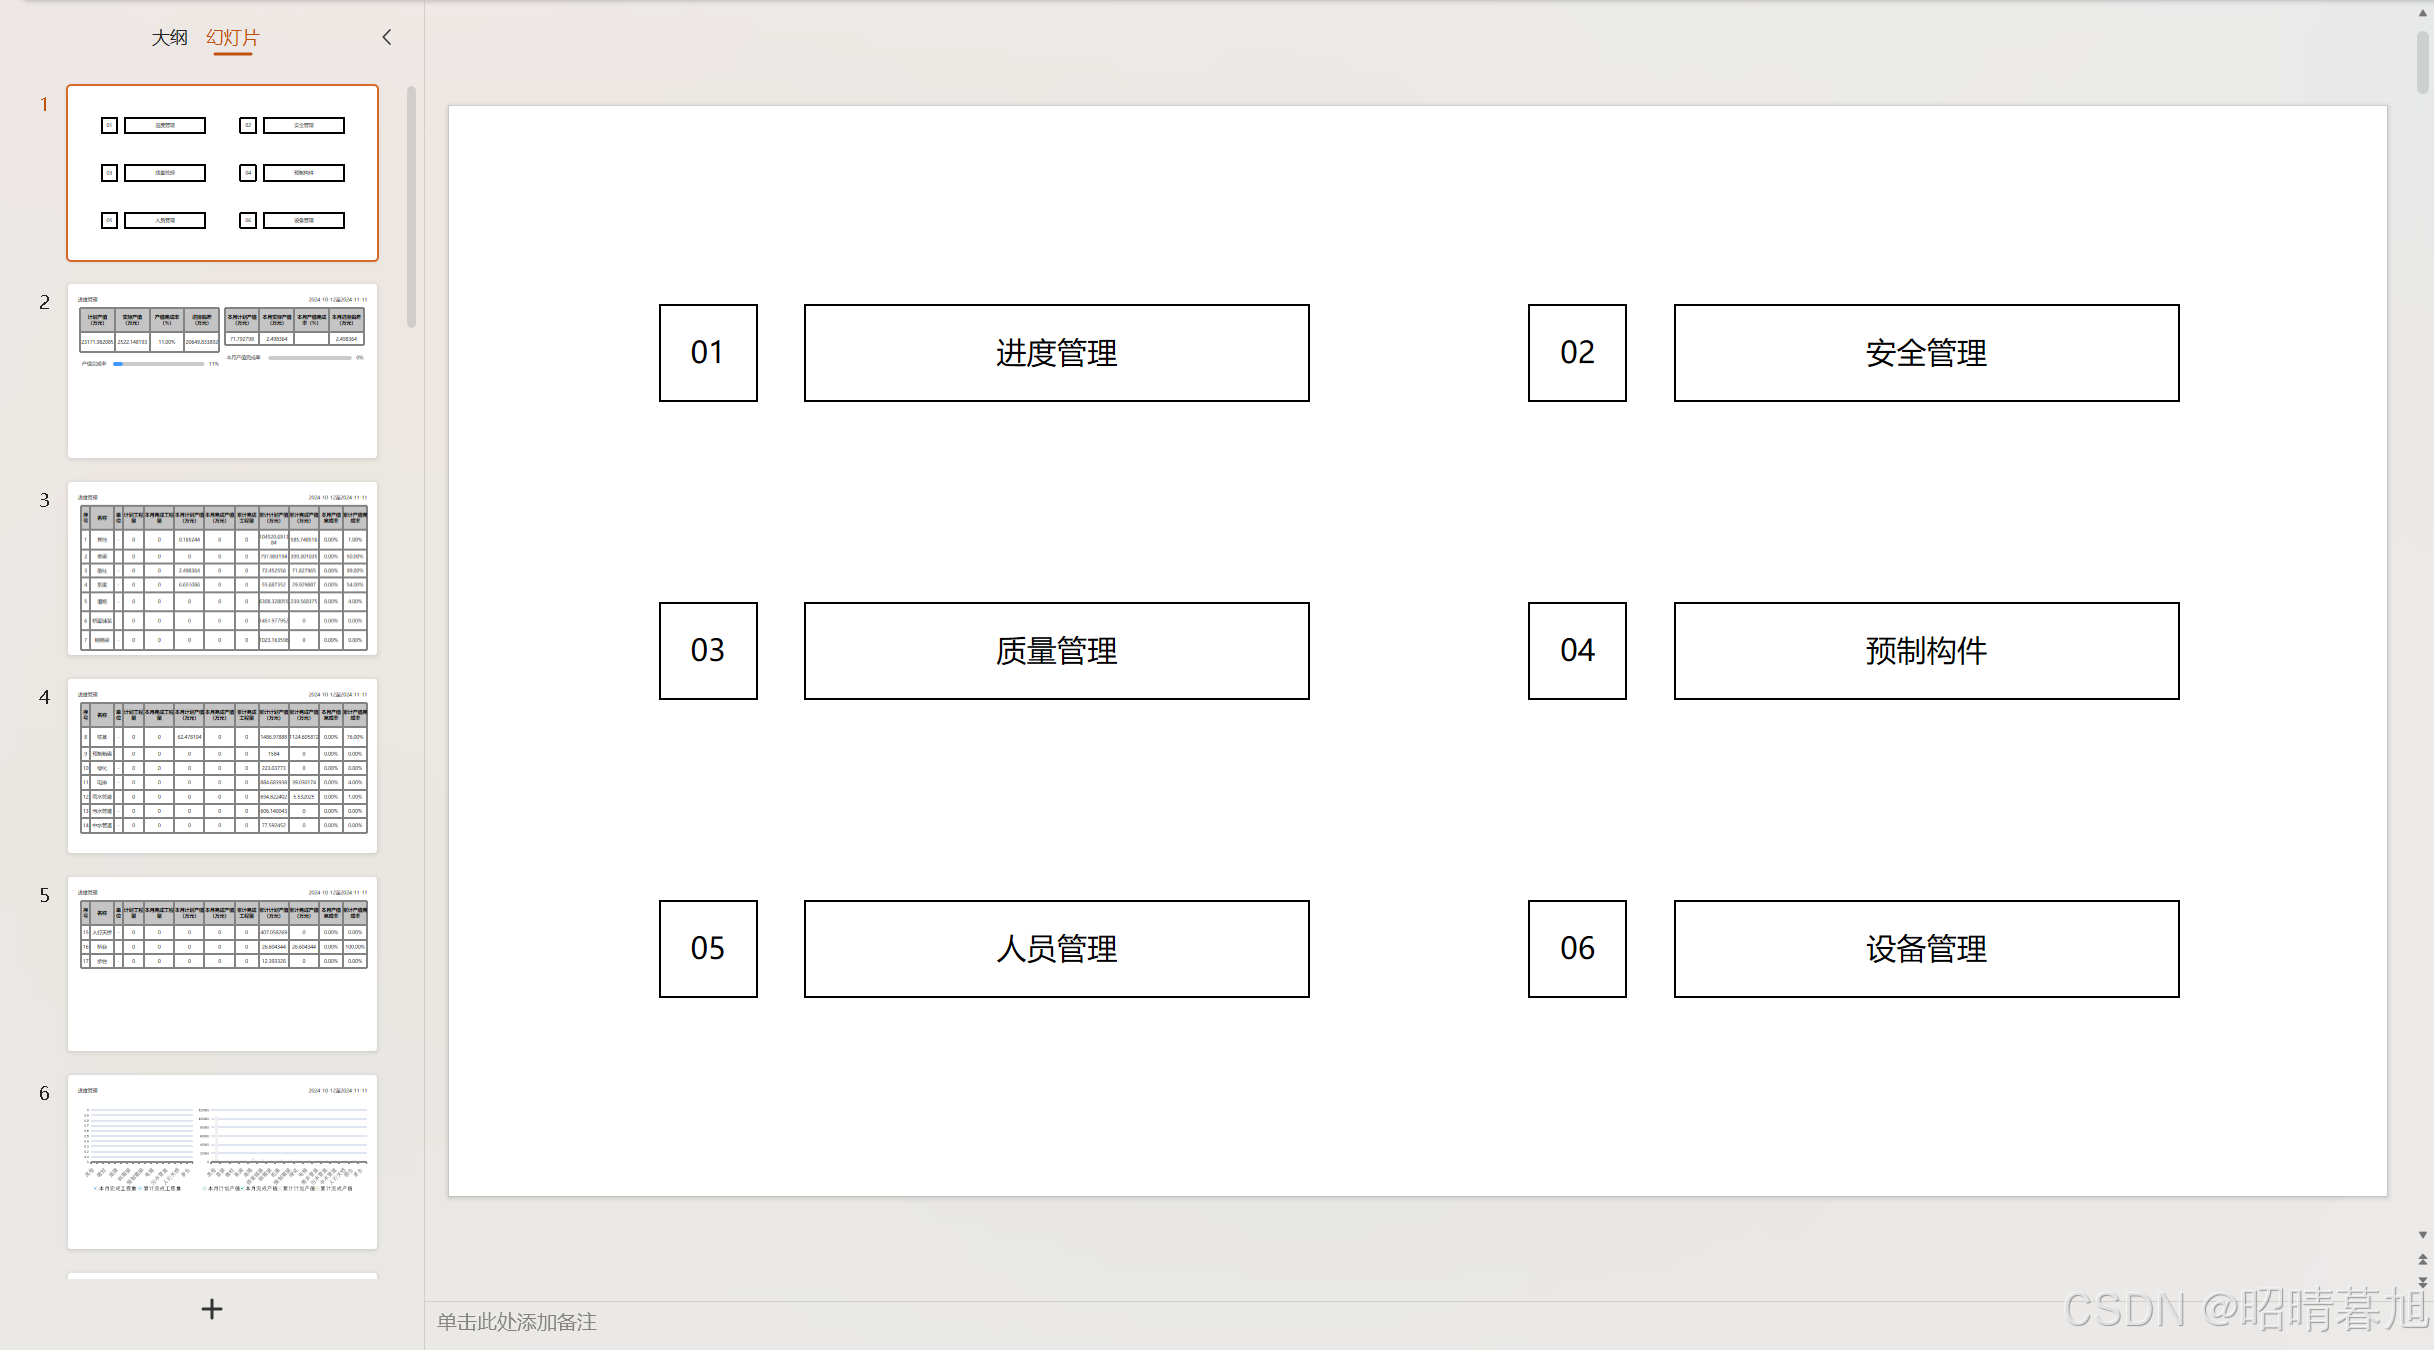
使用封装的组件渲染页面,然后使用PptPres的导出方法会自动根据组件的内容进行导出,可以使用任意css布局进行元素之间的布局,最终导出的时候是采用元素与PptSilde的相对位置进行导出的。
这里提供一个较为完整的样例
<template>
<PptPres ref="ppt">
<a name="ppt首页"></a>
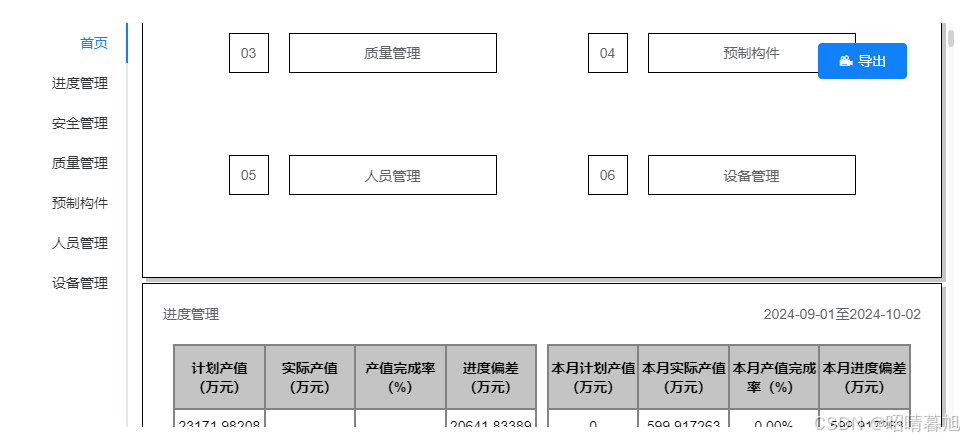
<PptSilde class="customizeReport" style="align-content: normal; padding: 40px">
<div class="flex justify-center items-center" style="flex-basis: 50%" v-for="(it, i) in menuList" :key="i">
<PptShape class="border w-40 h-40 mr-20">0{
{ i + 1 }}</PptShape>
<PptShape class="border w-208 h-40">{
{ dict.label["1611302"][it] }}</PptShape>
</div>
</PptSilde>
<template v-if="menuListOptions['161130201']">
<a name="ppt161130201"></a>
<PptSilde class="customizeReport">
<div class="flex justify-between h-40" style="flex-basis: 100%">
<PptShape class="text-left w-150">进度管理</PptShape>
<PptShape class="text-right w-240">{
{ startDate }}至{
{ endDate }}</PptShape>
</div>
<div style="flex-basis: 48%; height: 105px">
<PptTable
:cloumns="[
{title: `计划产值<br/>(万元)`, width: '25%', dataIndex: 'planValue'},
{title: `实际产值<br/>(万元)`, width: '25%', dataIndex: 'actualValue'},
{title: `产值完成率<br/>(%)`, width: '25%', dataIndex: 'completePercentage'},
{title: `进度偏差<br/>(万元)`, width: '25%', dataIndex: 'deviationValue'},
]"
:data="[pptDate['161130201'].ebsReport]"
/>
<PptCompPercent v-if="pptDate['161130201'].ebsReport" style="margin-top: 20px" pre="产值完成率" :percent="pptDate['161130201'].ebsReport.completePercentage" />
</div>
<div style="flex-basis: 48%; height: 105px; margin-left: 10px">
<PptTable
:cloumns="[
{title: `${typeName}计划产值<br/>(万元)`, width: '25%', dataIndex: 'weekPlanValue'},
{title: `${typeName}实际产值<br/>(万元)`, width: '25%', dataIndex: 'weekActualValue'},
{title: `${typeName}产值完成<br/>率(%)`, width: '25%', dataIndex: 'weekCompletePercentage'},
{title: `${typeName}进度偏差<br/>(万元)`, width: '25%', dataIndex: 'weekDeviationValue'},
]"
:data="[pptDate['161130201'].ebsReport]"
/>
<PptCompPercent style="margin-top: 20px" :pre="`${typeName}产值完成率`" :percent="pptDate['161130201'].ebsReport.weekCompletePercentage" />
</div>
</PptSilde>
<ArraySplit :data="pptDate['161130201'].ebsReportByType" :splitSize="7">
<template v-slot="{data, startIndex}">
<PptSilde class="customizeReport">
<div class="flex justify-between h-40" style="flex-basis: 100%">
<PptShape class="text-left w-150">进度管理</PptShape>
<PptShape class="text-right w-240">{
{ startDate }}至{
{ endDate }}</PptShape>
</div>
<div style="flex-basis: 98%; height: 105px; margin-left: 10px">
<PptTable
:cloumns="[
{title: `序号`, width: '3%', dataIndex: (t, i) => startIndex + i + 1},
{title: `名称`, width: '8%', dataIndex: 'type'},
{title: `单位`, width: '3%', dataIndex: 'unit'},
{title: `${typeName}计划工程量`, width: '7%', dataIndex: 'weekPlanQuantity'},
{title: `${typeName}完成工程量`, width: '10%', dataIndex: 'weekQuantity'},
{title: `${typeName}计划产值(万元)`, width: '10%', dataIndex: 'weekPlanValue'},
{title: `${typeName}完成产值(万元)`, width: '10%', dataIndex: 'weekActualValue'},
{title: `累计完成工程量`, width: '8%', dataIndex: 'totalQuantity'},
{title: `累计计划产值(万元)`, width: '10%', dataIndex: 'totalPlanValue'},
{title: `累计完成产值(万元)`, width: '10%', dataIndex: 'totalActualValue'},
{title: `${typeName}产值完成率`, width: '8%', dataIndex: 'weekCompletePercentage'},
{title: `累计产值完成率`, width: '8%', dataIndex: 'totalCompletePercentage'},
]"
:data="data"
/>
</div>
</PptSilde>
</template>
</ArraySplit>
<PptSilde class="customizeReport">
<div class="flex justify-between h-40" style="flex-basis: 100%">
<PptShape class="text-left w-150">进度管理</PptShape>
<PptShape class="text-right w-240">{
{ startDate }}至{
{ endDate }}</PptShape>
</div>
<div style="flex-basis: 38%; height: 125px; margin-left: 10px">
<!-- {
{typeName}} zz -->
<PptEchartBar
v-if="pptDate['161130201'].ebsReportByType"
:dataset="{
source: [['product', `${typeName}完成工程量`, '累计完成工程量'], ...pptDate['161130201'].ebsReportByType.map(t => [t.type, t.weekQuantity, t.totalQuantity])],
}"
:option="{grid: {left: '10%', right: 10, top: 30, bottom: 86}}"
:colors="['#009dff', '#22e4ff']"
style="height: 250px; width: 100%"
/>
</div>
<div style="flex-basis: 58%; height: 125px; margin-left: 10px">
<PptEchartBar
v-if="pptDate['161130201'].ebsReportByType"
:dataset="{
source: [['product', `${typeName}计划产值`, `${typeName}完成产值`, `累计计划产值`, `累计完成产值`], ...pptDate['161130201'].ebsReportByType.map(t => [t.type, t.weekPlanValue, t.weekActualValue, t.totalPlanValue, t.totalActualValue])],
}"
:option="{grid: {left: '10%', right: 10, top: 30, bottom: 86}}"
:colors="['#3bffd0', '#04e38a', '#9dff86', '#fee588']"
style="height: 250px; width: 100%"
/>
</div>
</PptSilde>
<ArraySplit :data="pptDate['161130201'].nextPlan" :splitSize="7">
<template v-slot="{data}">
<PptSilde class="customizeReport">
<div class="flex justify-between h-40" style="flex-basis: 100%">
<PptShape class="text-left w-150">进度管理</PptShape>
<PptShape class="text-right w-240">{
{ startDate }}至{
{ endDate }}</PptShape>
</div>
<div style="width: 100%; padding-left: 20px">
<PptShape class="text-left w-150" style="font-weight: 800" v-if="typeName === '本周'">下周计划</PptShape>
<PptShape class="text-left w-150" style="font-weight: 800" v-else>下月计划</PptShape>
</div>
<div style="flex-basis: 98%; height: 105px; margin-left: 10px">
<PptTable
:cloumns="[
{title: `名称`, width: '10%', dataIndex: 'type'},
{title: `工期(工日)`, width: '10%', dataIndex: 'duration'},
{title: `计划开始时间`, width: '10%', dataIndex: 'planStartDate'},
{title: `计划结束时间`, width: '10%', dataIndex: 'planEndDate'},
{title: `单位`, width: '5%', dataIndex: 'unit'},
{title: `计划工程量`, width: '10%', dataIndex: 'engineeringQuantity'},
{title: `备注`, width: '8%', dataIndex: 'remark'},
]"
:data="data"
/>
</div>
</PptSilde>
</template>
</ArraySplit>
</template>
<template v-if="menuListOptions['161130202']">
<a name="ppt161130202"></a>
<PptSilde class="customizeReport" v-if="pptDate['161130203']">
<div class="flex justify-between h-40" style="flex-basis: 100%">
<PptShape class="text-left w-150">安全管理</PptShape>
<PptShape class="text-right w-240">{
{ startDate }}至{
{ endDate }}</PptShape>
</div>
<div style="flex-basis: 98%; height: 85px">
<PptTable
:cloumns="[
{title: '一级风险', width: '20%', dataIndex: 'oneRisk'},
{title: '二级风险', width: '20%', dataIndex: 'twoRisk'},
{title: '三级风险', width: '20%', dataIndex: 'threeRisk'},
{title: '四级风险', width: '20%', dataIndex: 'fourRisk'},
{title: '合计', width: '20%', dataIndex: d => d.oneRisk + d.twoRisk + d.threeRisk + d.fourRisk},
]"
:data="[pptDate['161130202'].riskCount]"
/>
</div>
<div style="flex-basis: 98%; height: 85px">
<PptTable
:cloumns="[
{title: '全部一般隐患问题', width: '16%', dataIndex: 'allGeneralDanger'},
{title: '全部重大隐患问题', width: '16%', dataIndex: 'allSeriousDanger'},
{title: '全部隐患问题', width: '13%', dataIndex: &# 最低0.47元/天 解锁文章


 1796
1796

 被折叠的 条评论
为什么被折叠?
被折叠的 条评论
为什么被折叠?
 到【灌水乐园】发言


