


 本文探讨了在Python3.7环境下利用matplotlib库创建图表的过程,通过三种不同的代码示例展示如何导出图表。尽管代码从复杂到简洁,初学者可能会更倾向于易于理解的代码一,但需要注意的是,目前这些代码无法支持中文显示。
1.在python3.7下matplotlib制作图标
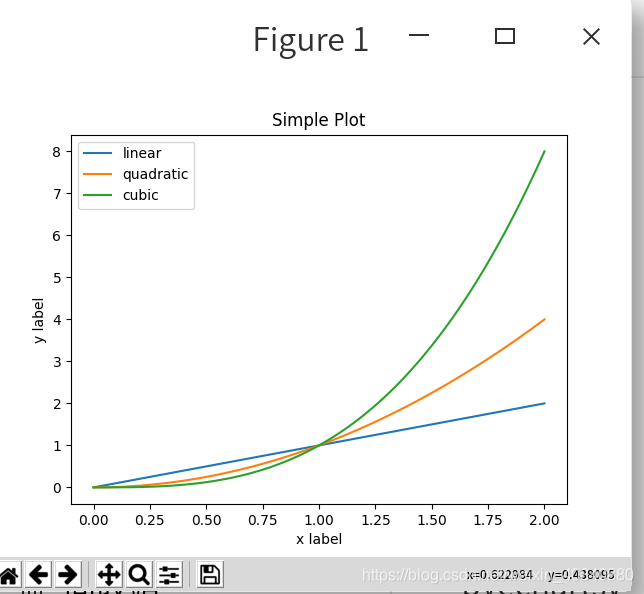
2.图:
3.代码一:
import matplotlib.pyplot as plt
import numpy as np
x = np.linspace(0, 2, 100)
plt.plot(x, x, label='linear')
plt.plot(x, x**2, label='quadratic')
plt.plot(x, x**3, label=
1.在python3.7下matplotlib制作图标
2.图:
3.代码一:
import matplotlib.pyplot as plt
import numpy as np
x = np.linspace(0, 2, 100)
plt.plot(x, x, label='linear')
plt.plot(x, x**2, label='quadratic')
plt.plot(x, x**3, label= 1916
1916

 被折叠的 条评论
为什么被折叠?
被折叠的 条评论
为什么被折叠?
 到【灌水乐园】发言


 最低0.47元/天 解锁文章


