


一、环境准备
1、环境信息
这里我们就使用es的集群,可参考:
Elasticsearch集群的部署
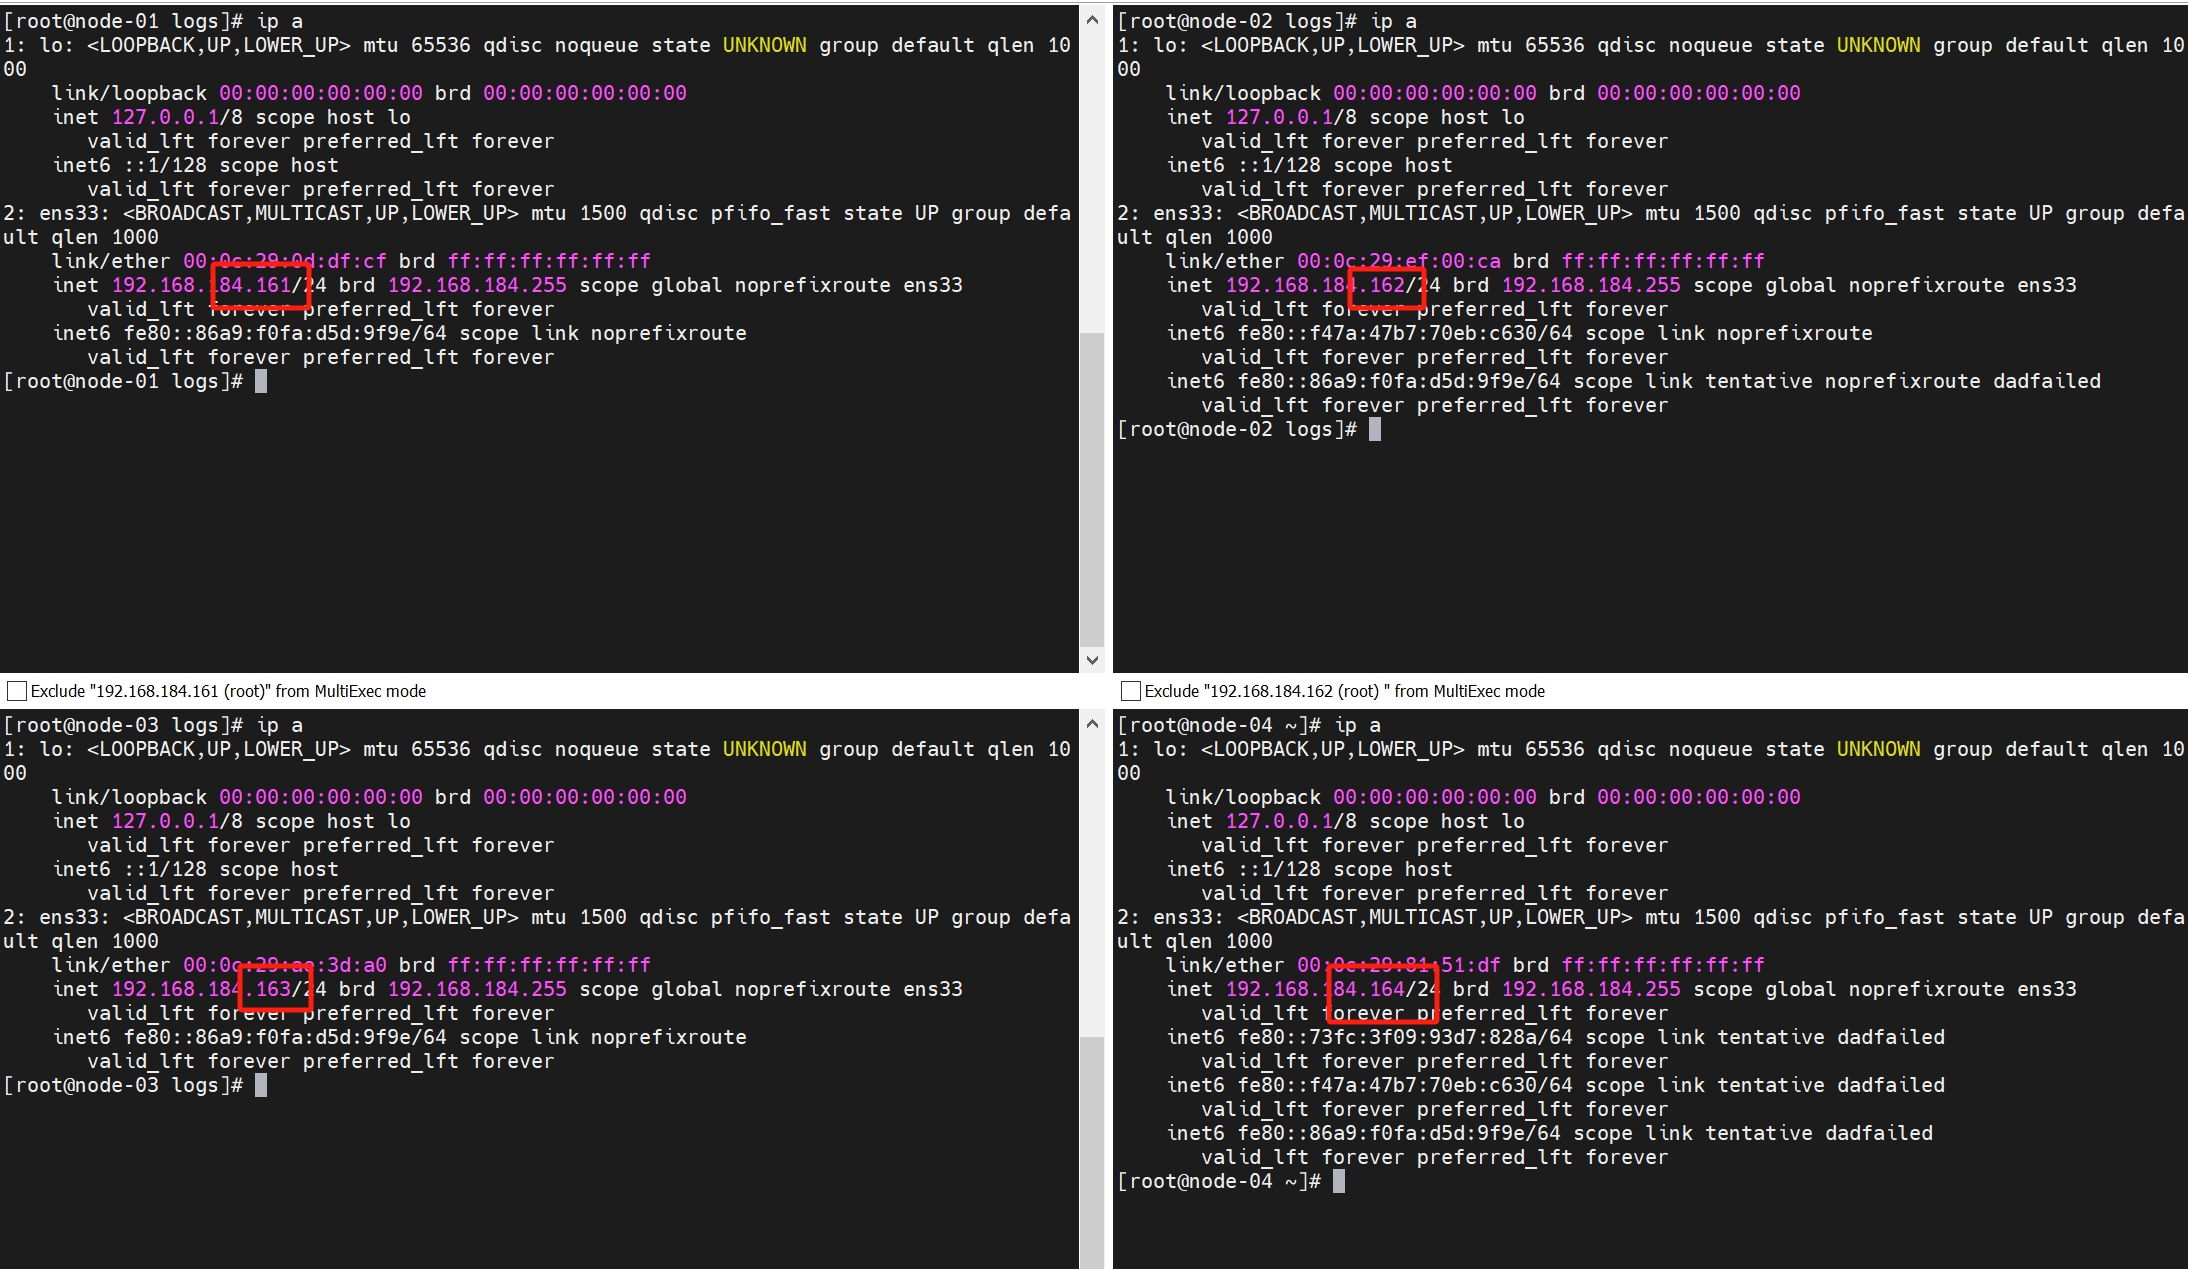
192.168.184.161  es  elasticsearch_exporter
192.168.184.162  es  elasticsearch_exporter
192.168.184.163  es  elasticsearch_exporter
192.168.184.164  prometheus grafana
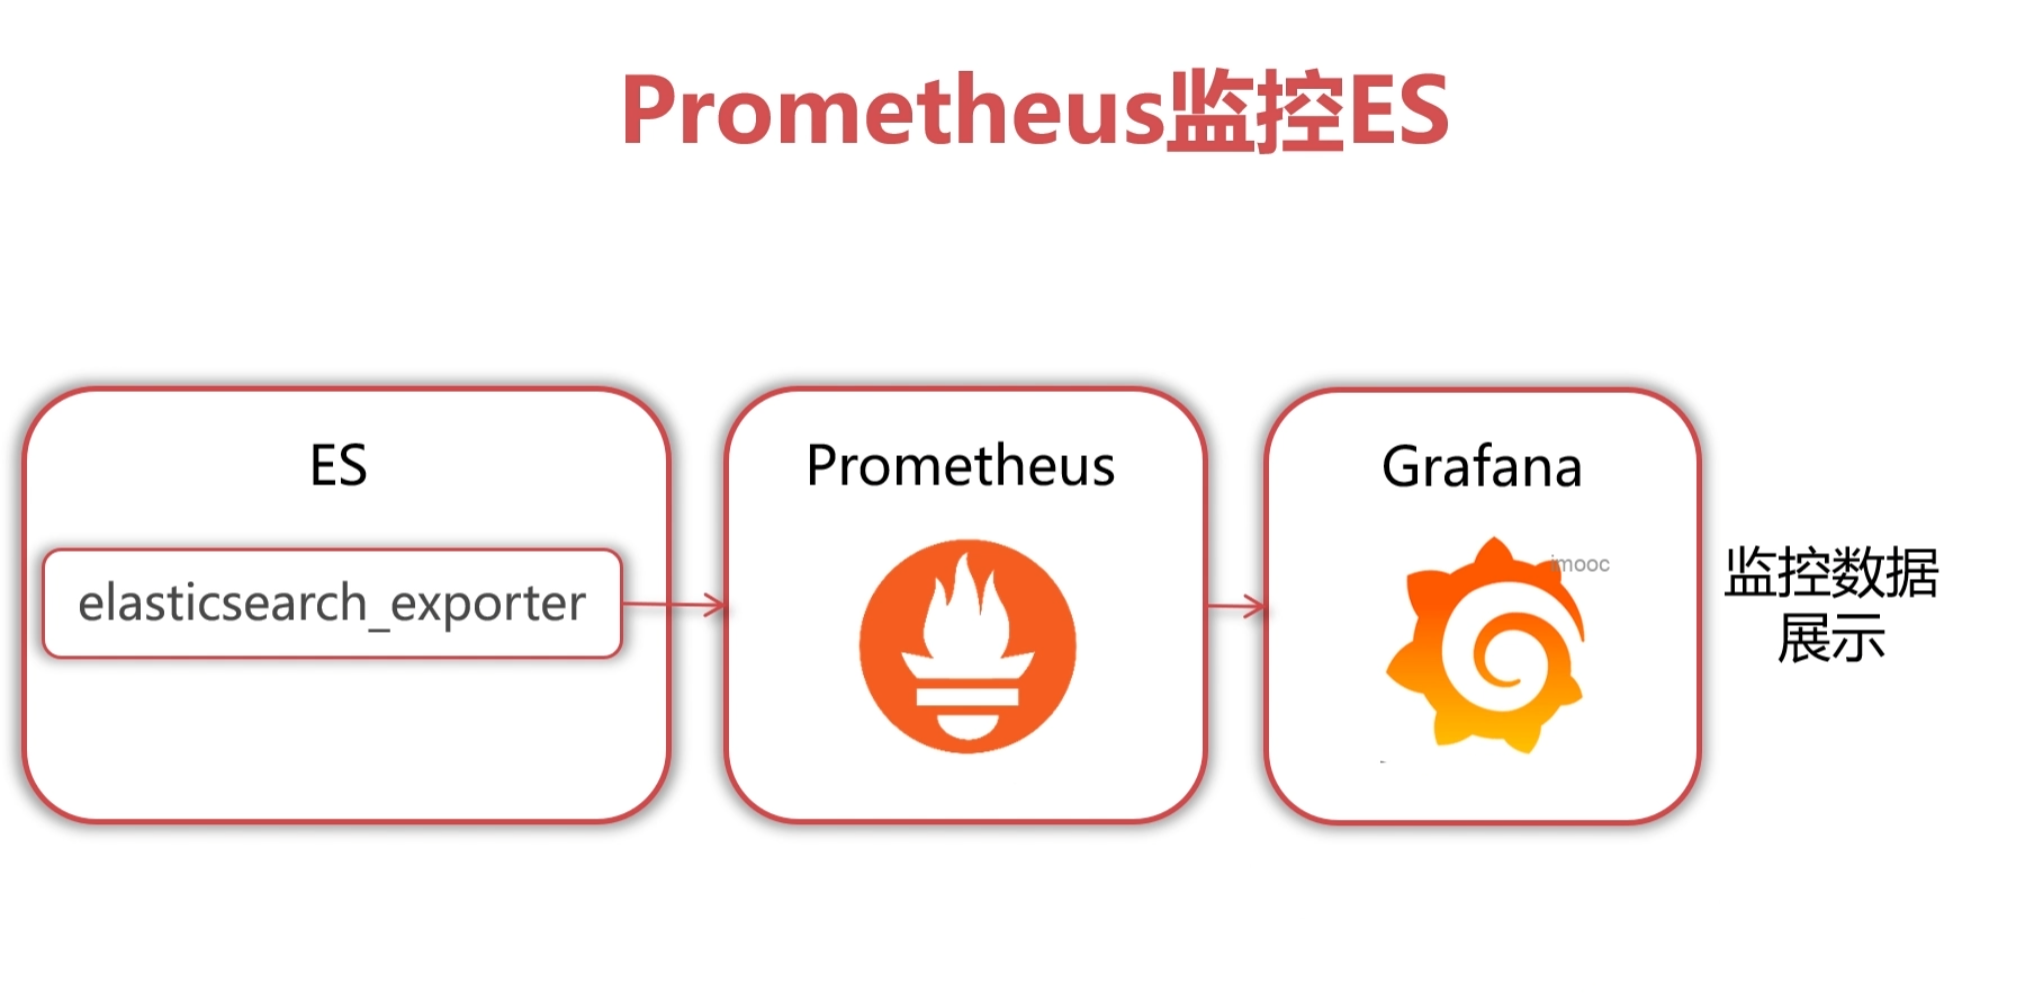
二、Prometheus监控es架构图
三、下载elasticsearch_exporter
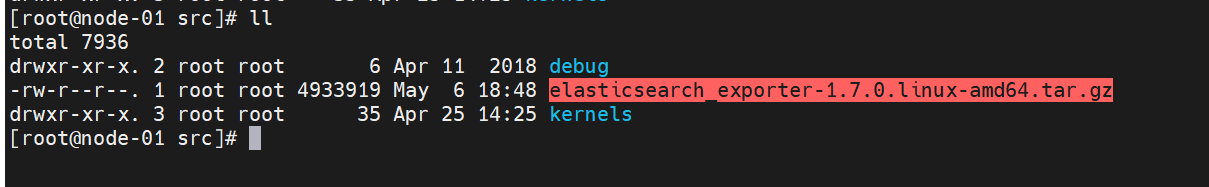
1、下载elasticsearch_exporter
161、162、163节点进行下载elasticsearch_exporter
网盘地址:
链接: https://pan.baidu.com/s/1yIZfdozkf1dNG6ie_PW4xw?pwd=35yv
提取码: 35yv
cd /usr/src
wget https://github.com/prometheus-community/elasticsearch_exporter/releases/download/v1.7.0/elasticsearch_exporter-1.7.0.linux-amd64.tar.gz
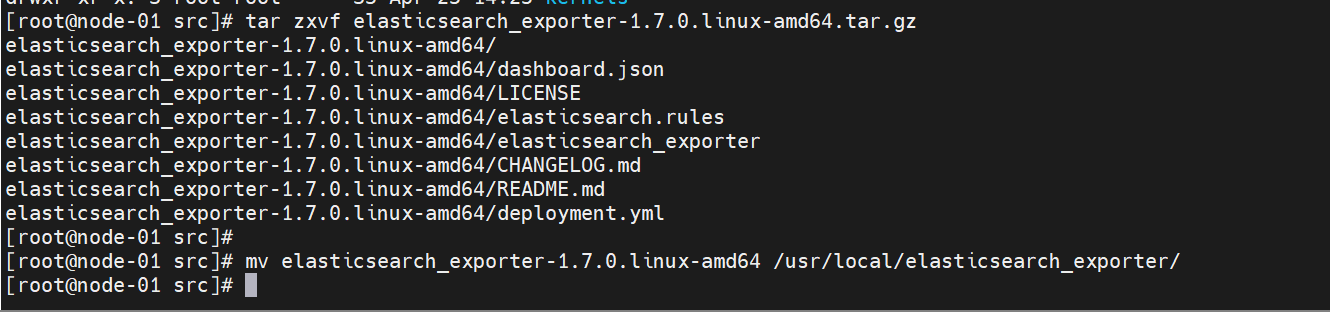
tar zxvf elasticsearch_exporter-1.7.0.linux-amd64.tar.gz
mv elasticsearch_exporter-1.7.0.linux-amd64 /usr/local/elasticsearch_exporter/
2、启动elasticsearch_exporter
(1)161节点启动
cd /usr/local/elasticsearch_exporter/
nohup /usr/local/elasticsearch_exporter/elasticsearch_exporter  --es.all --es.indices --es.indices_settings --es.shards --es.timeout=10s --web.listen-address=":9115" --web.telemetry-path="/metrics" --es.uri http://192.168.184.161:9200/ &

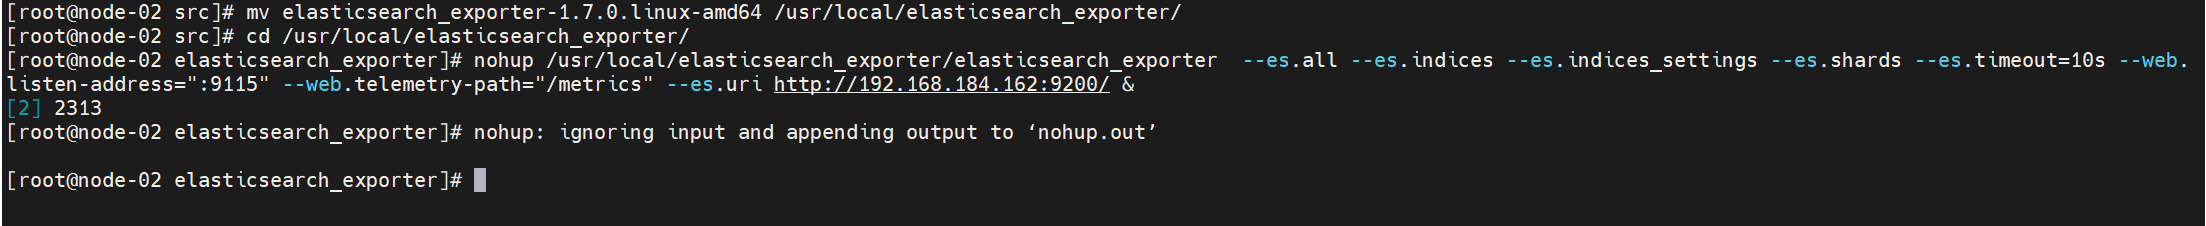
(2)162节点启动
cd /usr/local/elasticsearch_exporter/
nohup /usr/local/elasticsearch_exporter/elasticsearch_exporter  --es.all --es.indices --es.indices_settings --es.shards --es.timeout=10s --web.listen-address=":9115" --web.telemetry-path="/metrics" --es.uri http://192.168.184.162:9200/ &
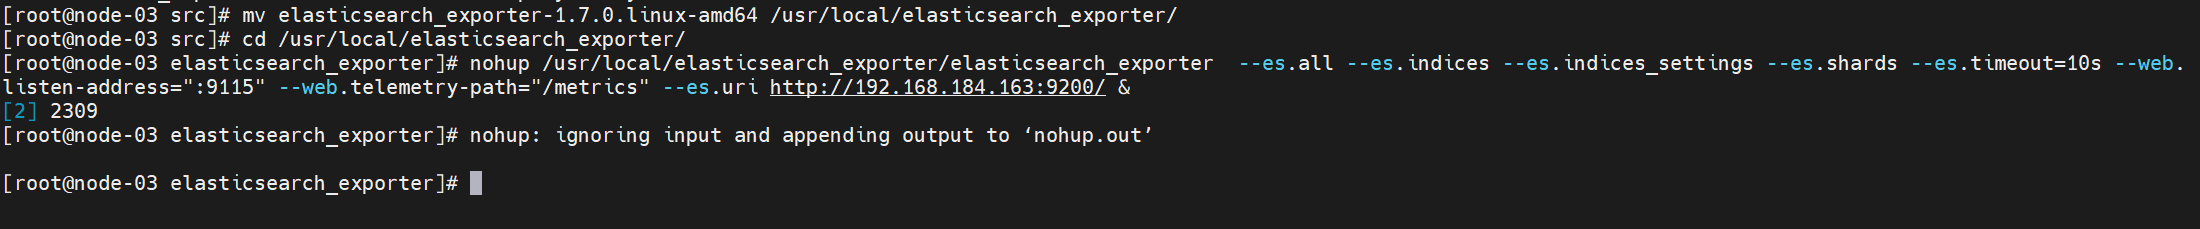
(3)163节点启动
cd /usr/local/elasticsearch_exporter/
nohup /usr/local/elasticsearch_exporter/elasticsearch_exporter  --es.all --es.indices --es.indices_settings --es.shards --es.timeout=10s --web.listen-address=":9115" --web.telemetry-path="/metrics" --es.uri http://192.168.184.163:9200/ &
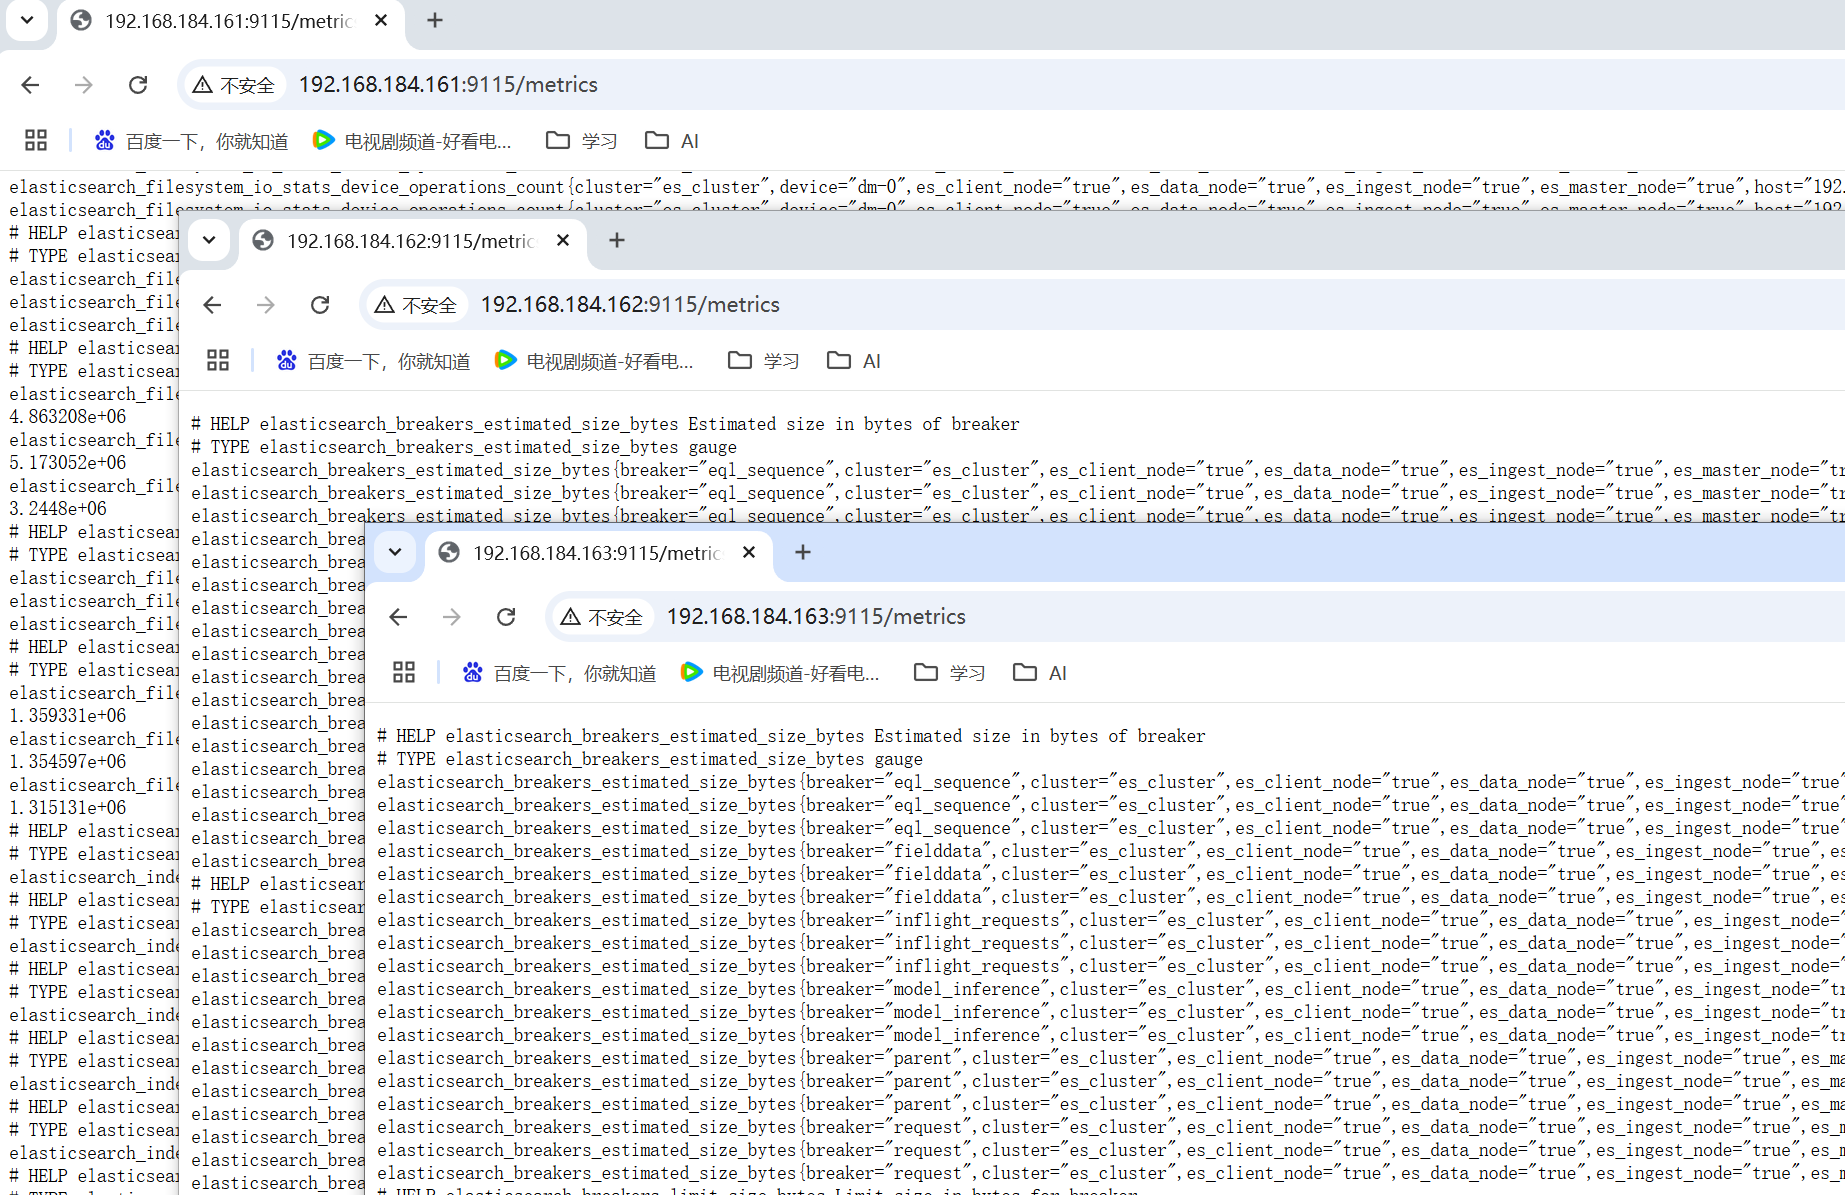
3、获取监控数据
http://192.168.184.161:9115/metrics
http://192.168.184.162:9115/metrics
http://192.168.184.163:9115/metrics
四、安装Prometheus
164节点进行安装配置
1、官网获取版本
https://prometheus.io/download/
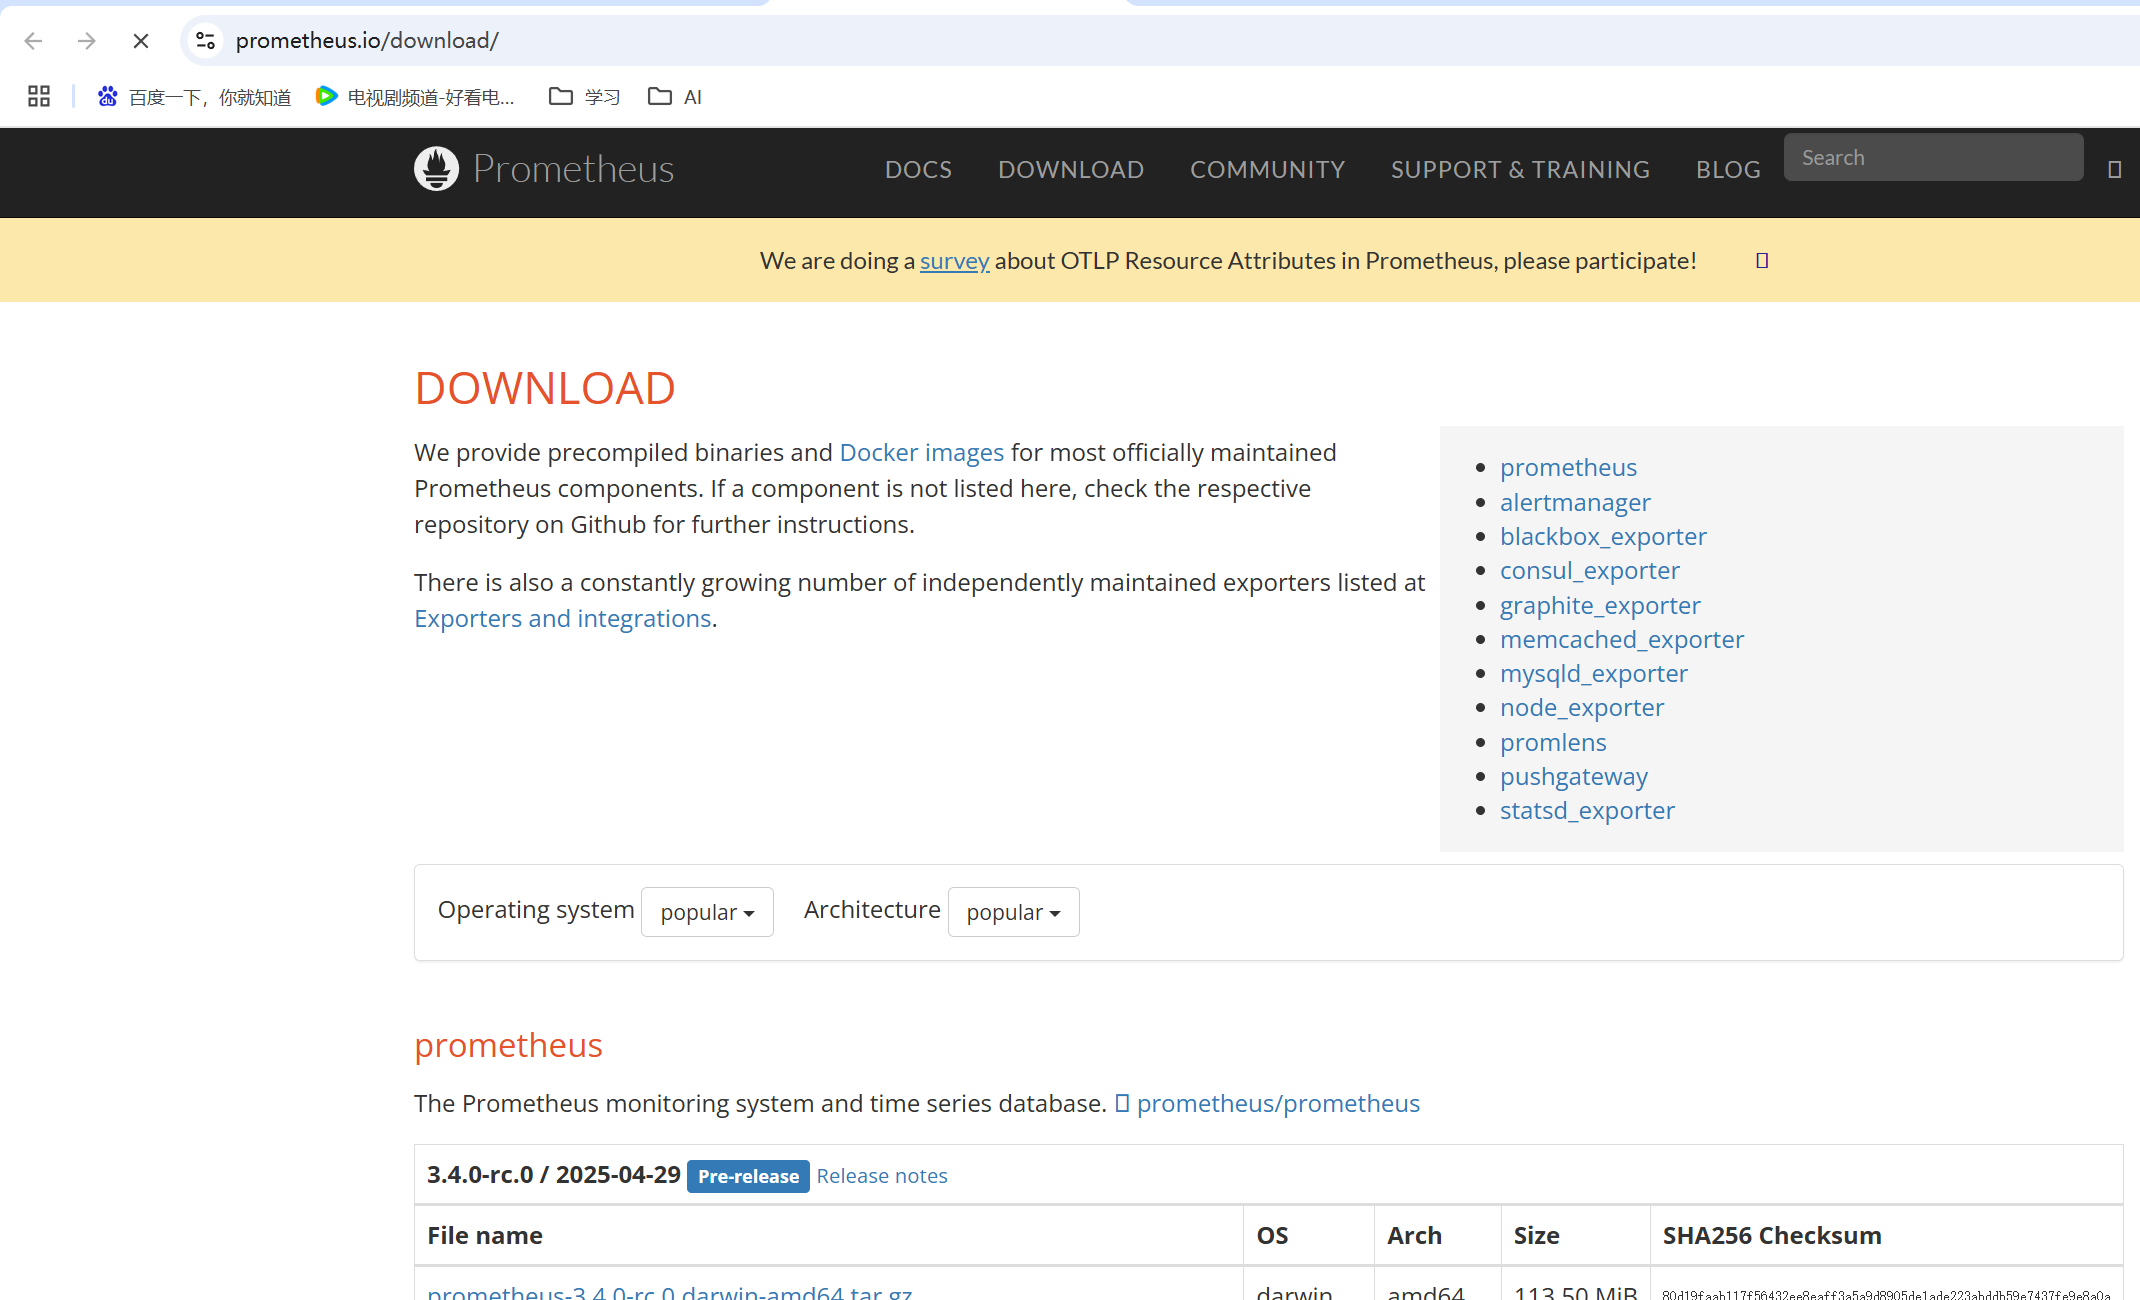
2、进行下载
如果下载慢,可下载网盘中的
链接: https://pan.baidu.com/s/13hSjP0aT5ORc_R-yVCDszA?pwd=bhj9
提取码: bhj9
cd /usr/src/
wget https://github.com/prometheus/prometheus/releases/download/v3.3.0/prometheus-3.3.0.linux-amd64.tar.gz
3、解压安装包
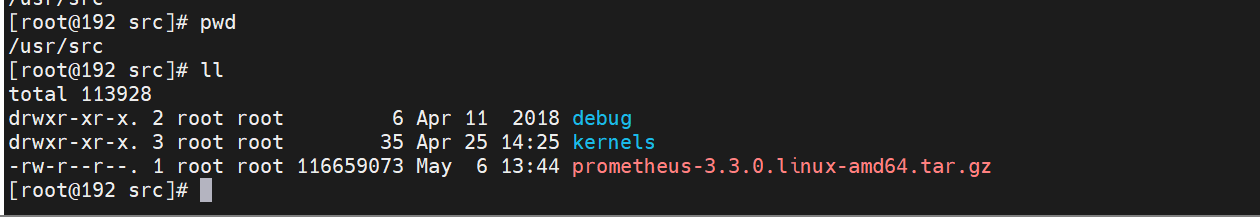
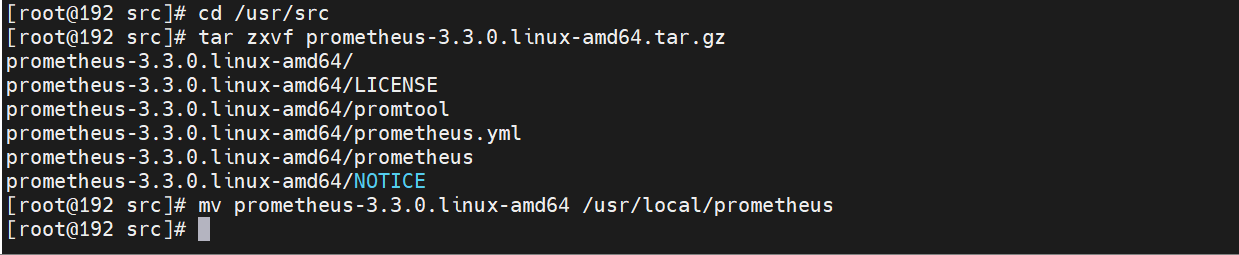
cd /usr/src
tar zxvf prometheus-3.3.0.linux-amd64.tar.gz
mv prometheus-3.3.0.linux-amd64 /usr/local/prometheus
4、配置Prometheus为系统服务
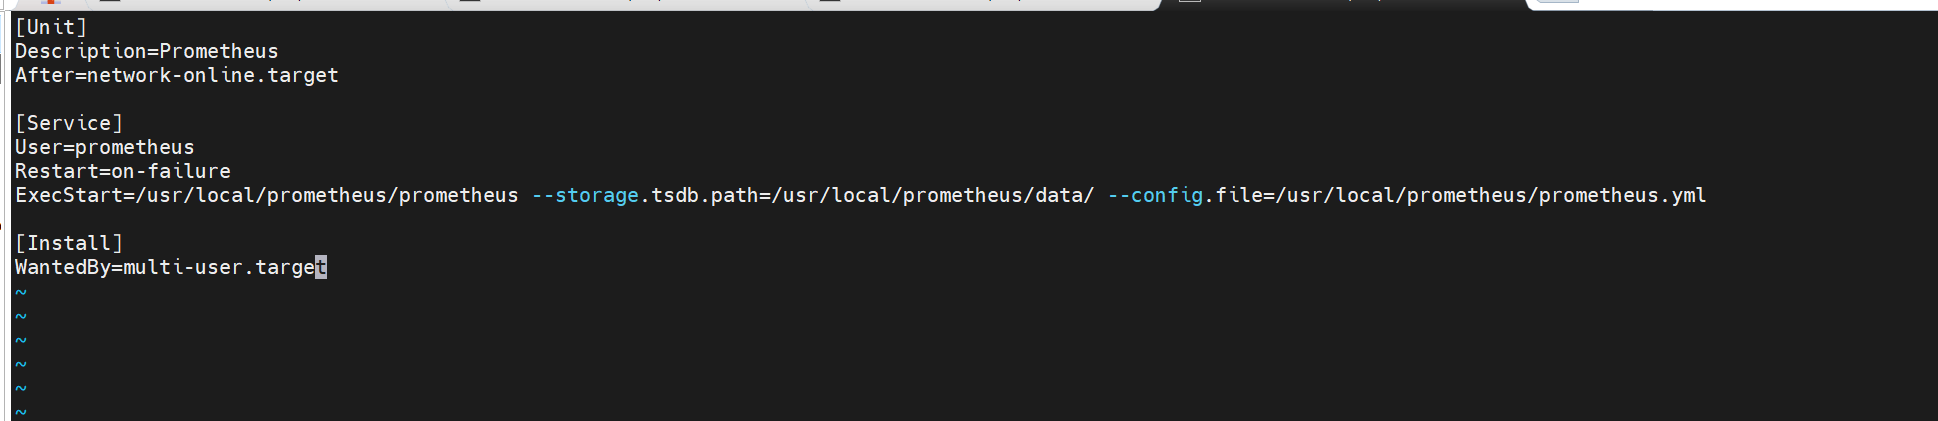
vim /etc/systemd/system/prometheus.service
添加如下内容:
[Unit]
Description=Prometheus
After=network-online.target

[Service]
User=prometheus
Restart=on-failure
ExecStart=/usr/local/prometheus/prometheus --storage.tsdb.path=/usr/local/prometheus/data/ --config.file=/usr/local/prometheus/prometheus.yml

[Install]
WantedBy=multi-user.target
5、创建相关文件夹并启动
(1)创建数据目录
mkdir -p /usr/local/prometheus/data/

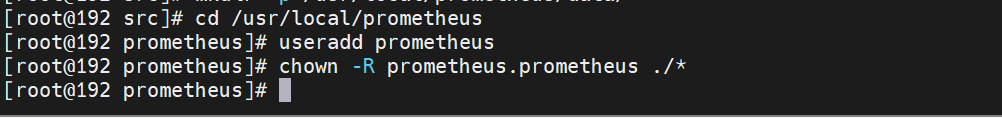
(2)修改属组
cd /usr/local/prometheus
useradd prometheus
chown -R prometheus.prometheus ./*
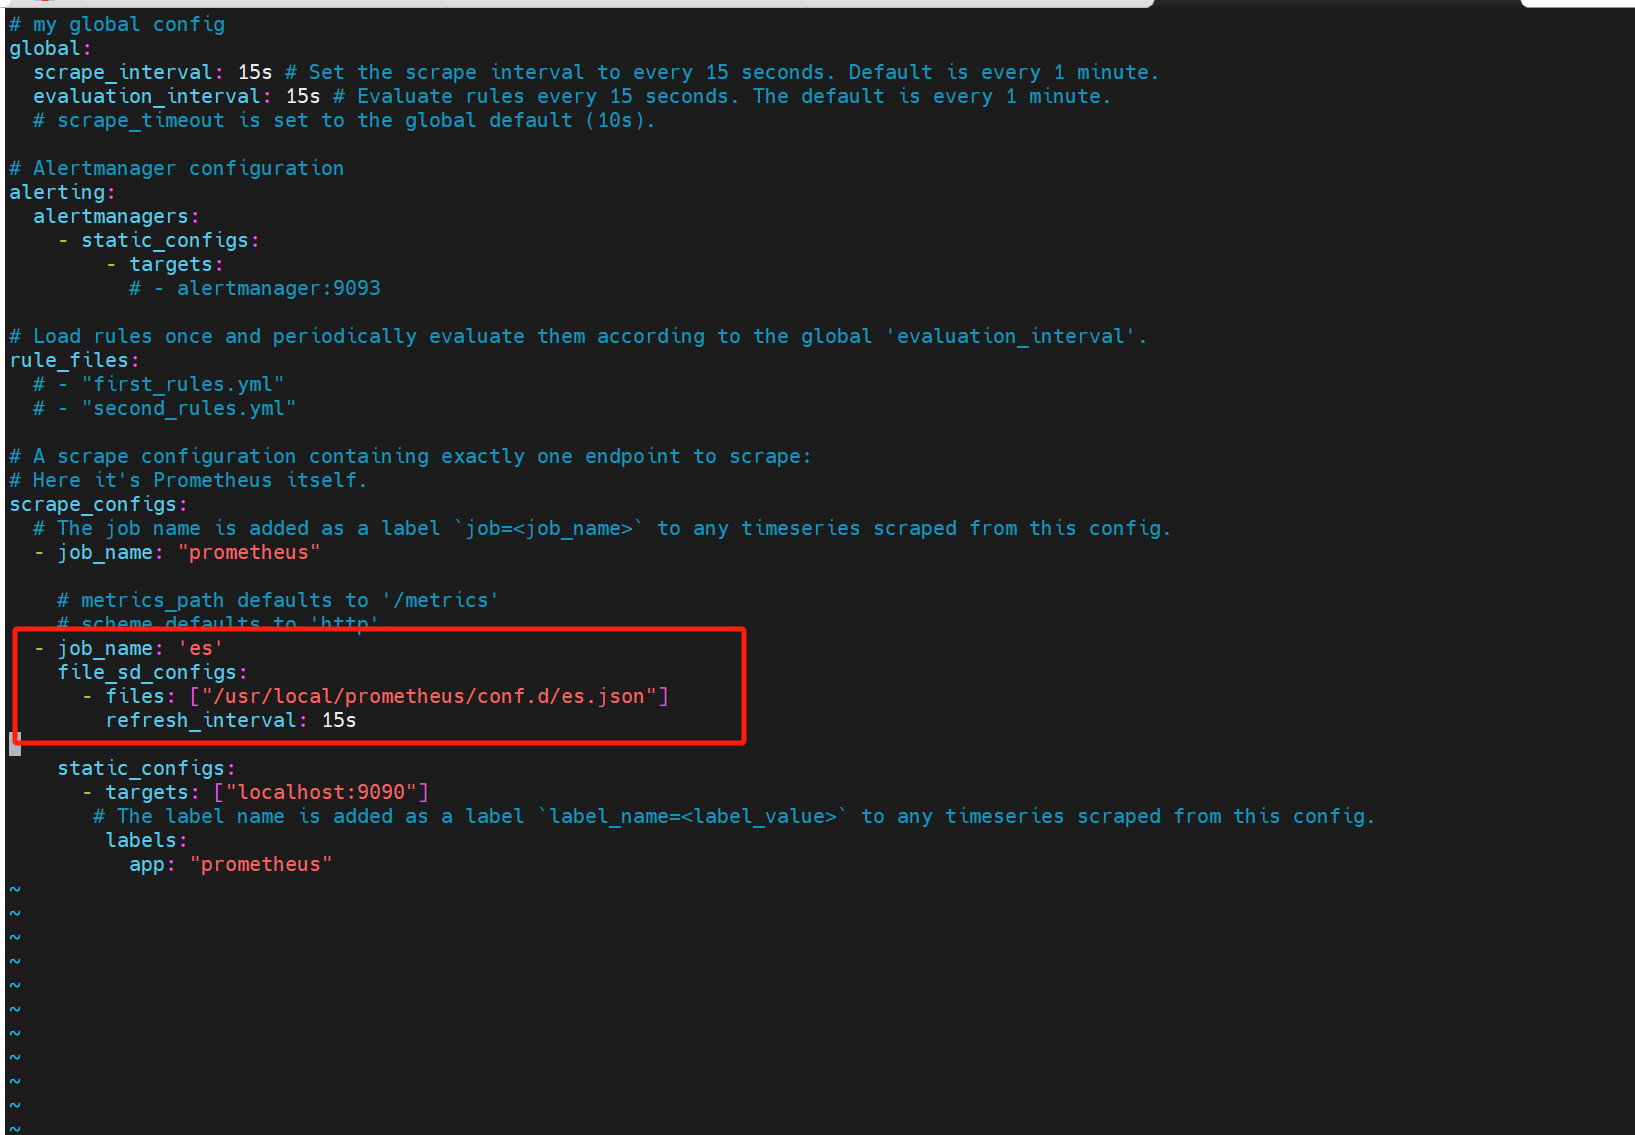
(3)修改Prometheus主配置文件
vim /usr/local/prometheus/prometheus.yml
加入如下内容:
  - job_name: 'es'
    file_sd_configs:
      - files: ["/usr/local/prometheus/conf.d/es.json"]
        refresh_interval: 15s
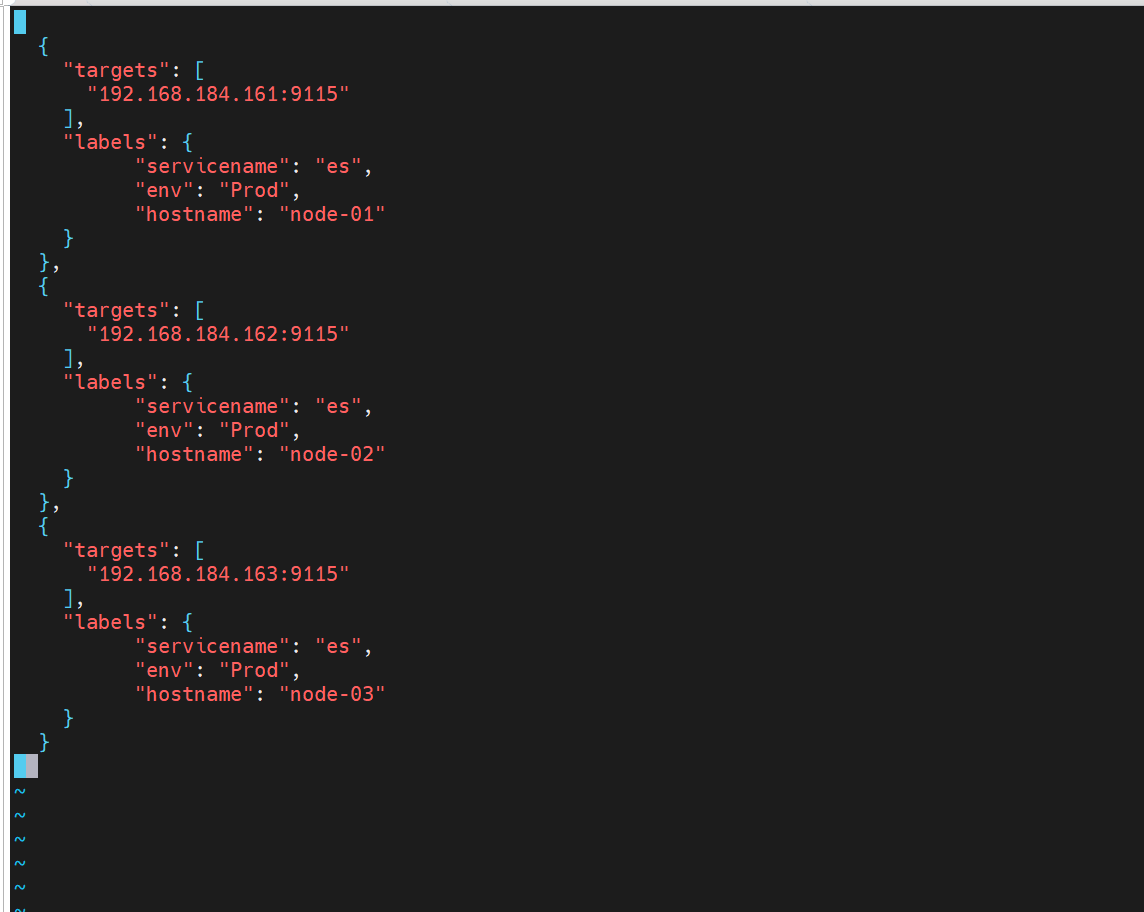
(4)增加机器配置文件
mkdir /usr/local/prometheus/conf.d
vim /usr/local/prometheus/conf.d/es.json
添加如下内容:
[
  {
    "targets": [
      "192.168.184.161:9115"
    ],
    "labels": {
          "servicename": "es",
          "env": "Prod",
          "hostname": "node-01"
    }
  },
  {
    "targets": [
      "192.168.184.162:9115"
    ],
    "labels": {
          "servicename": "es",
          "env": "Prod",
          "hostname": "node-02"
    }
  },
  {
    "targets": [
      "192.168.184.163:9115"
    ],
    "labels": {
          "servicename": "es",
          "env": "Prod",
          "hostname": "node-03"
    }
  }
]
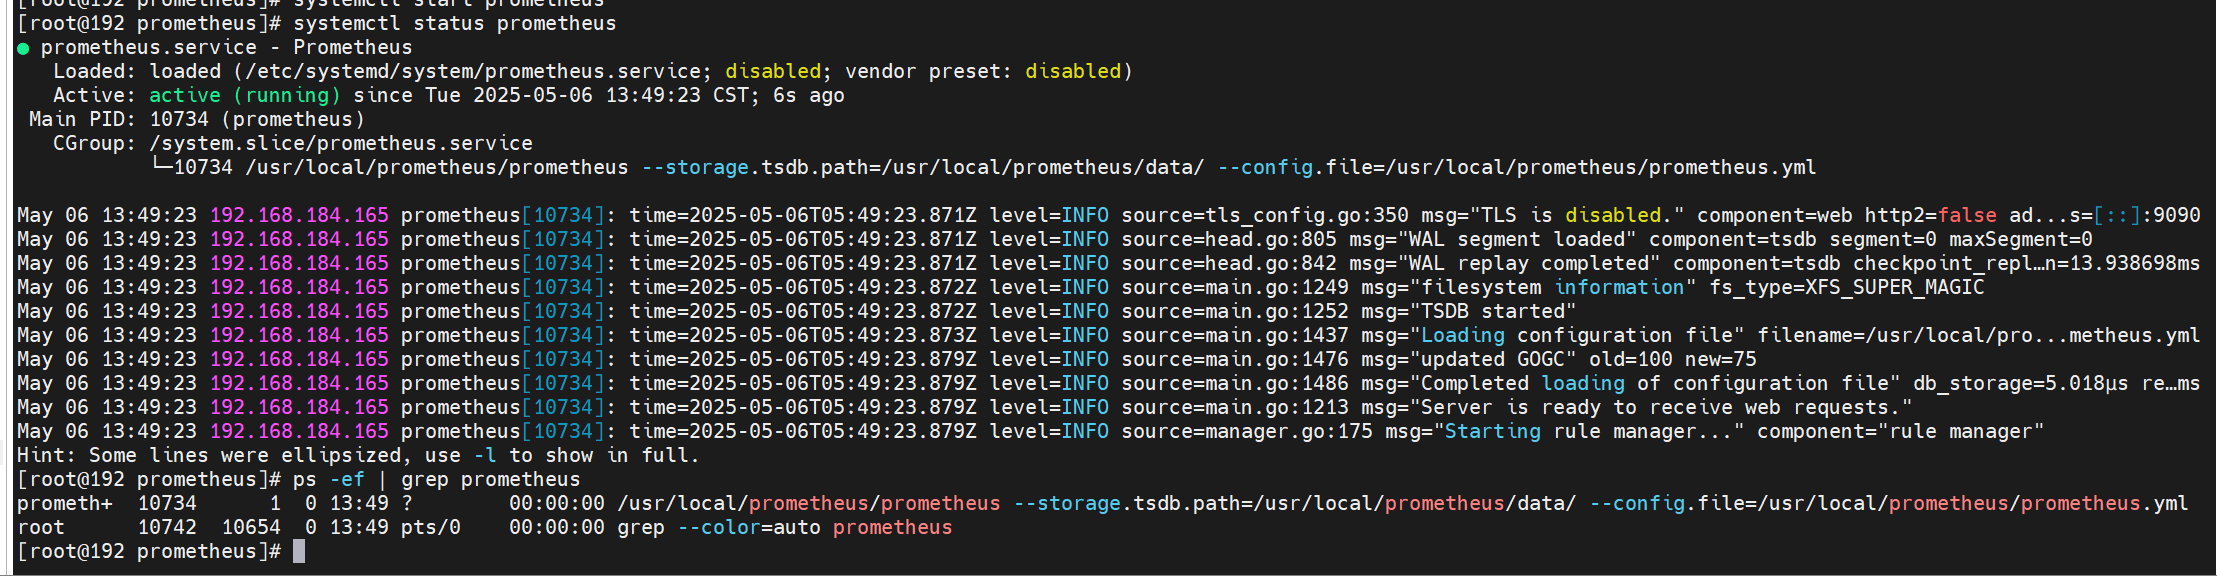
(5)启动Prometheus
systemctl start prometheus

(6)查看Prometheus进程
systemctl status prometheus
ps -ef|grep prometheus
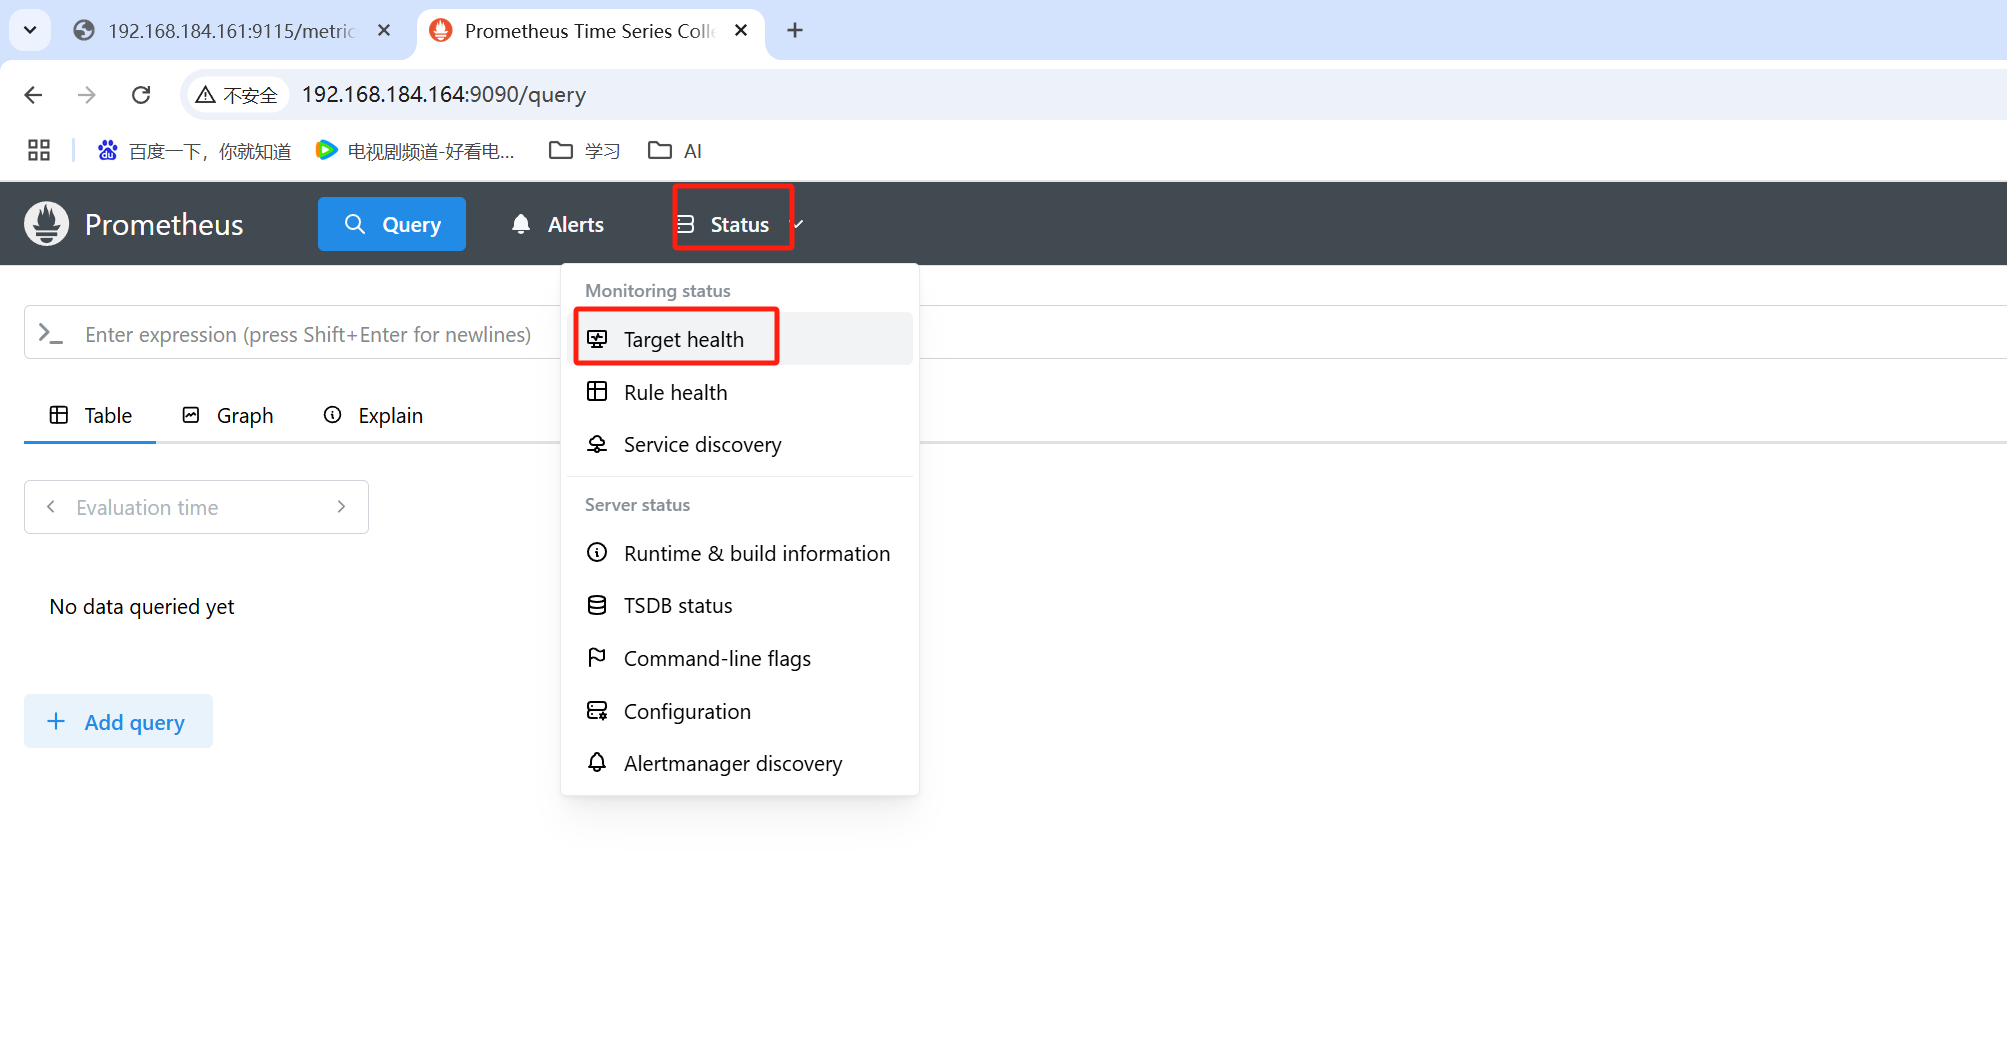
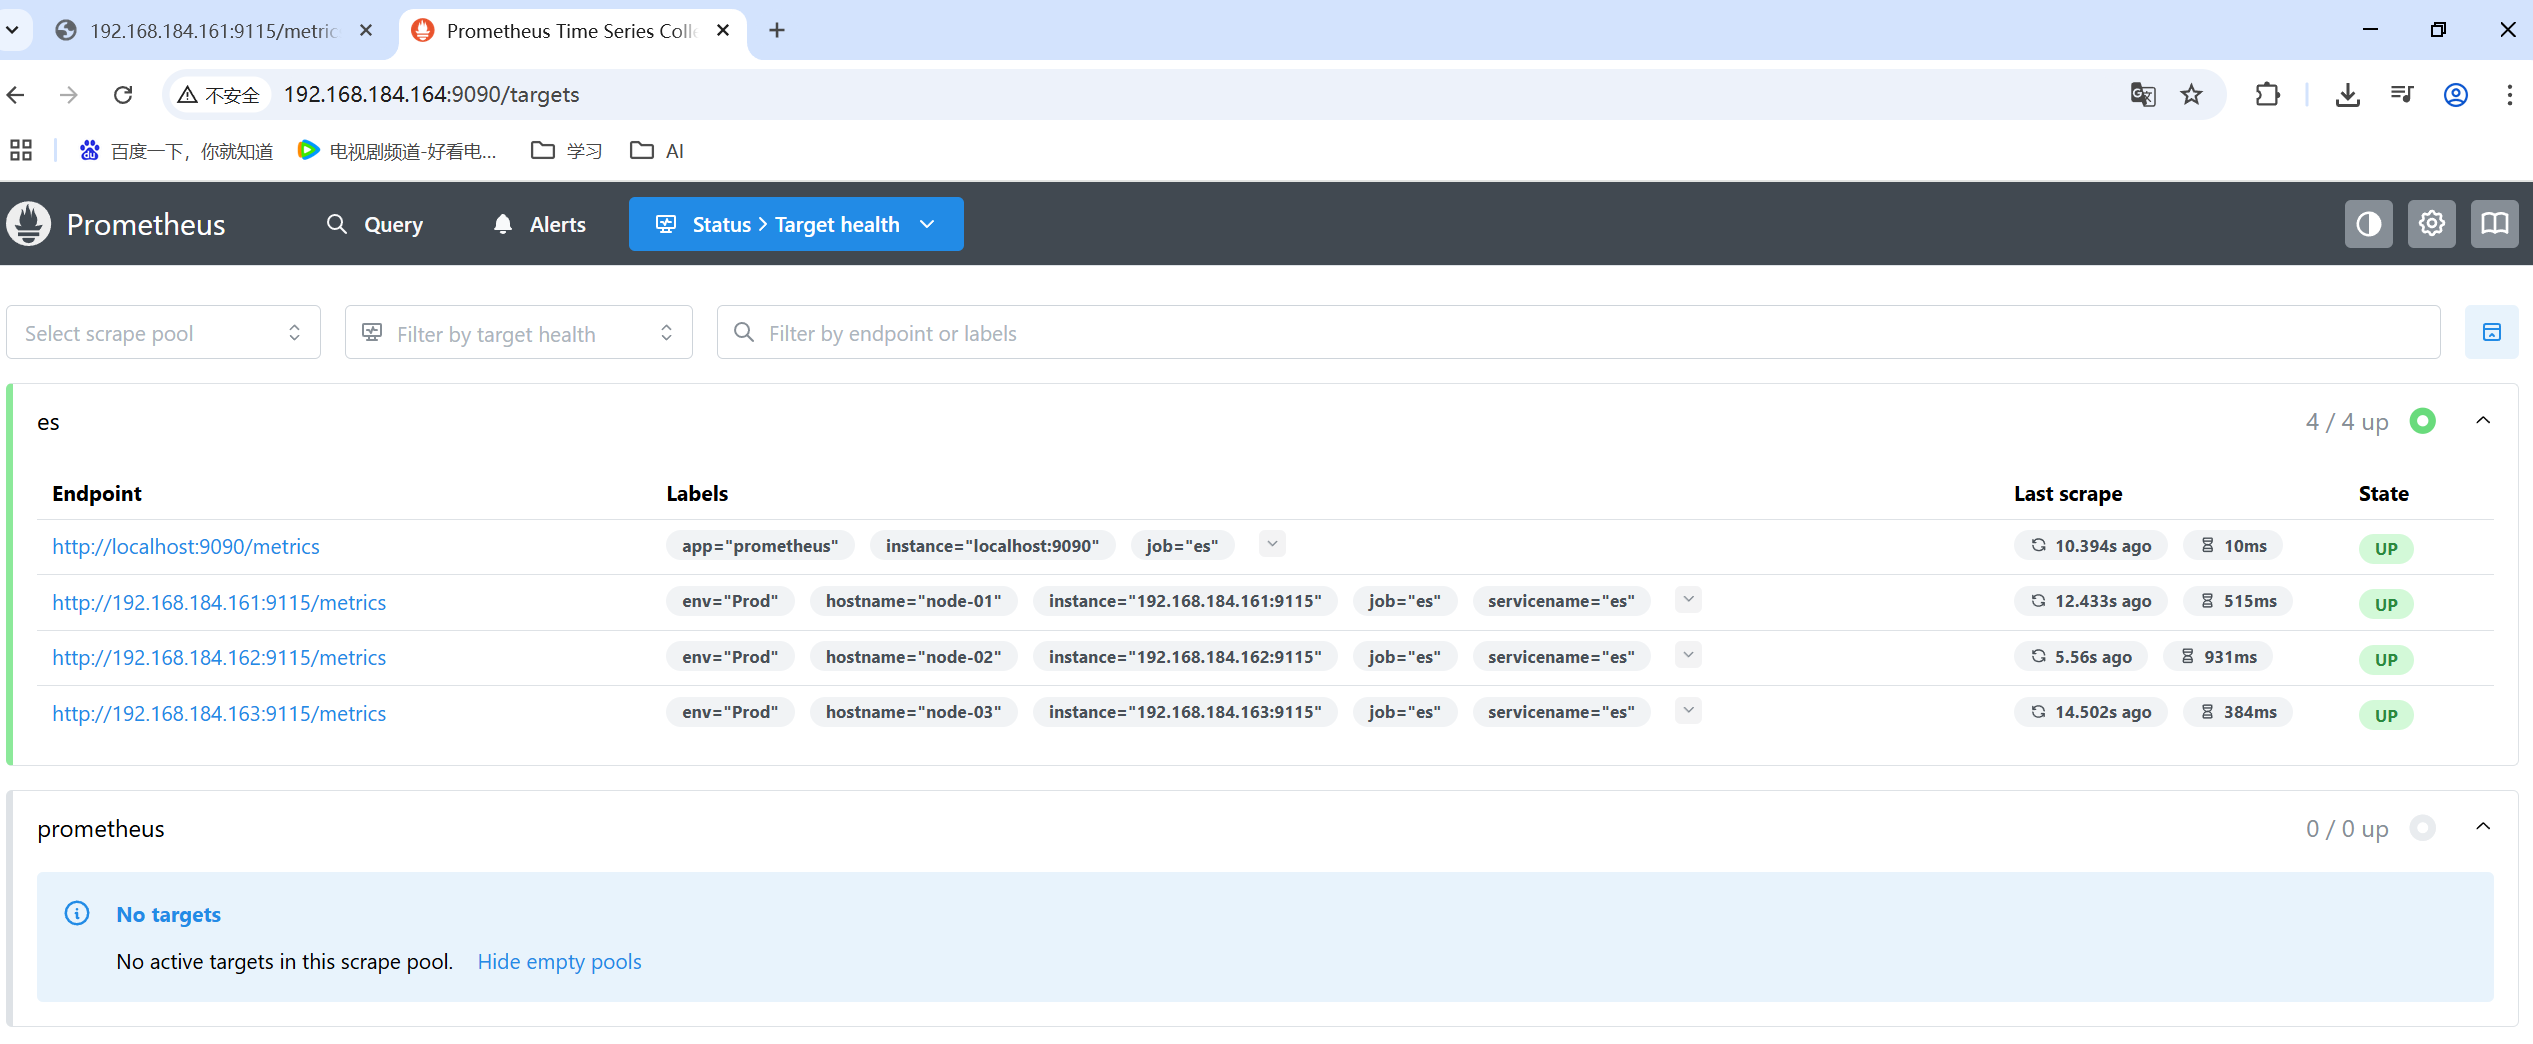
6、页面查看监控情况
http://192.168.184.164:9090/
(1)查看集群列表
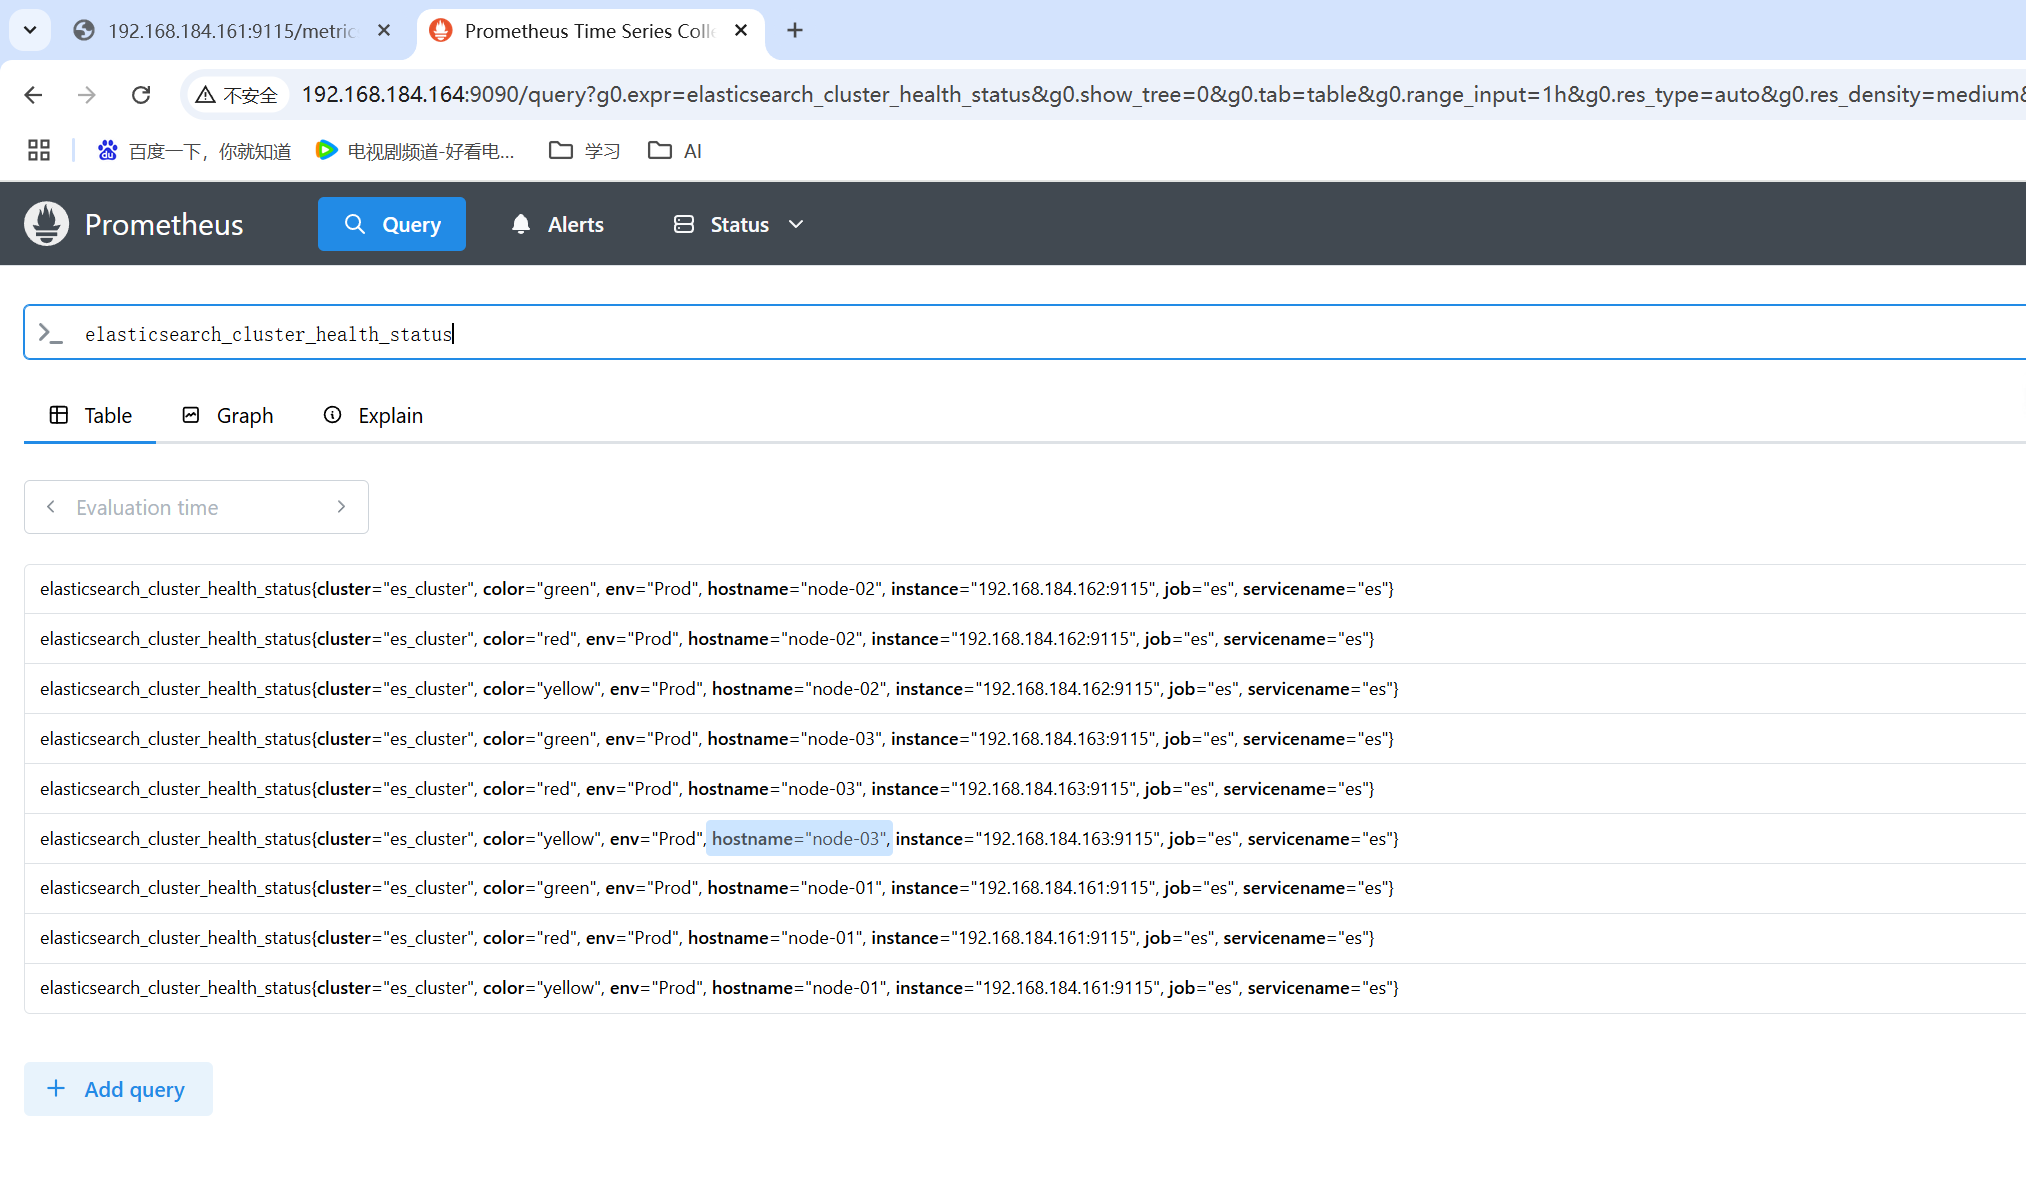
(2)查看es的监控数据
elasticsearch_cluster_health_status
五、安装Grafana
164节点进行安装
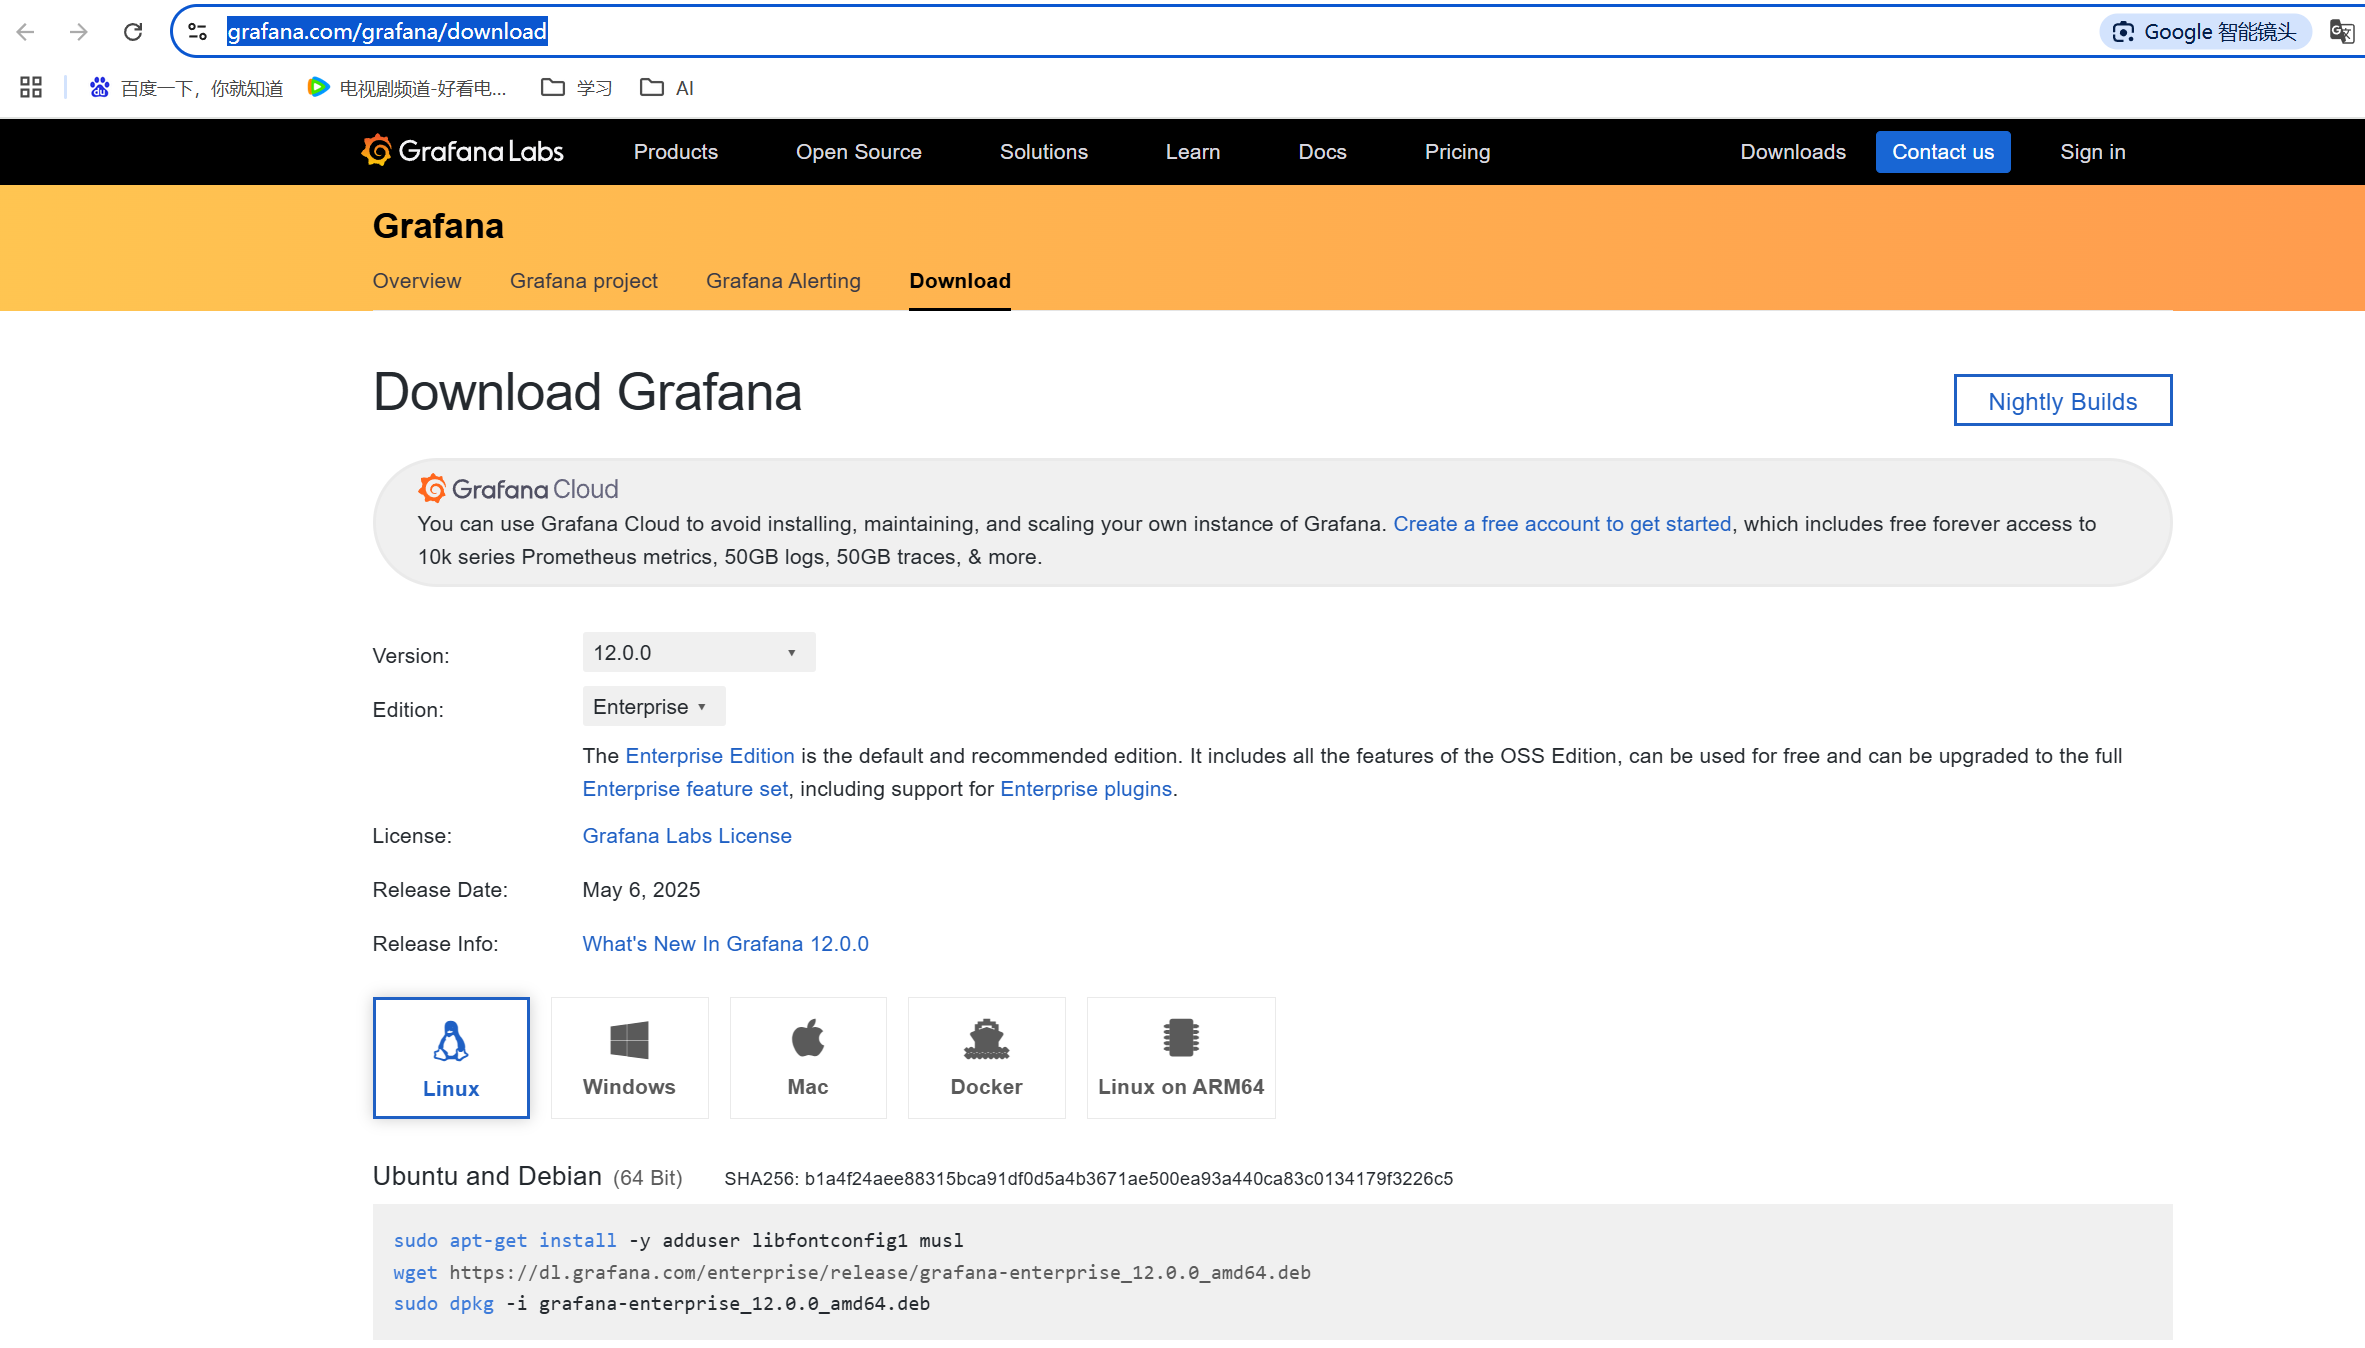
1、官网获取版本
https://grafana.com/grafana/download
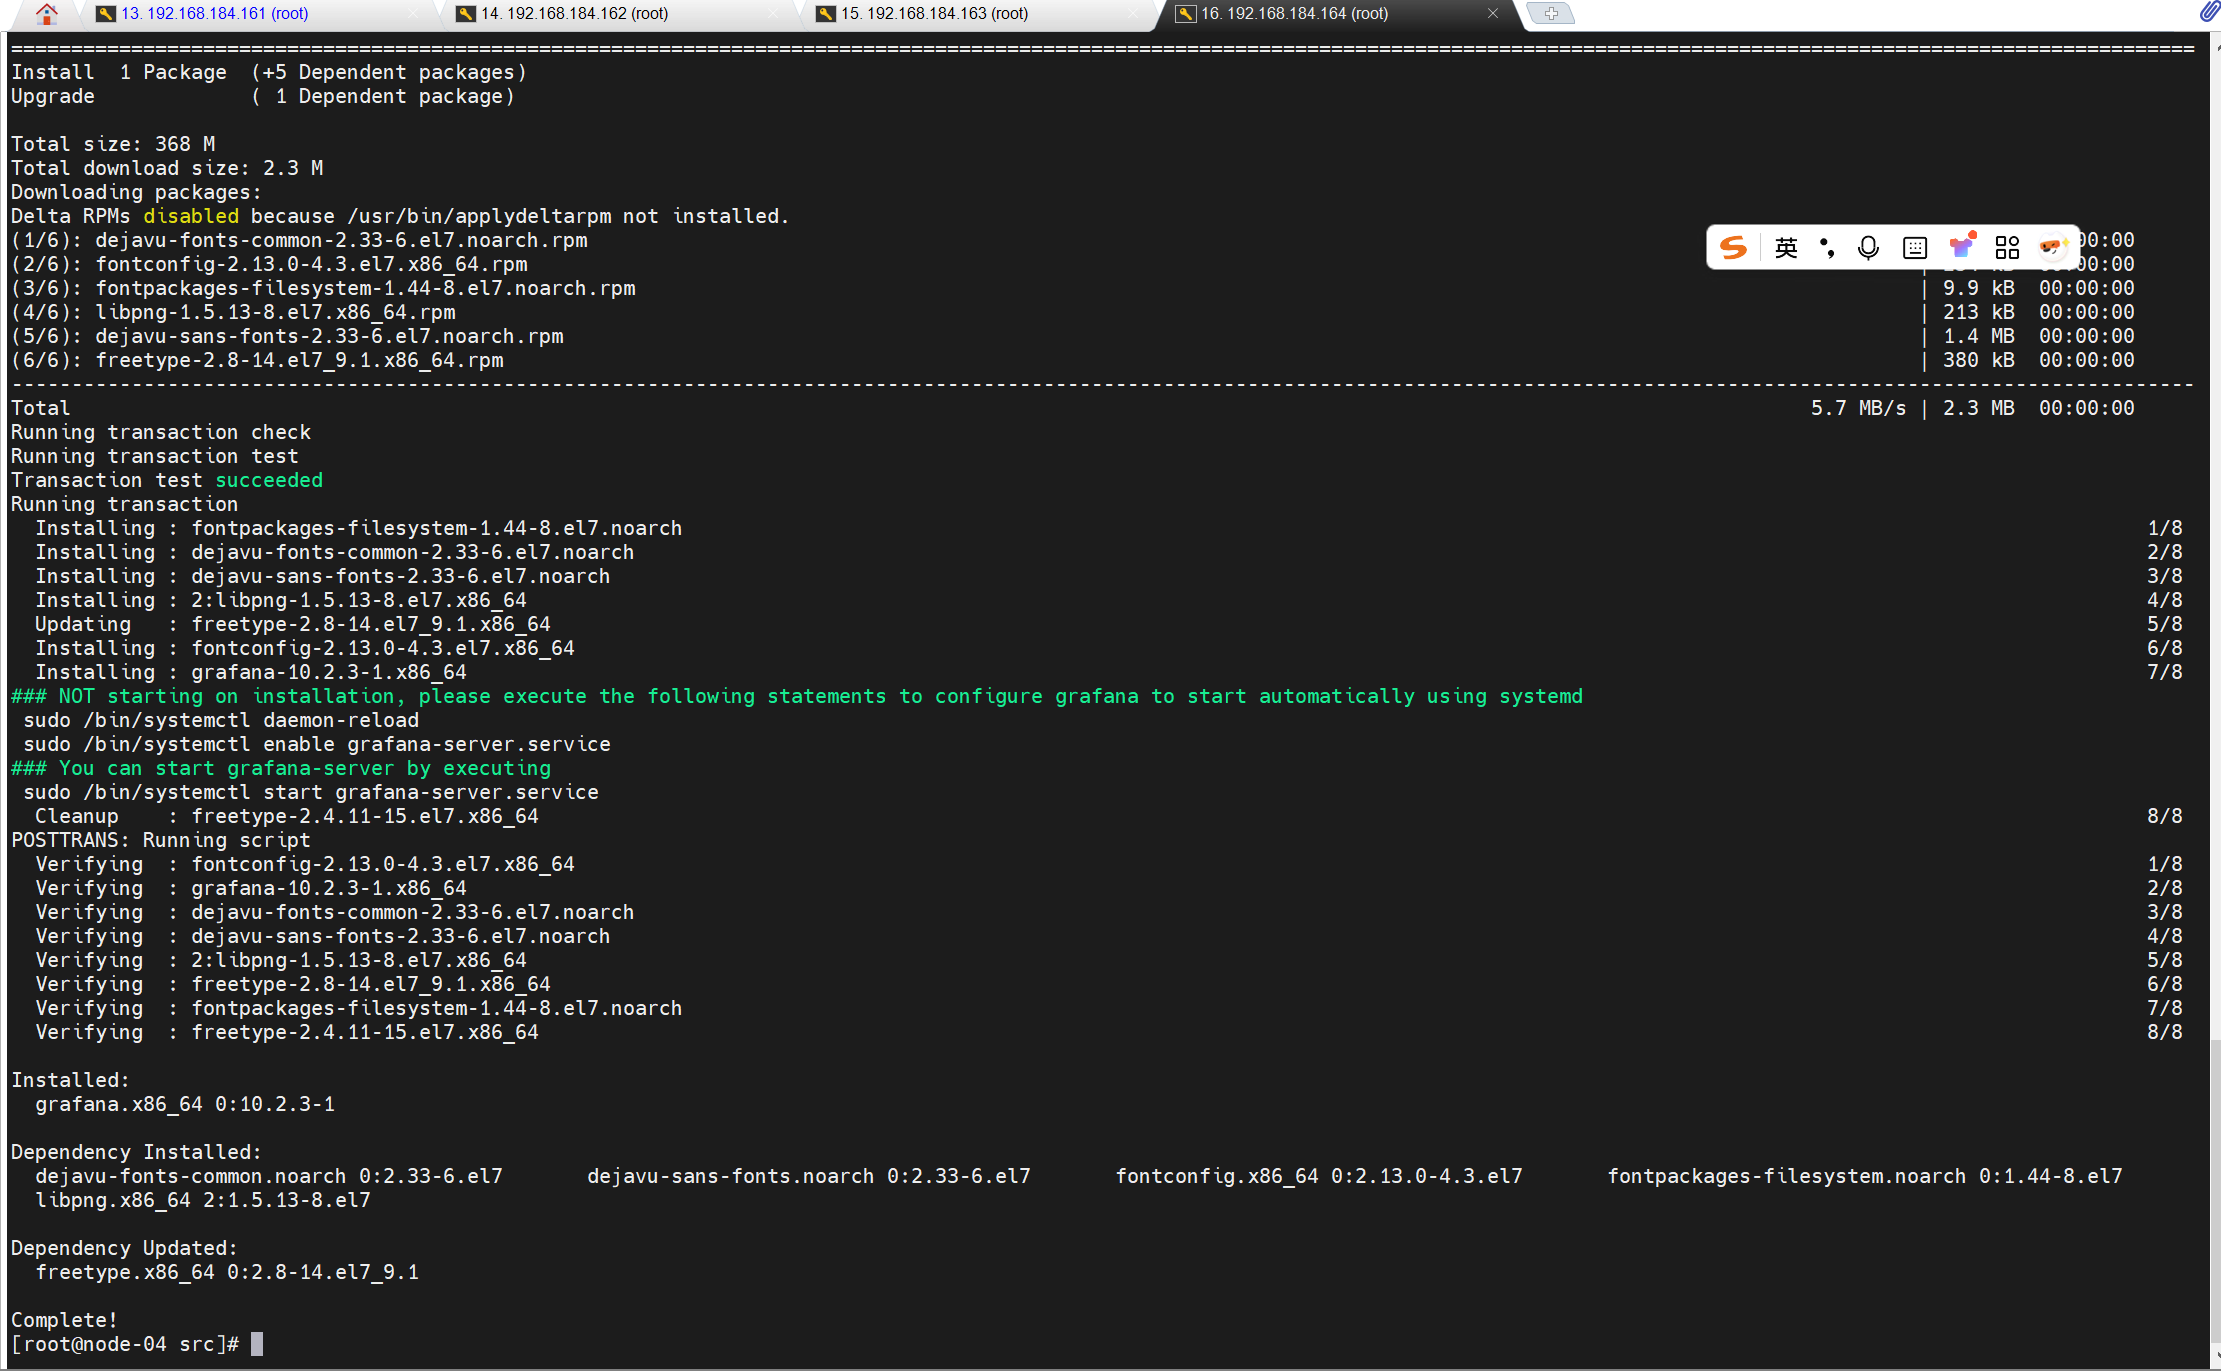
2、进行安装
如果下载慢,可使用网盘地址:
链接: https://pan.baidu.com/s/1qGiFM4XLEkFQyF7NThZBnA?pwd=ibjh
提取码: ibjh
yum install -y https://dl.grafana.com/oss/release/grafana-10.2.3-1.x86_64.rpm
3、启动Grafana
systemctl start grafana-server.service

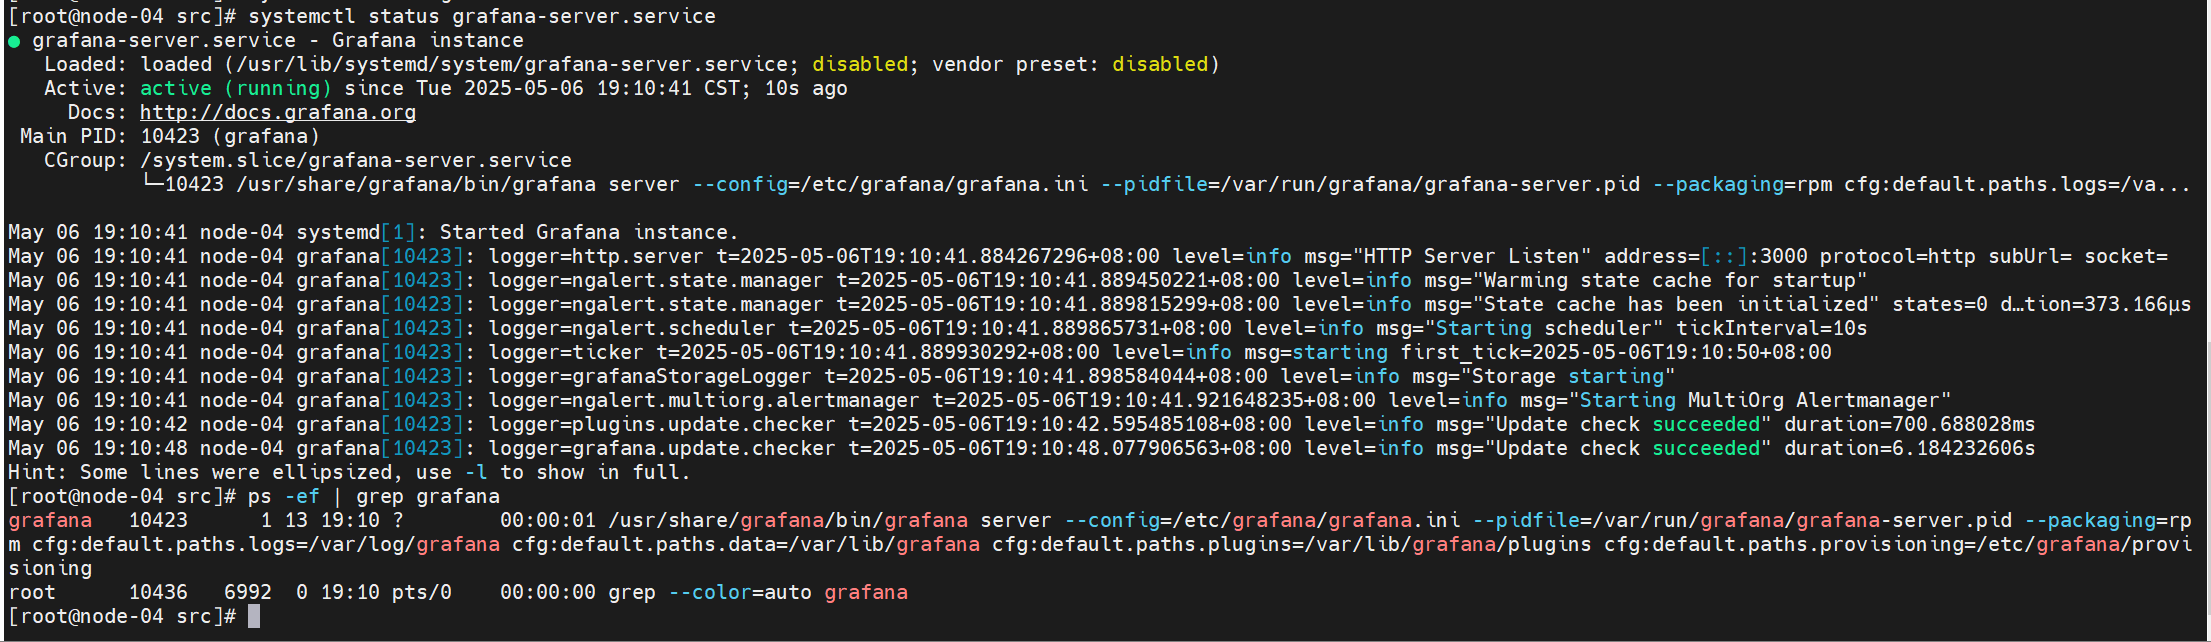
4、查看进程
systemctl status grafana-server.service
ps -ef | grep grafana
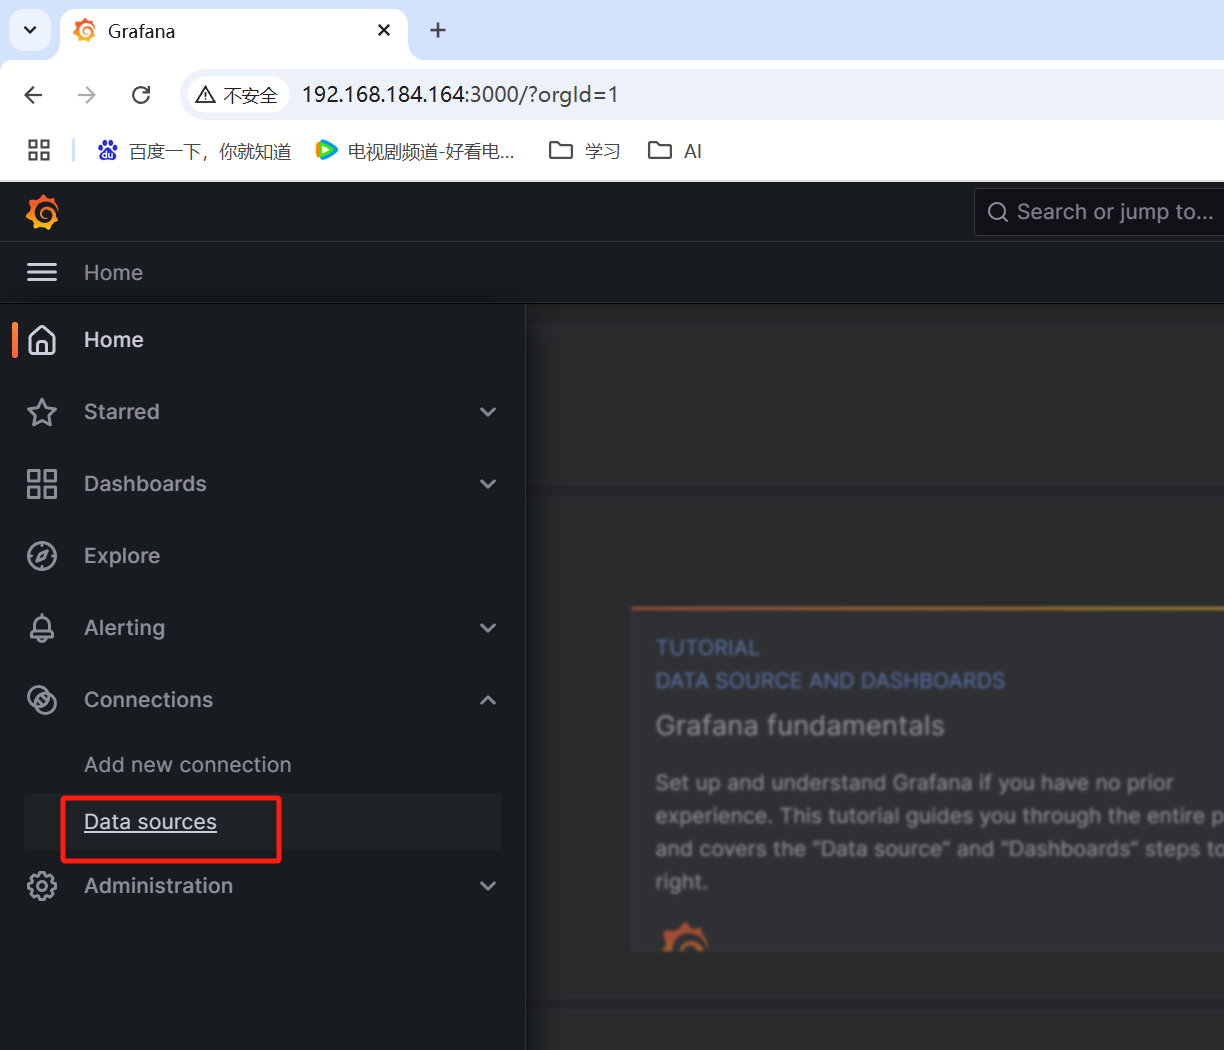
5、登录页面
http://192.168.184.164:3000
admin/admin

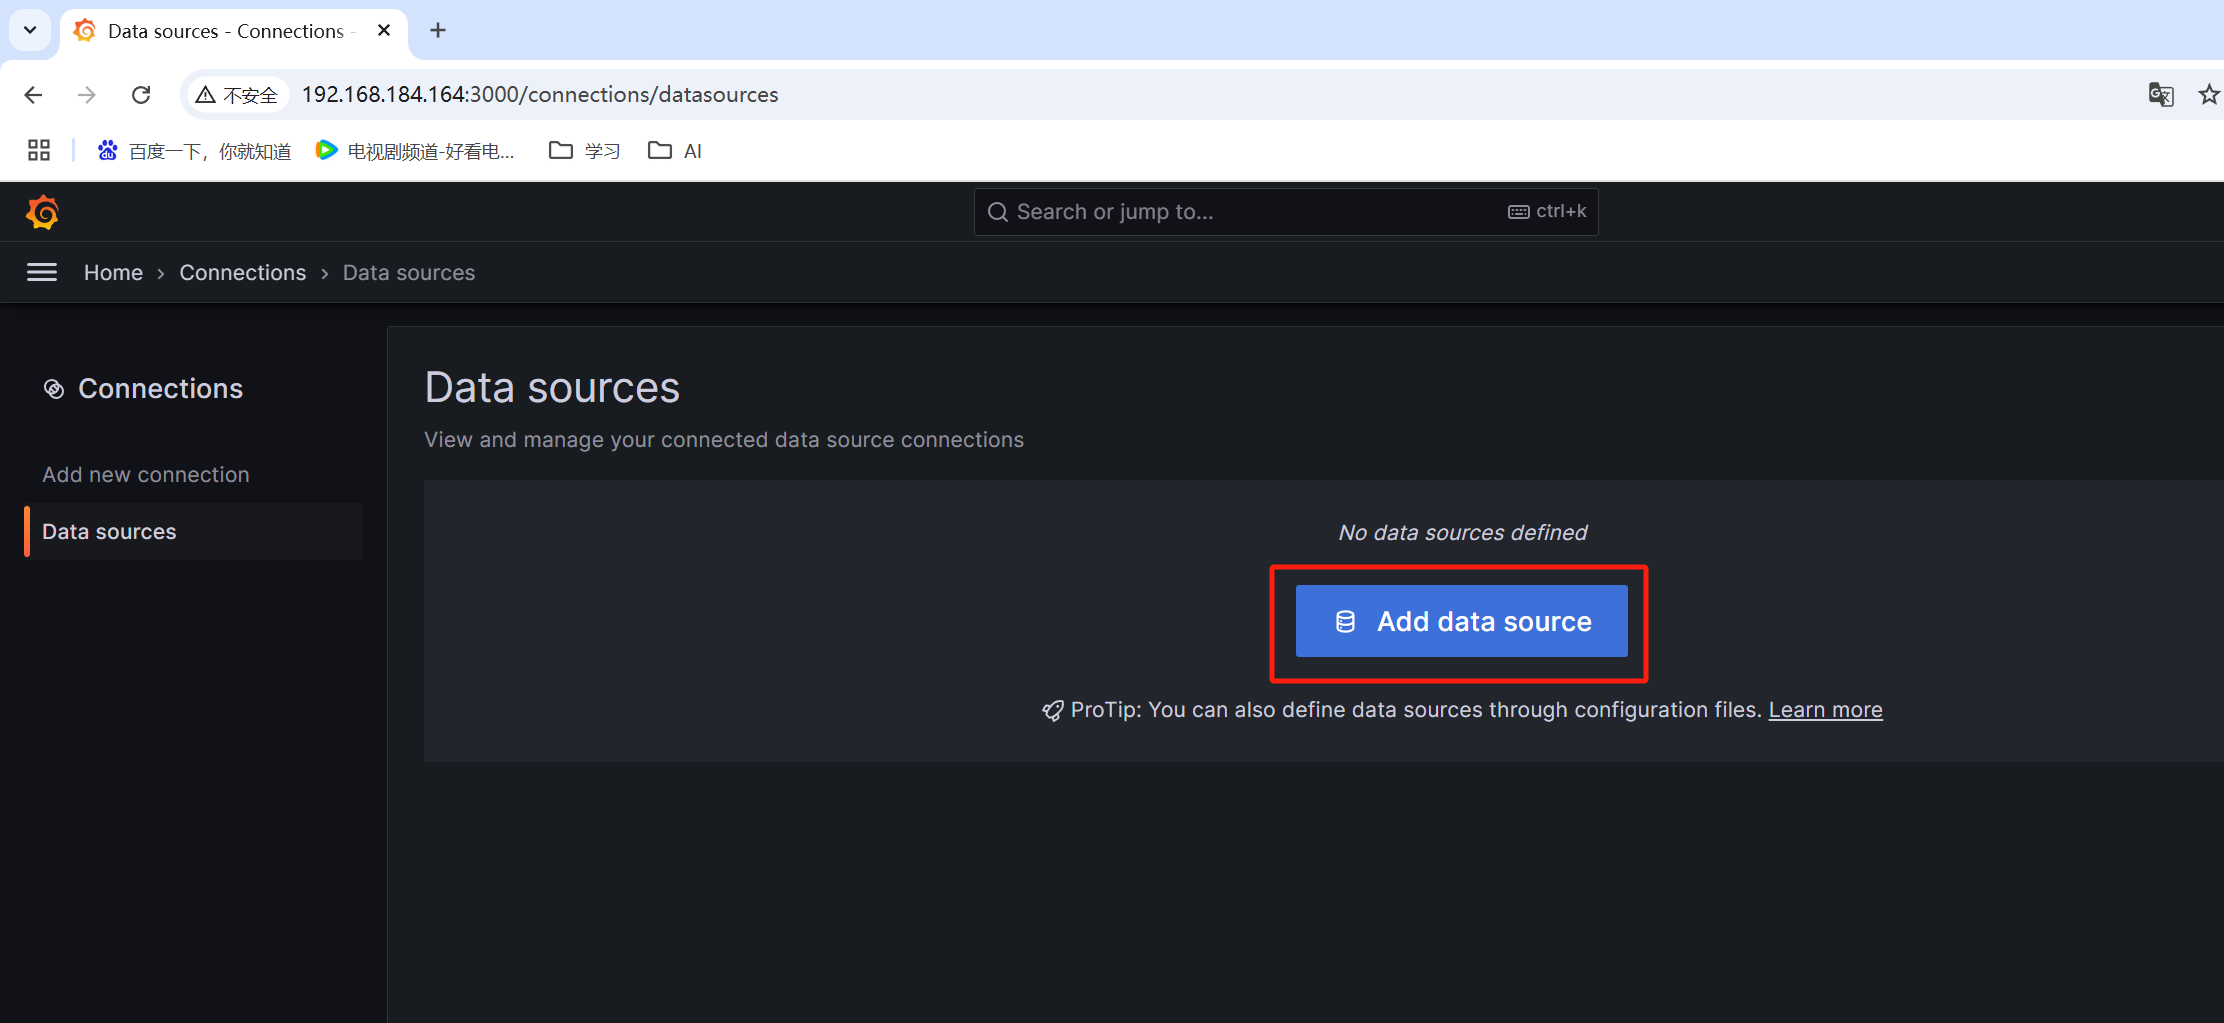
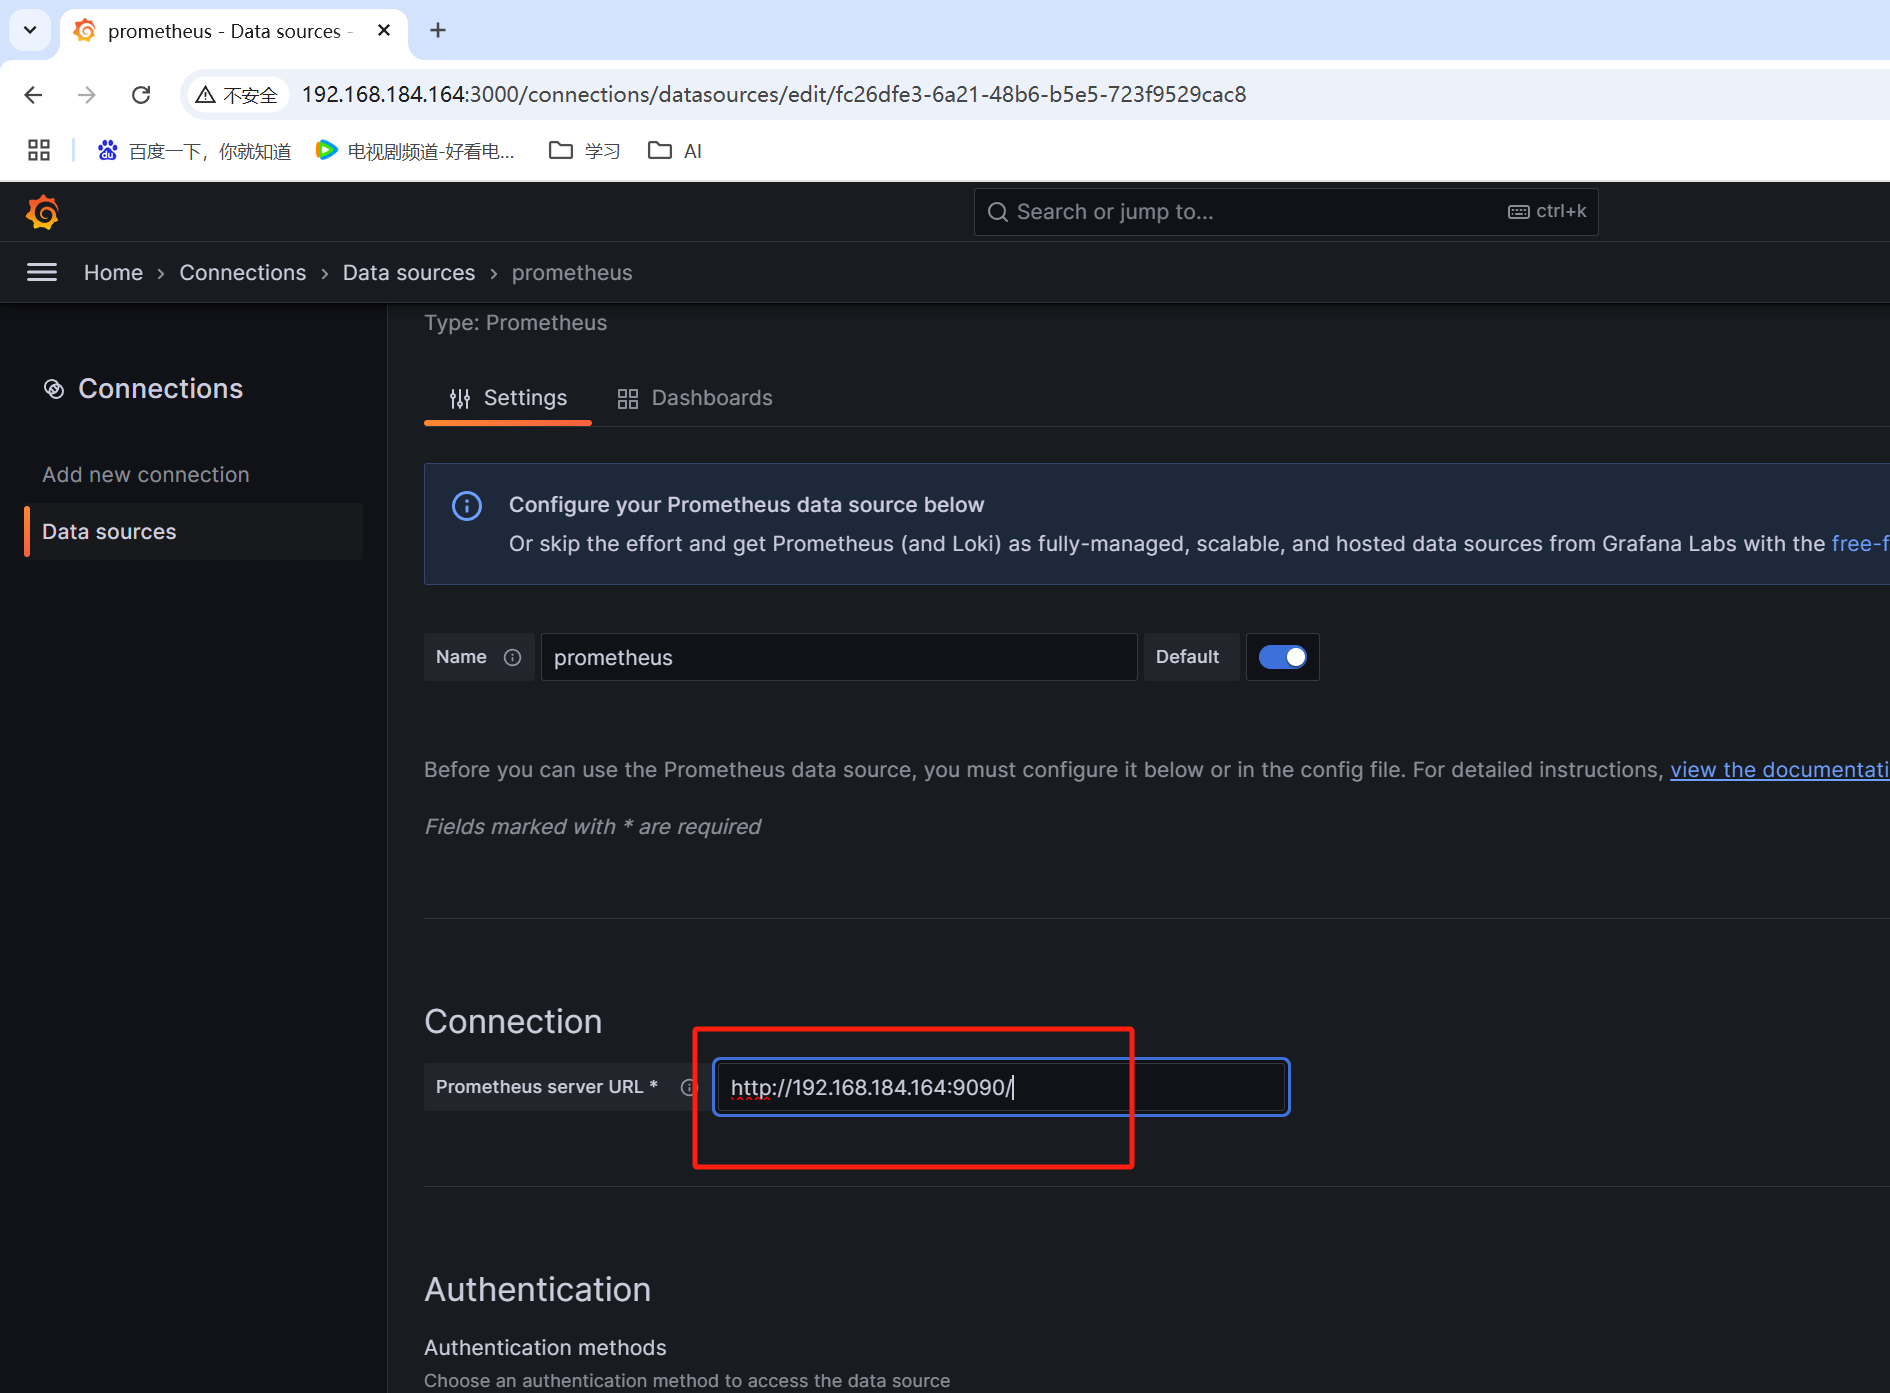
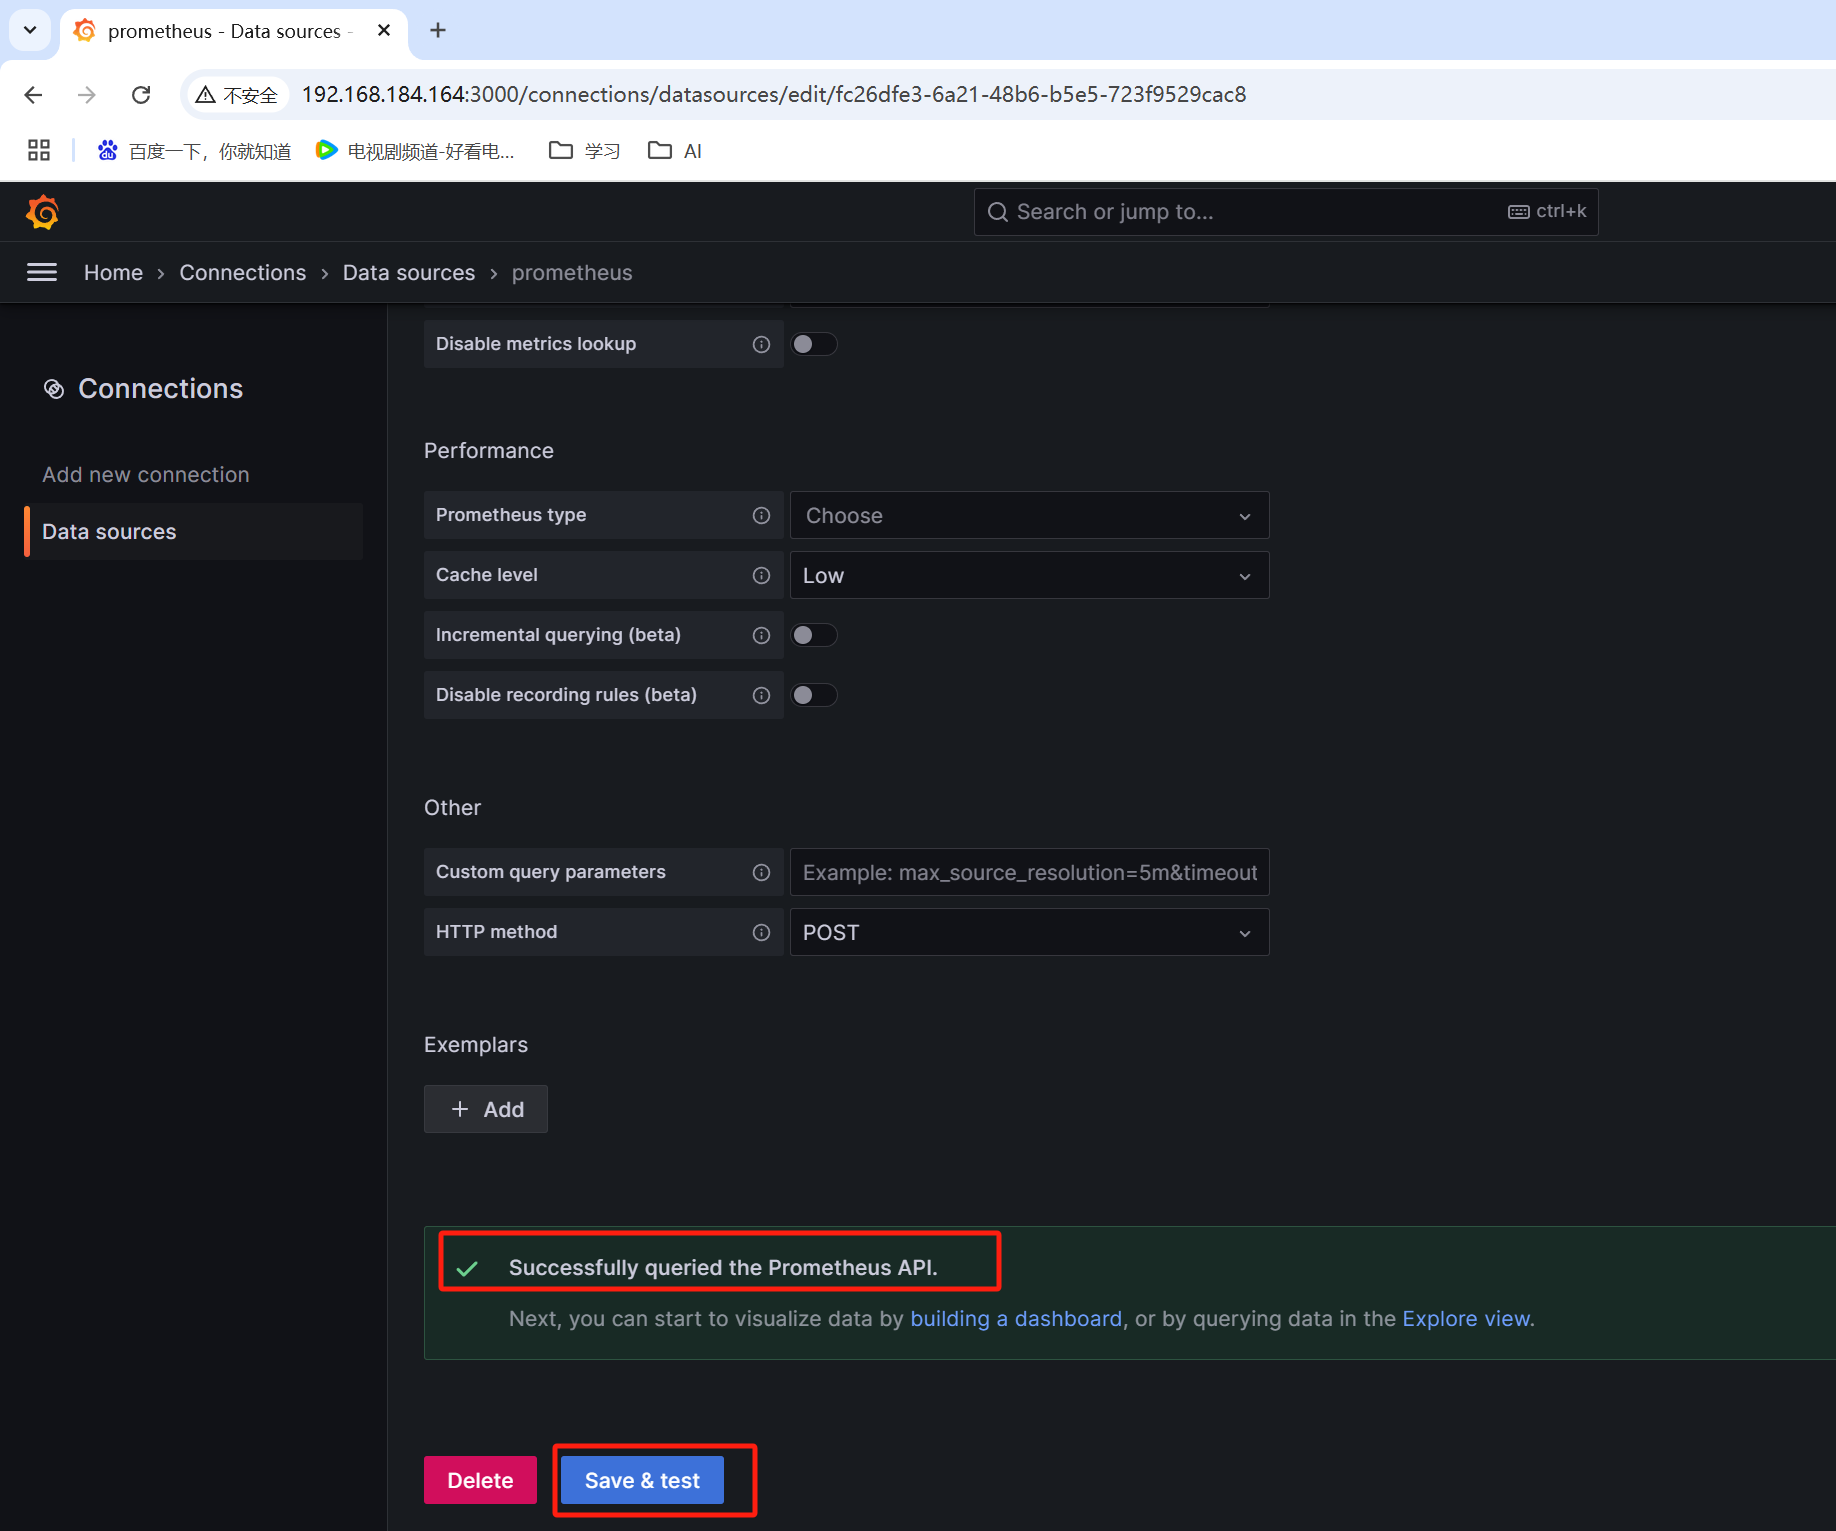
(1)添加数据源
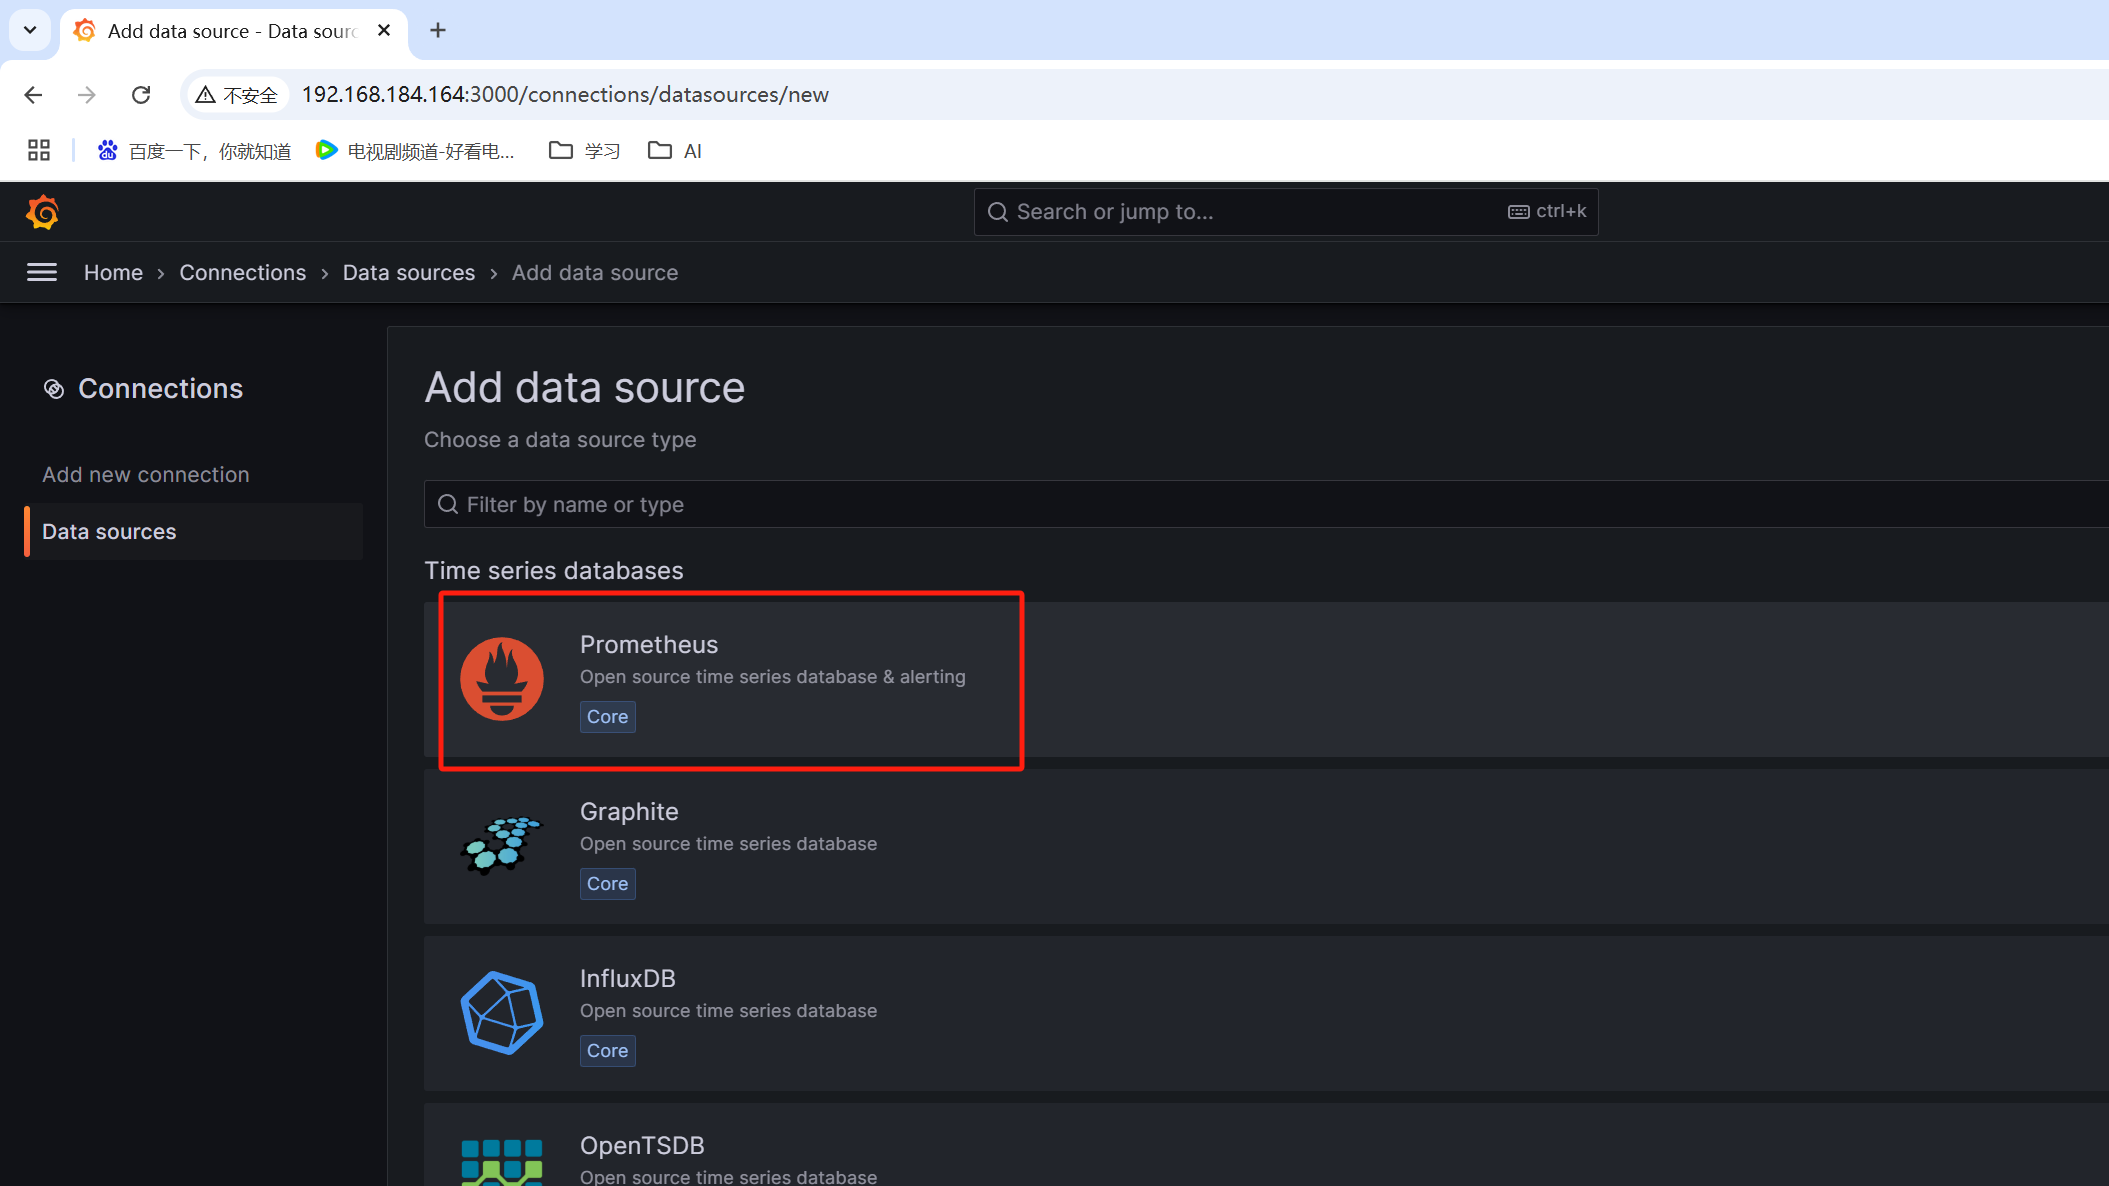
输入prometheus的地址:
http://192.168.184.164:9090/
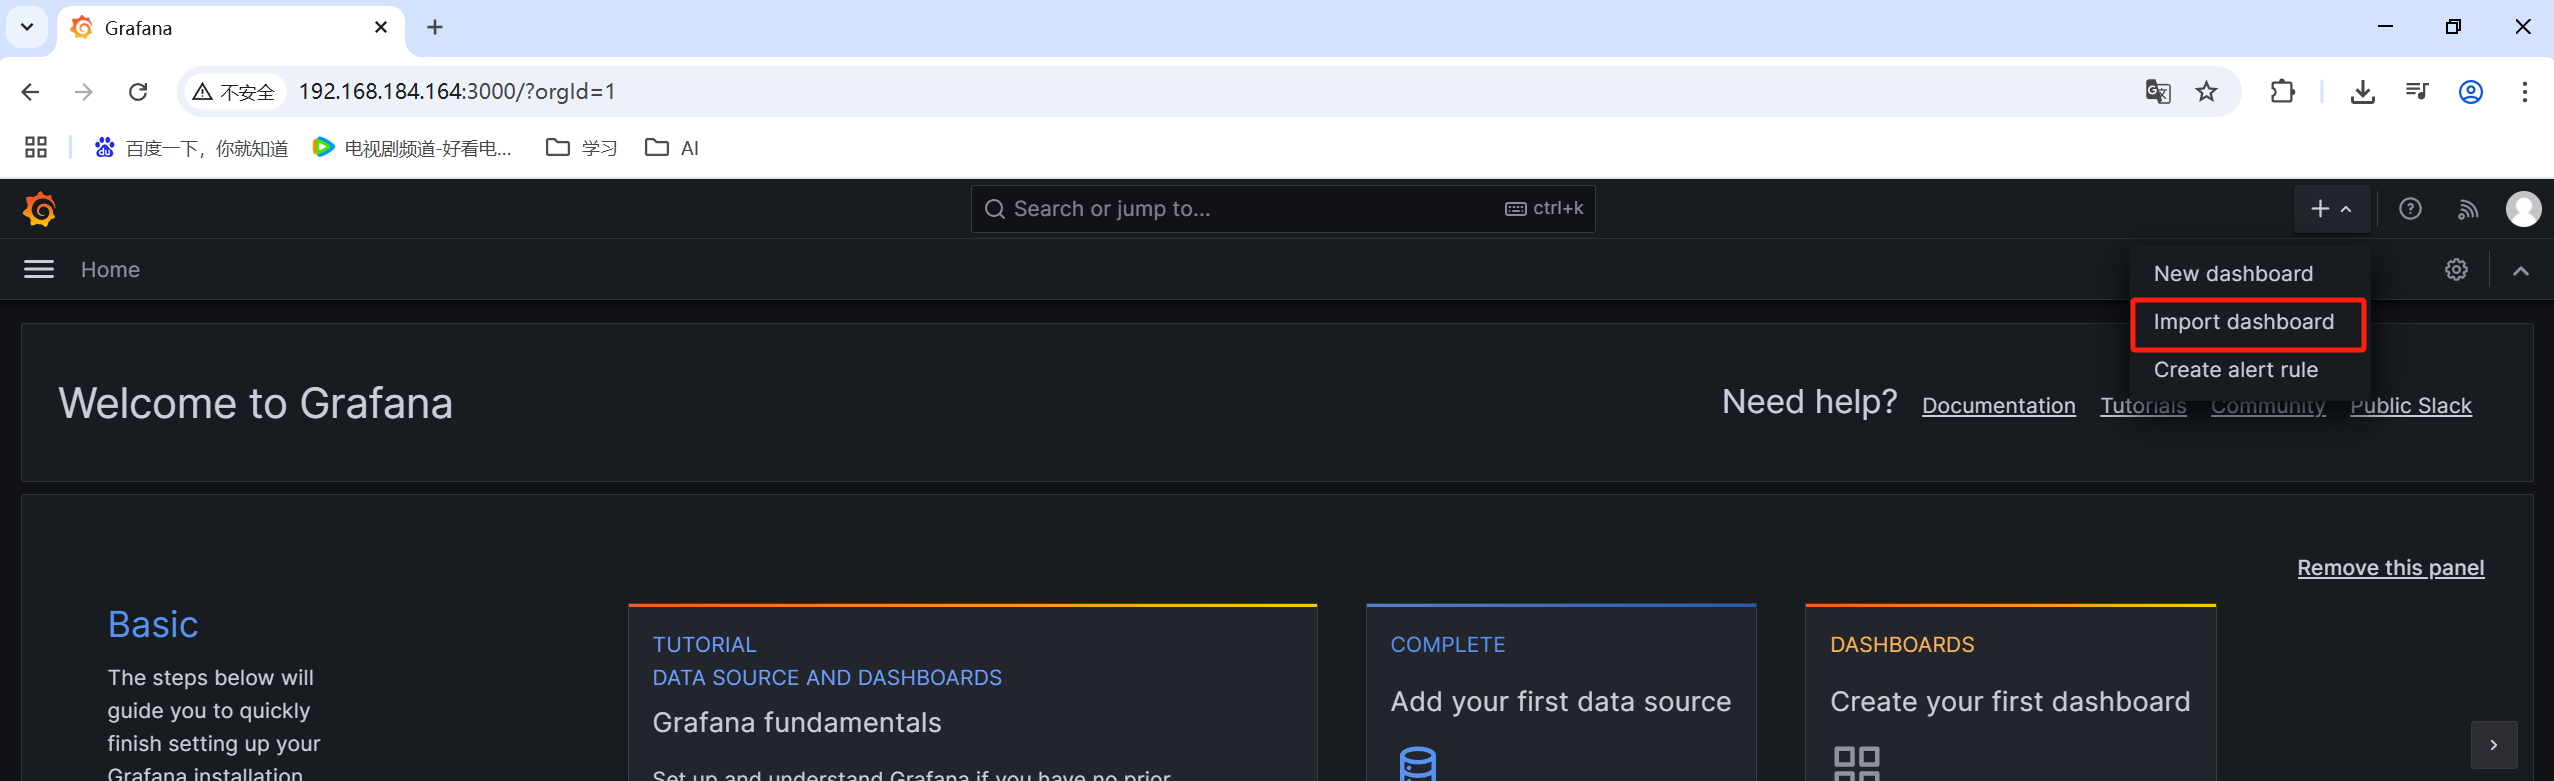
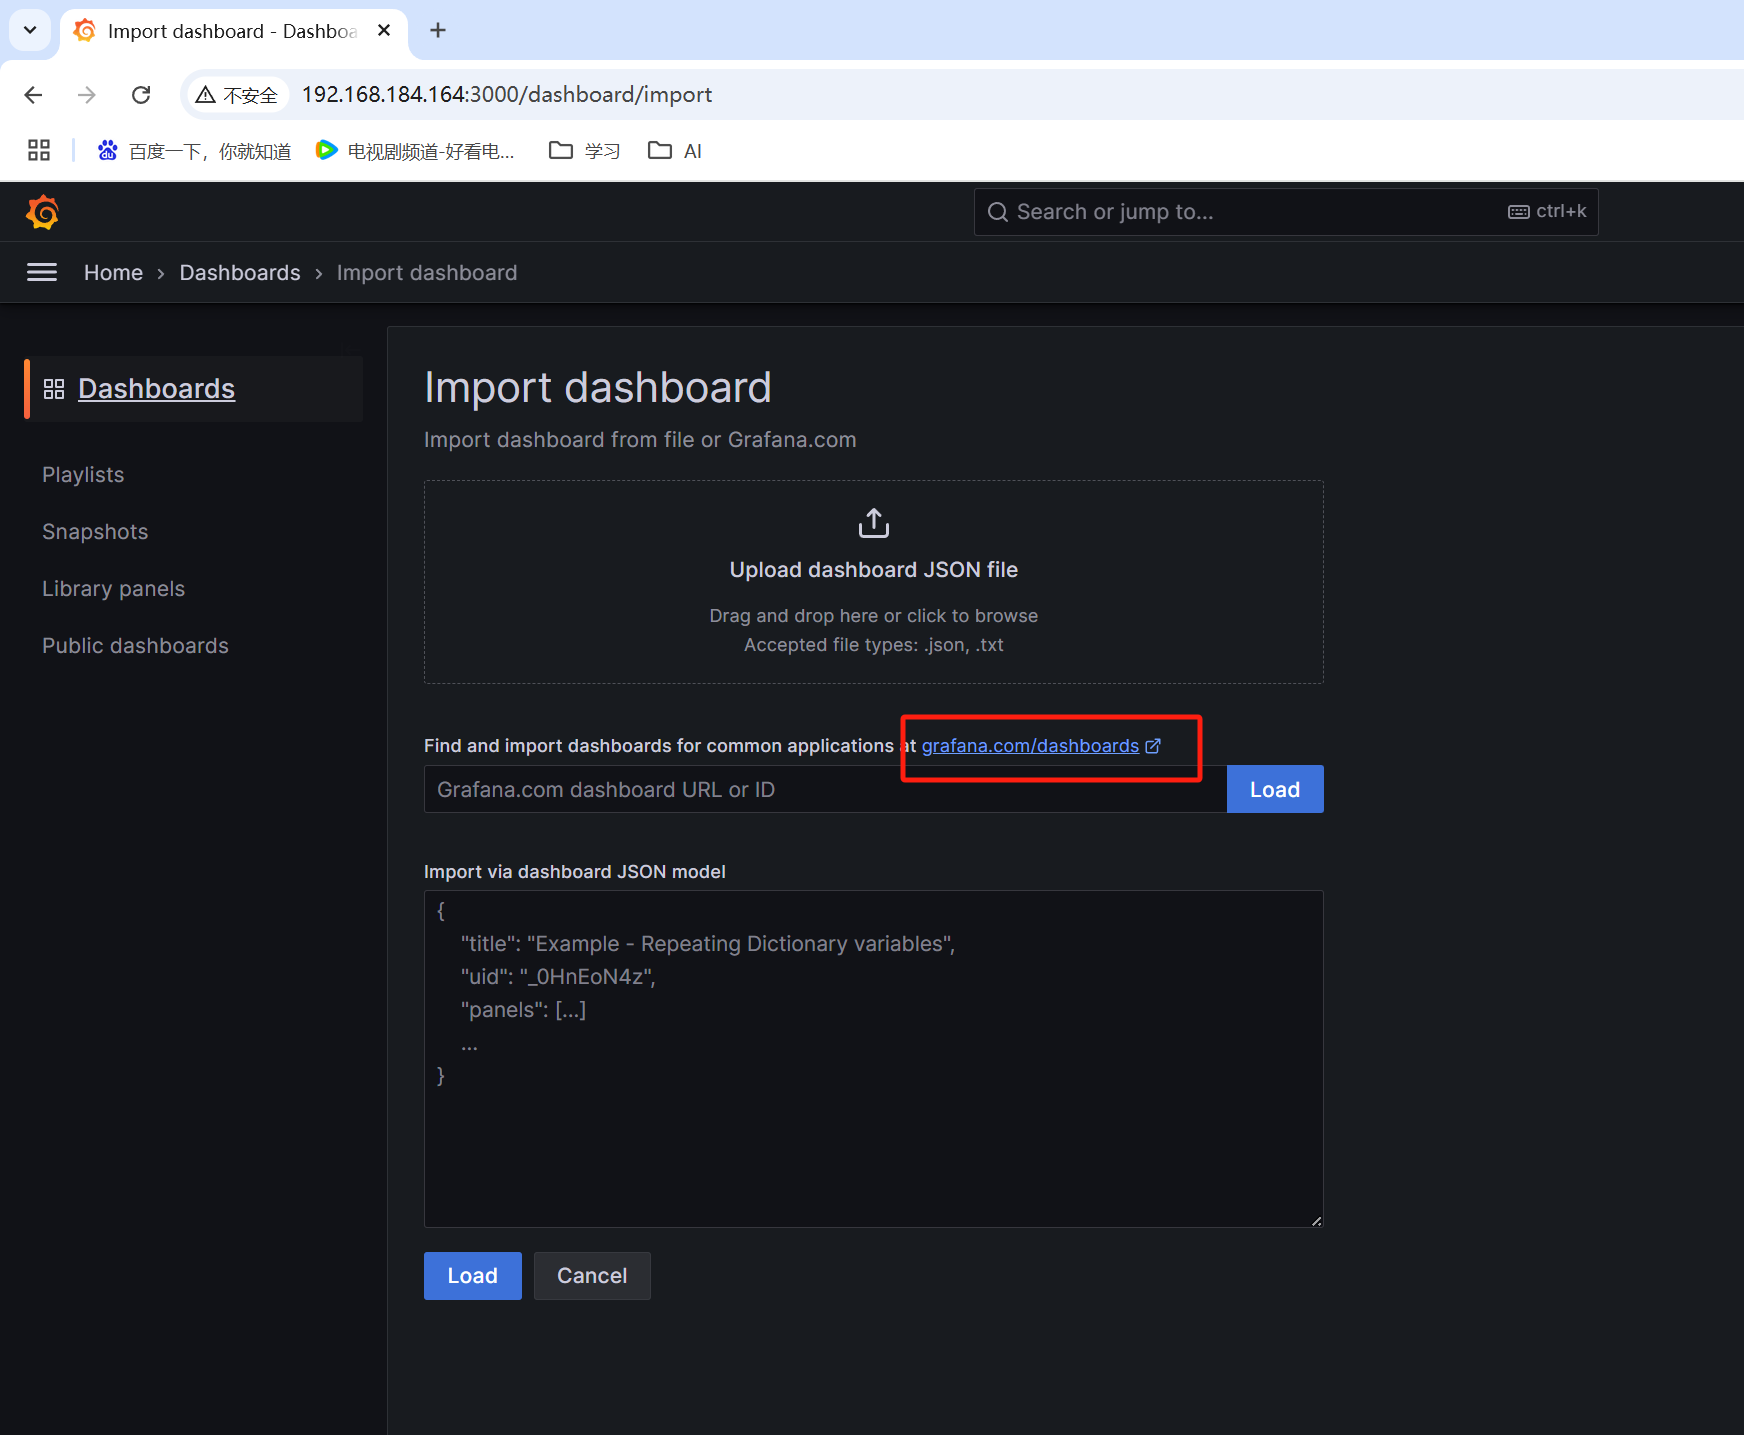
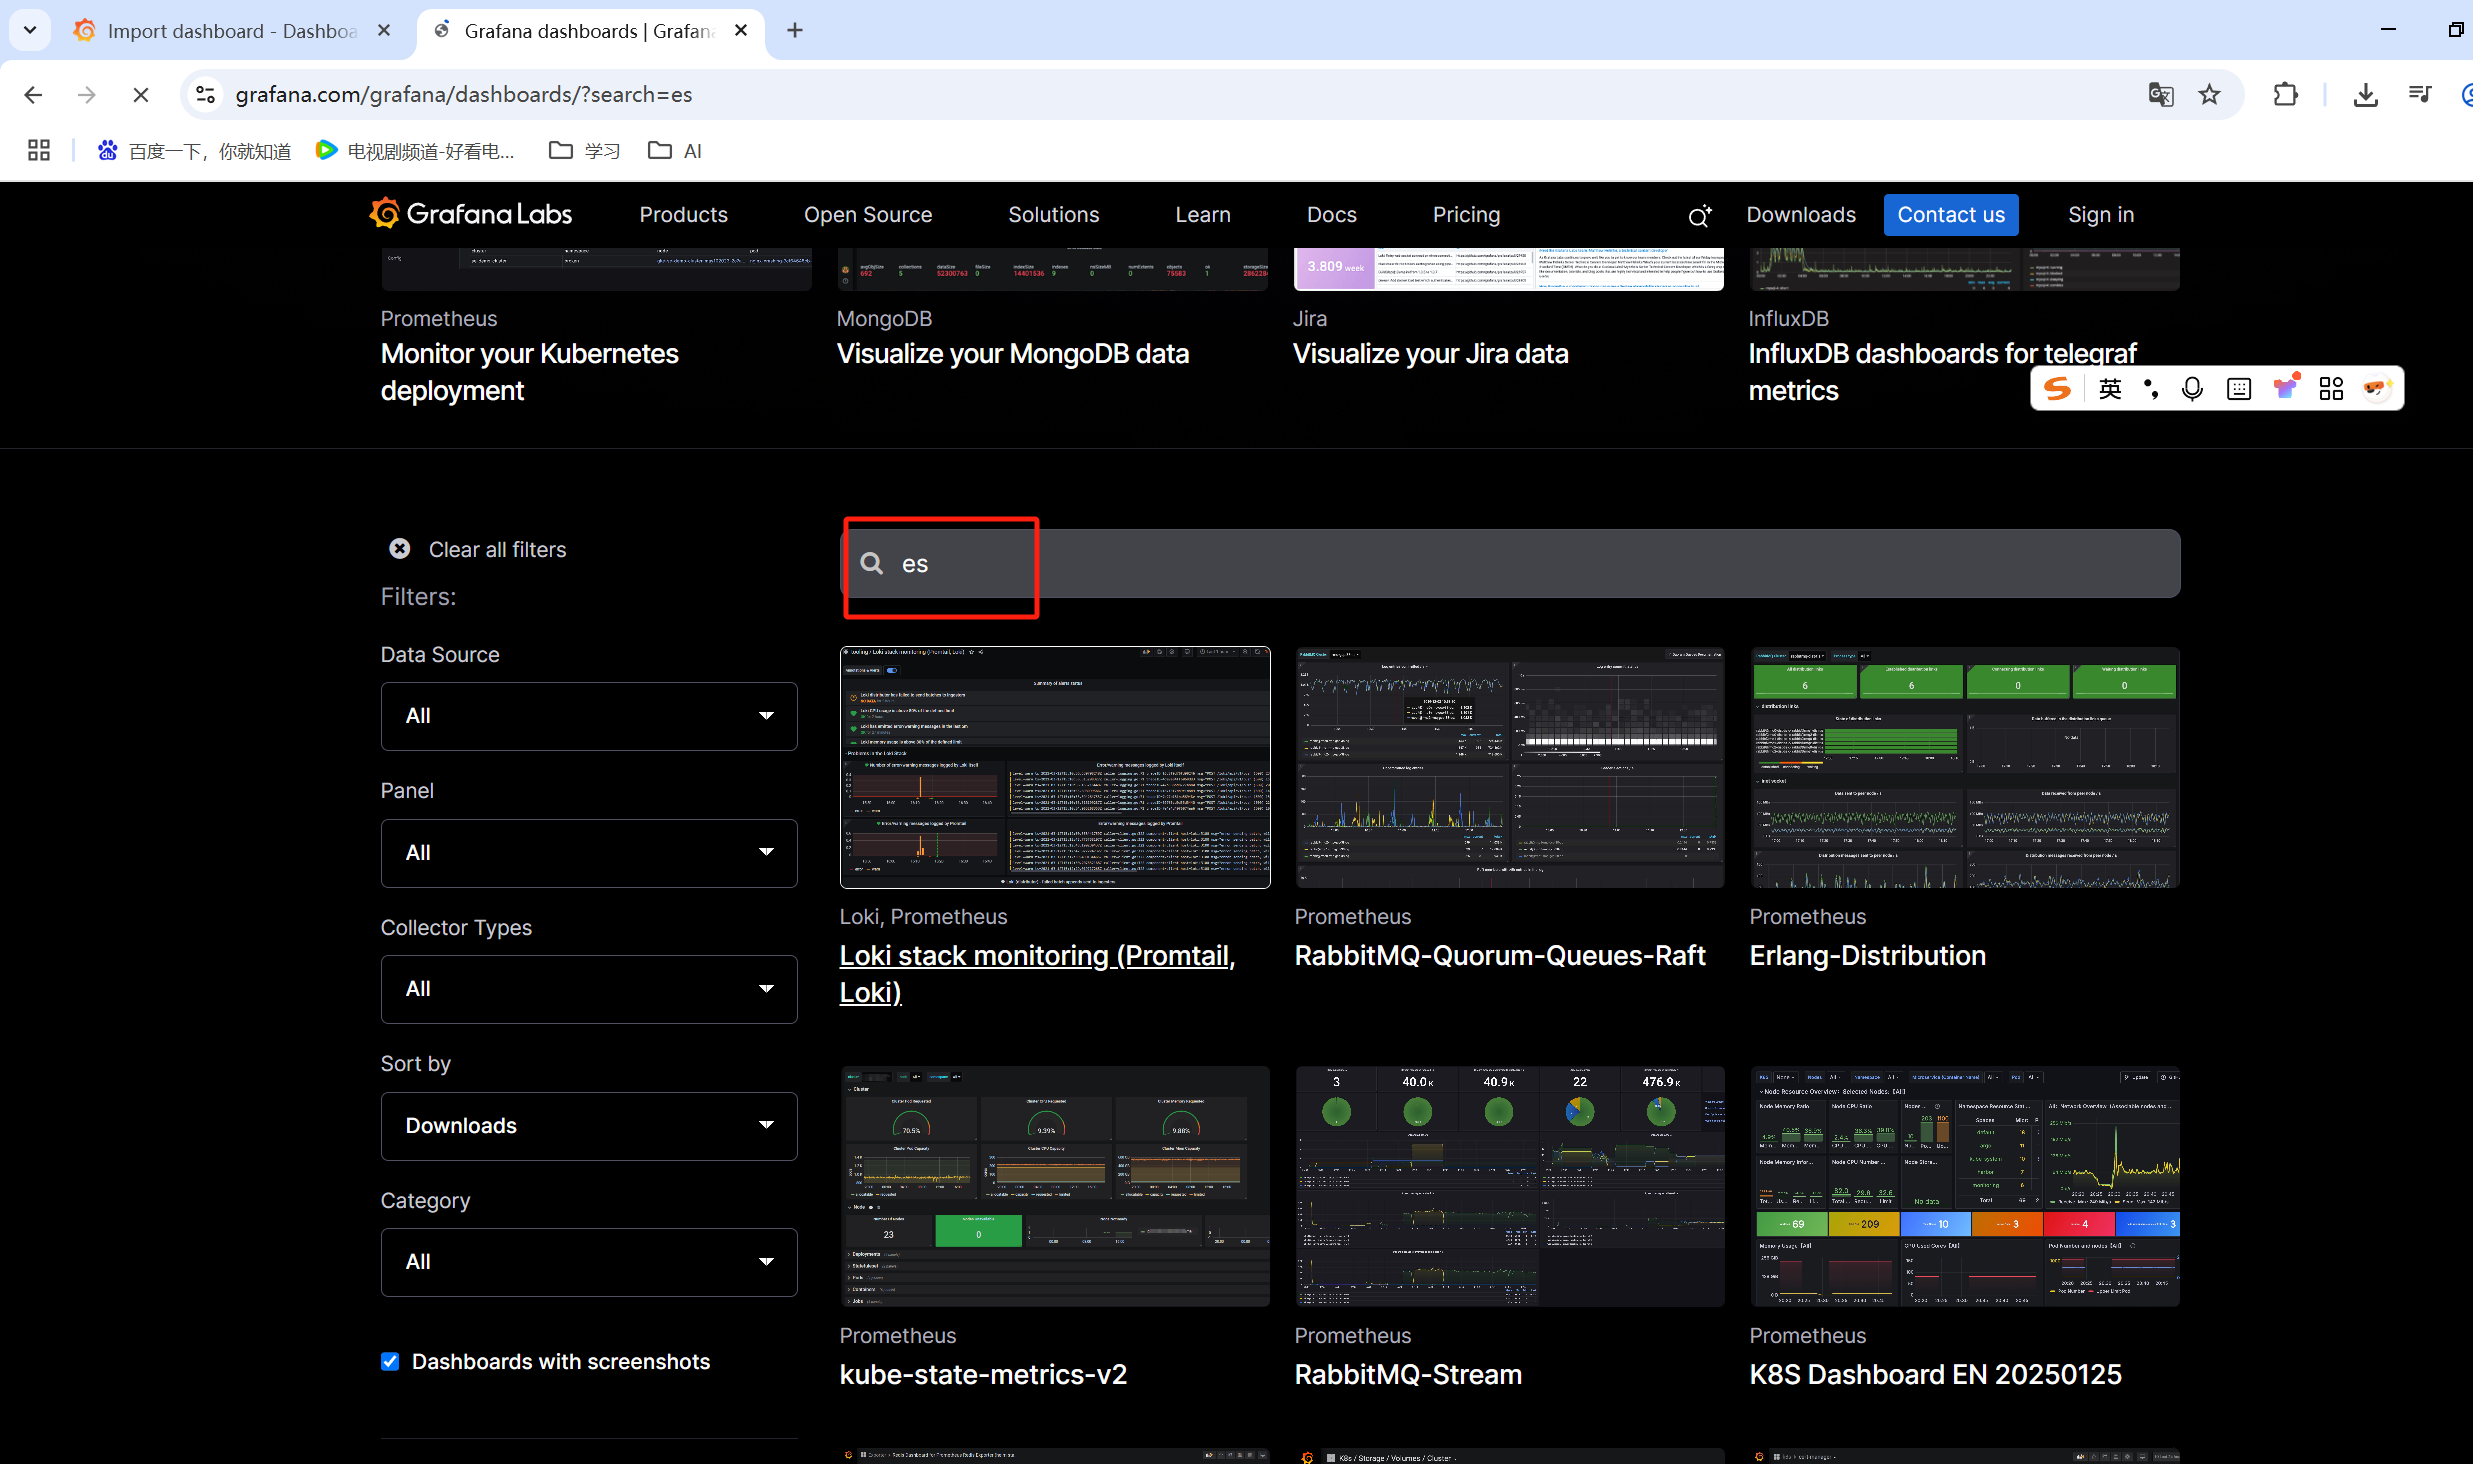
(2)导入模版
这里我一般选择14191这个模版
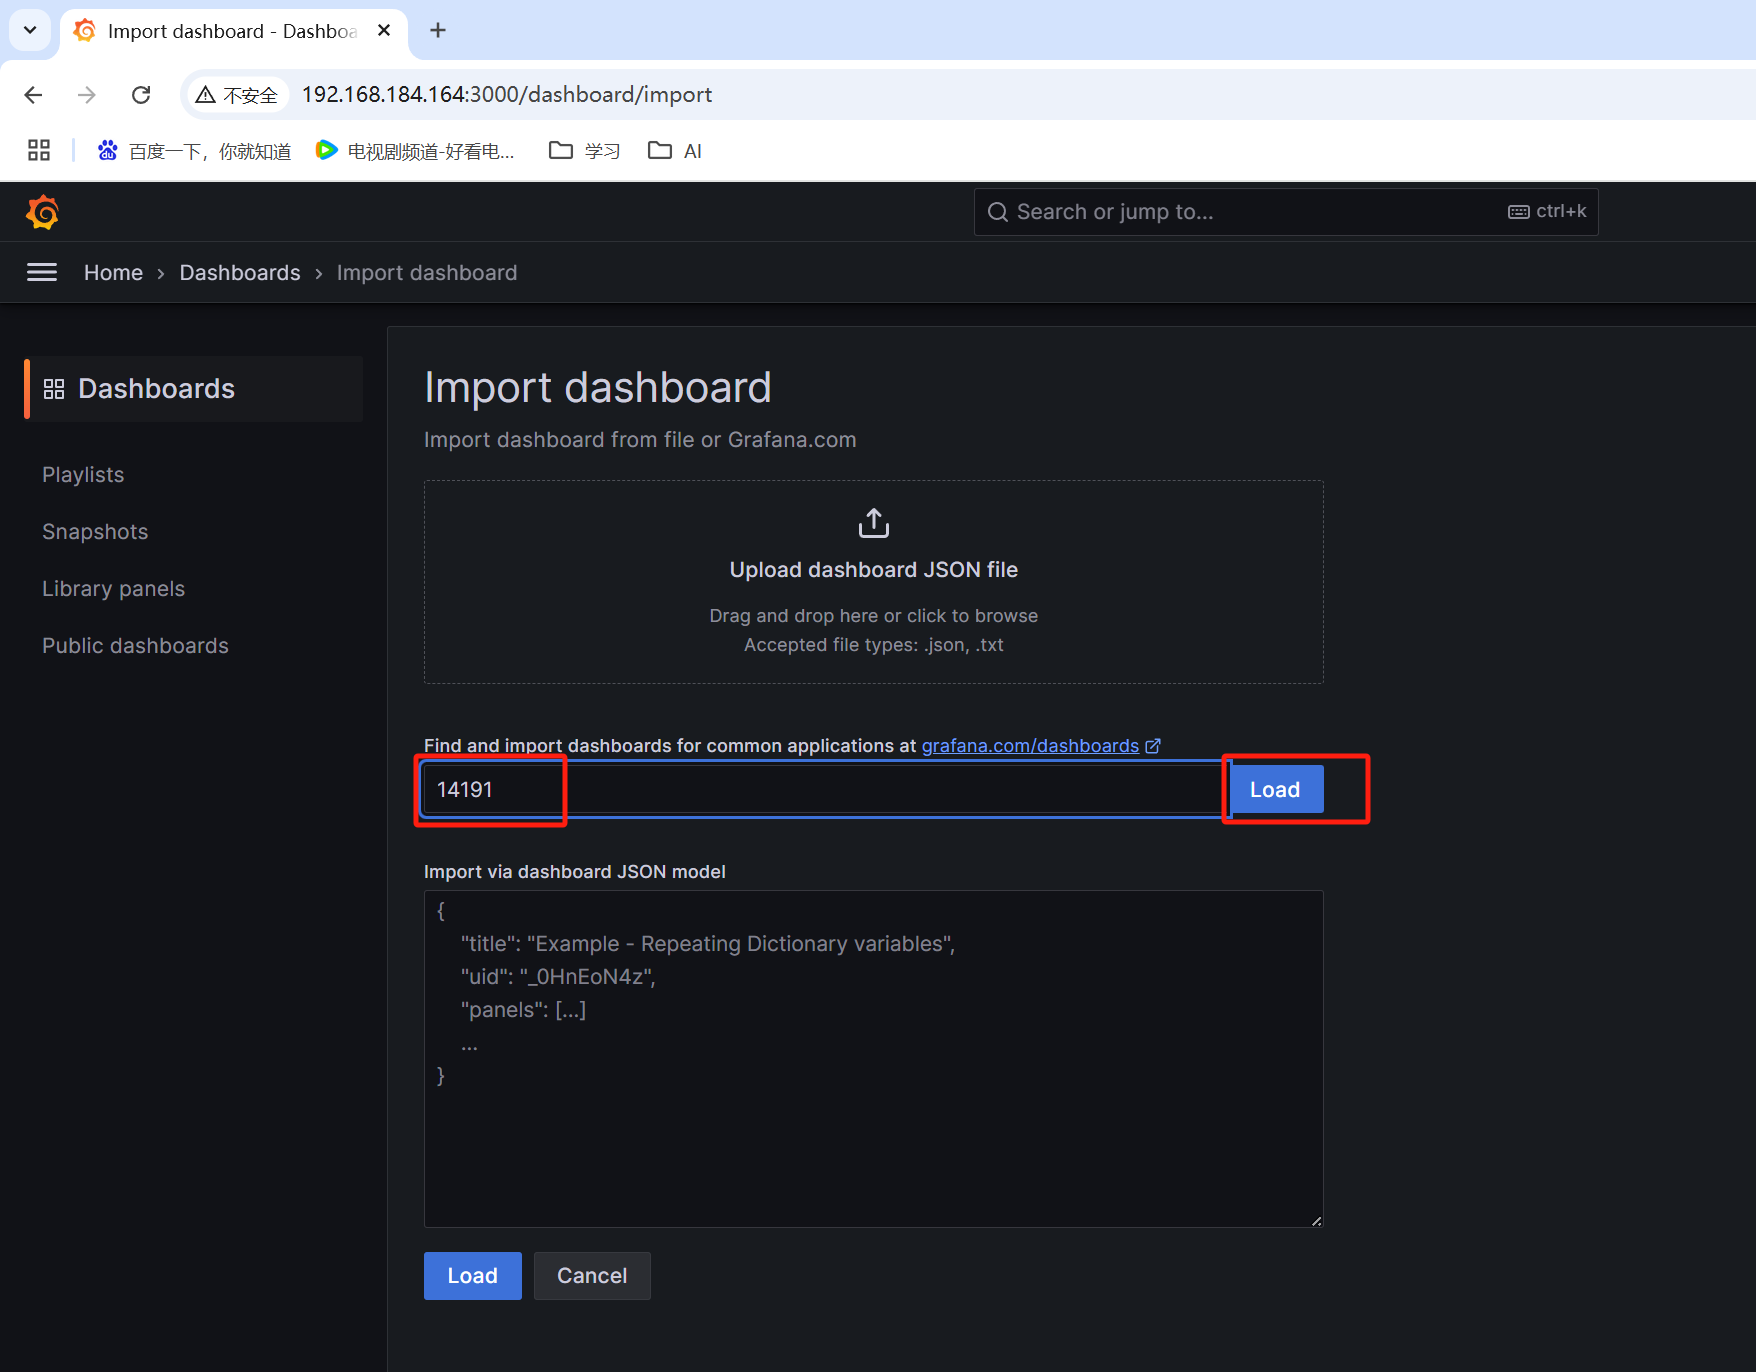
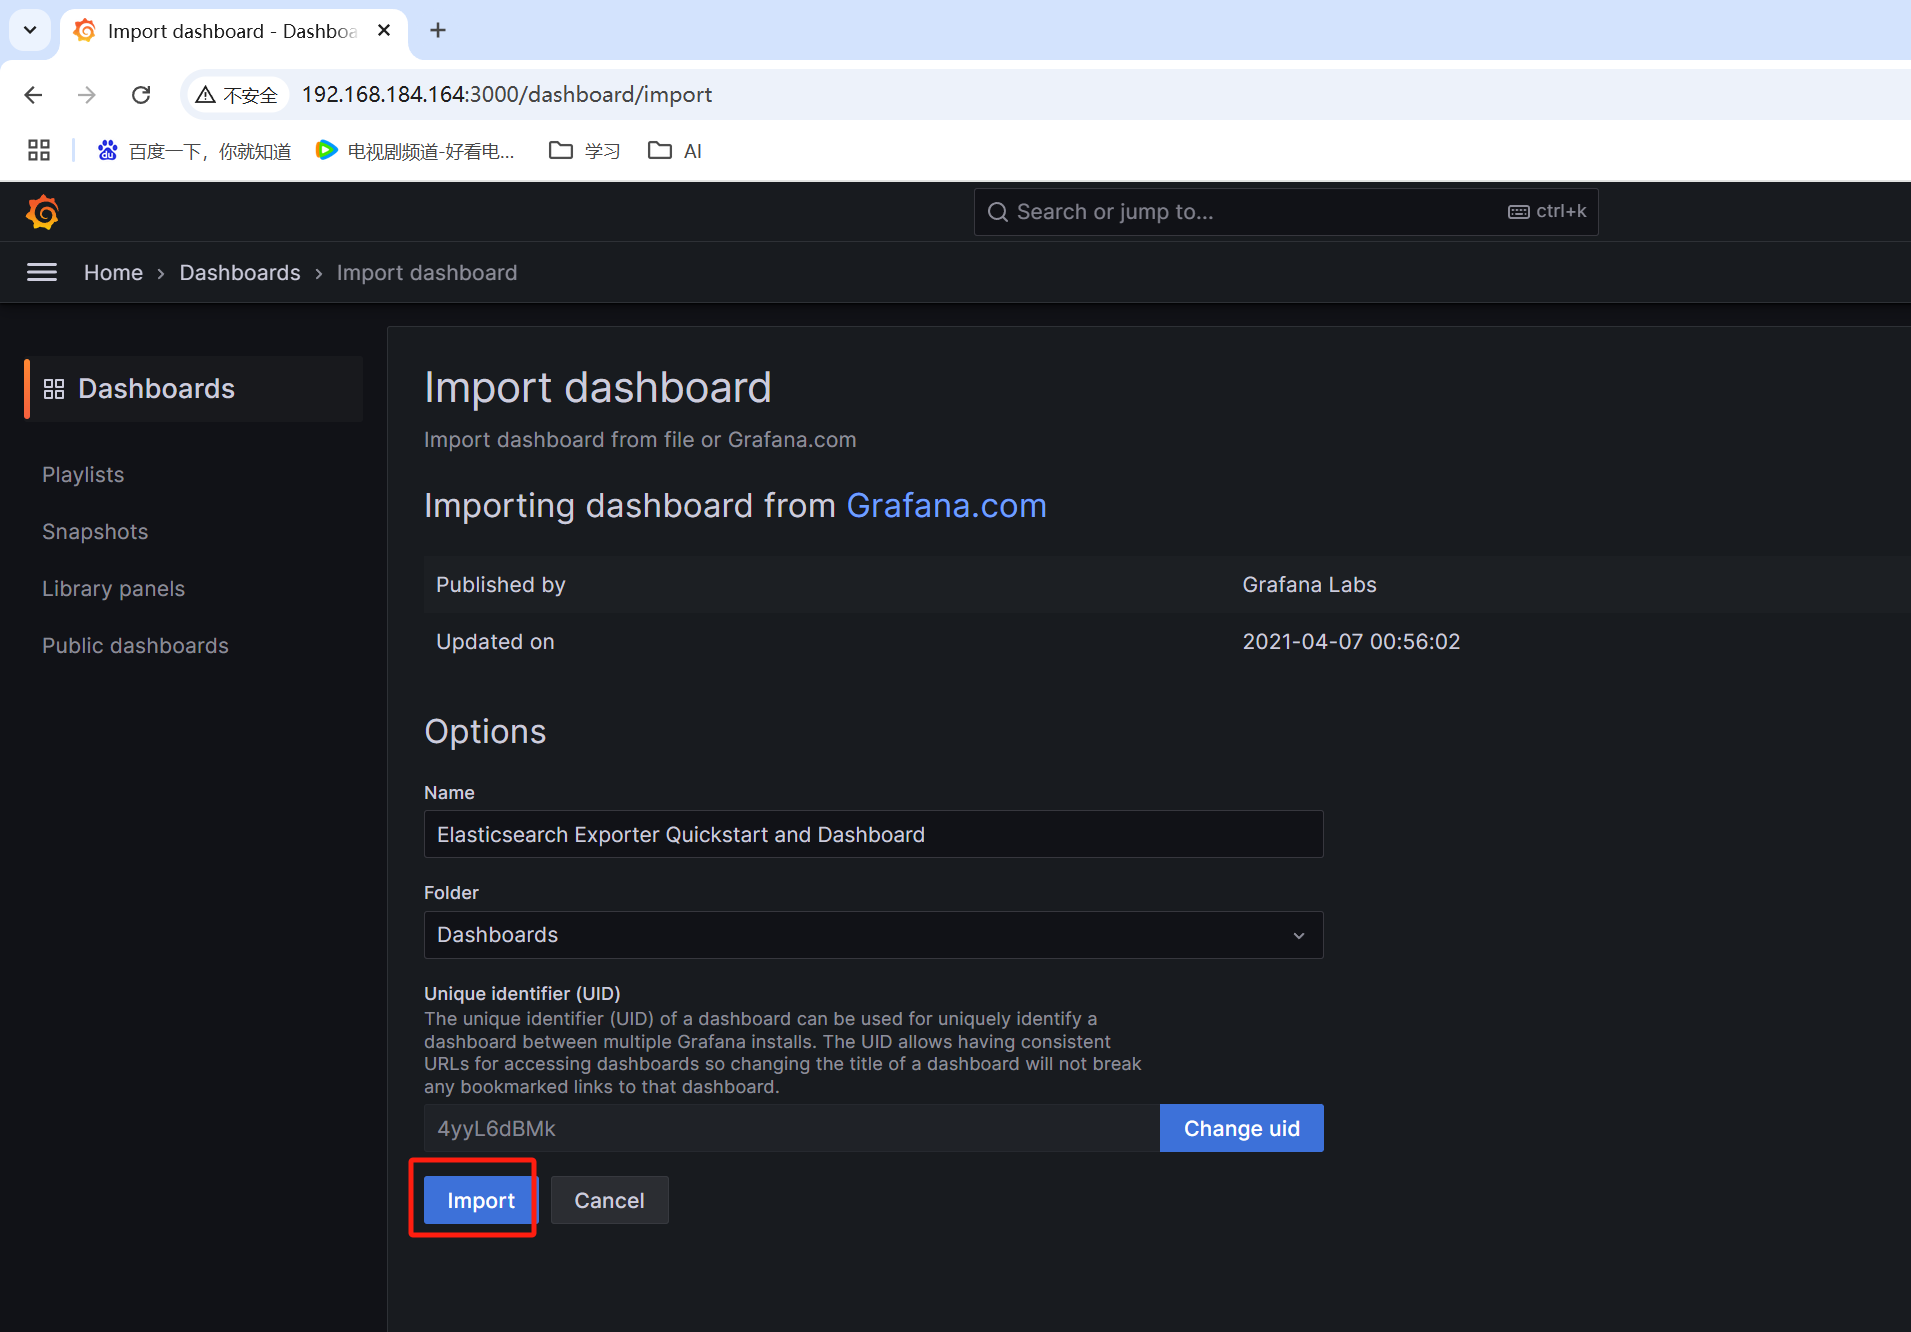
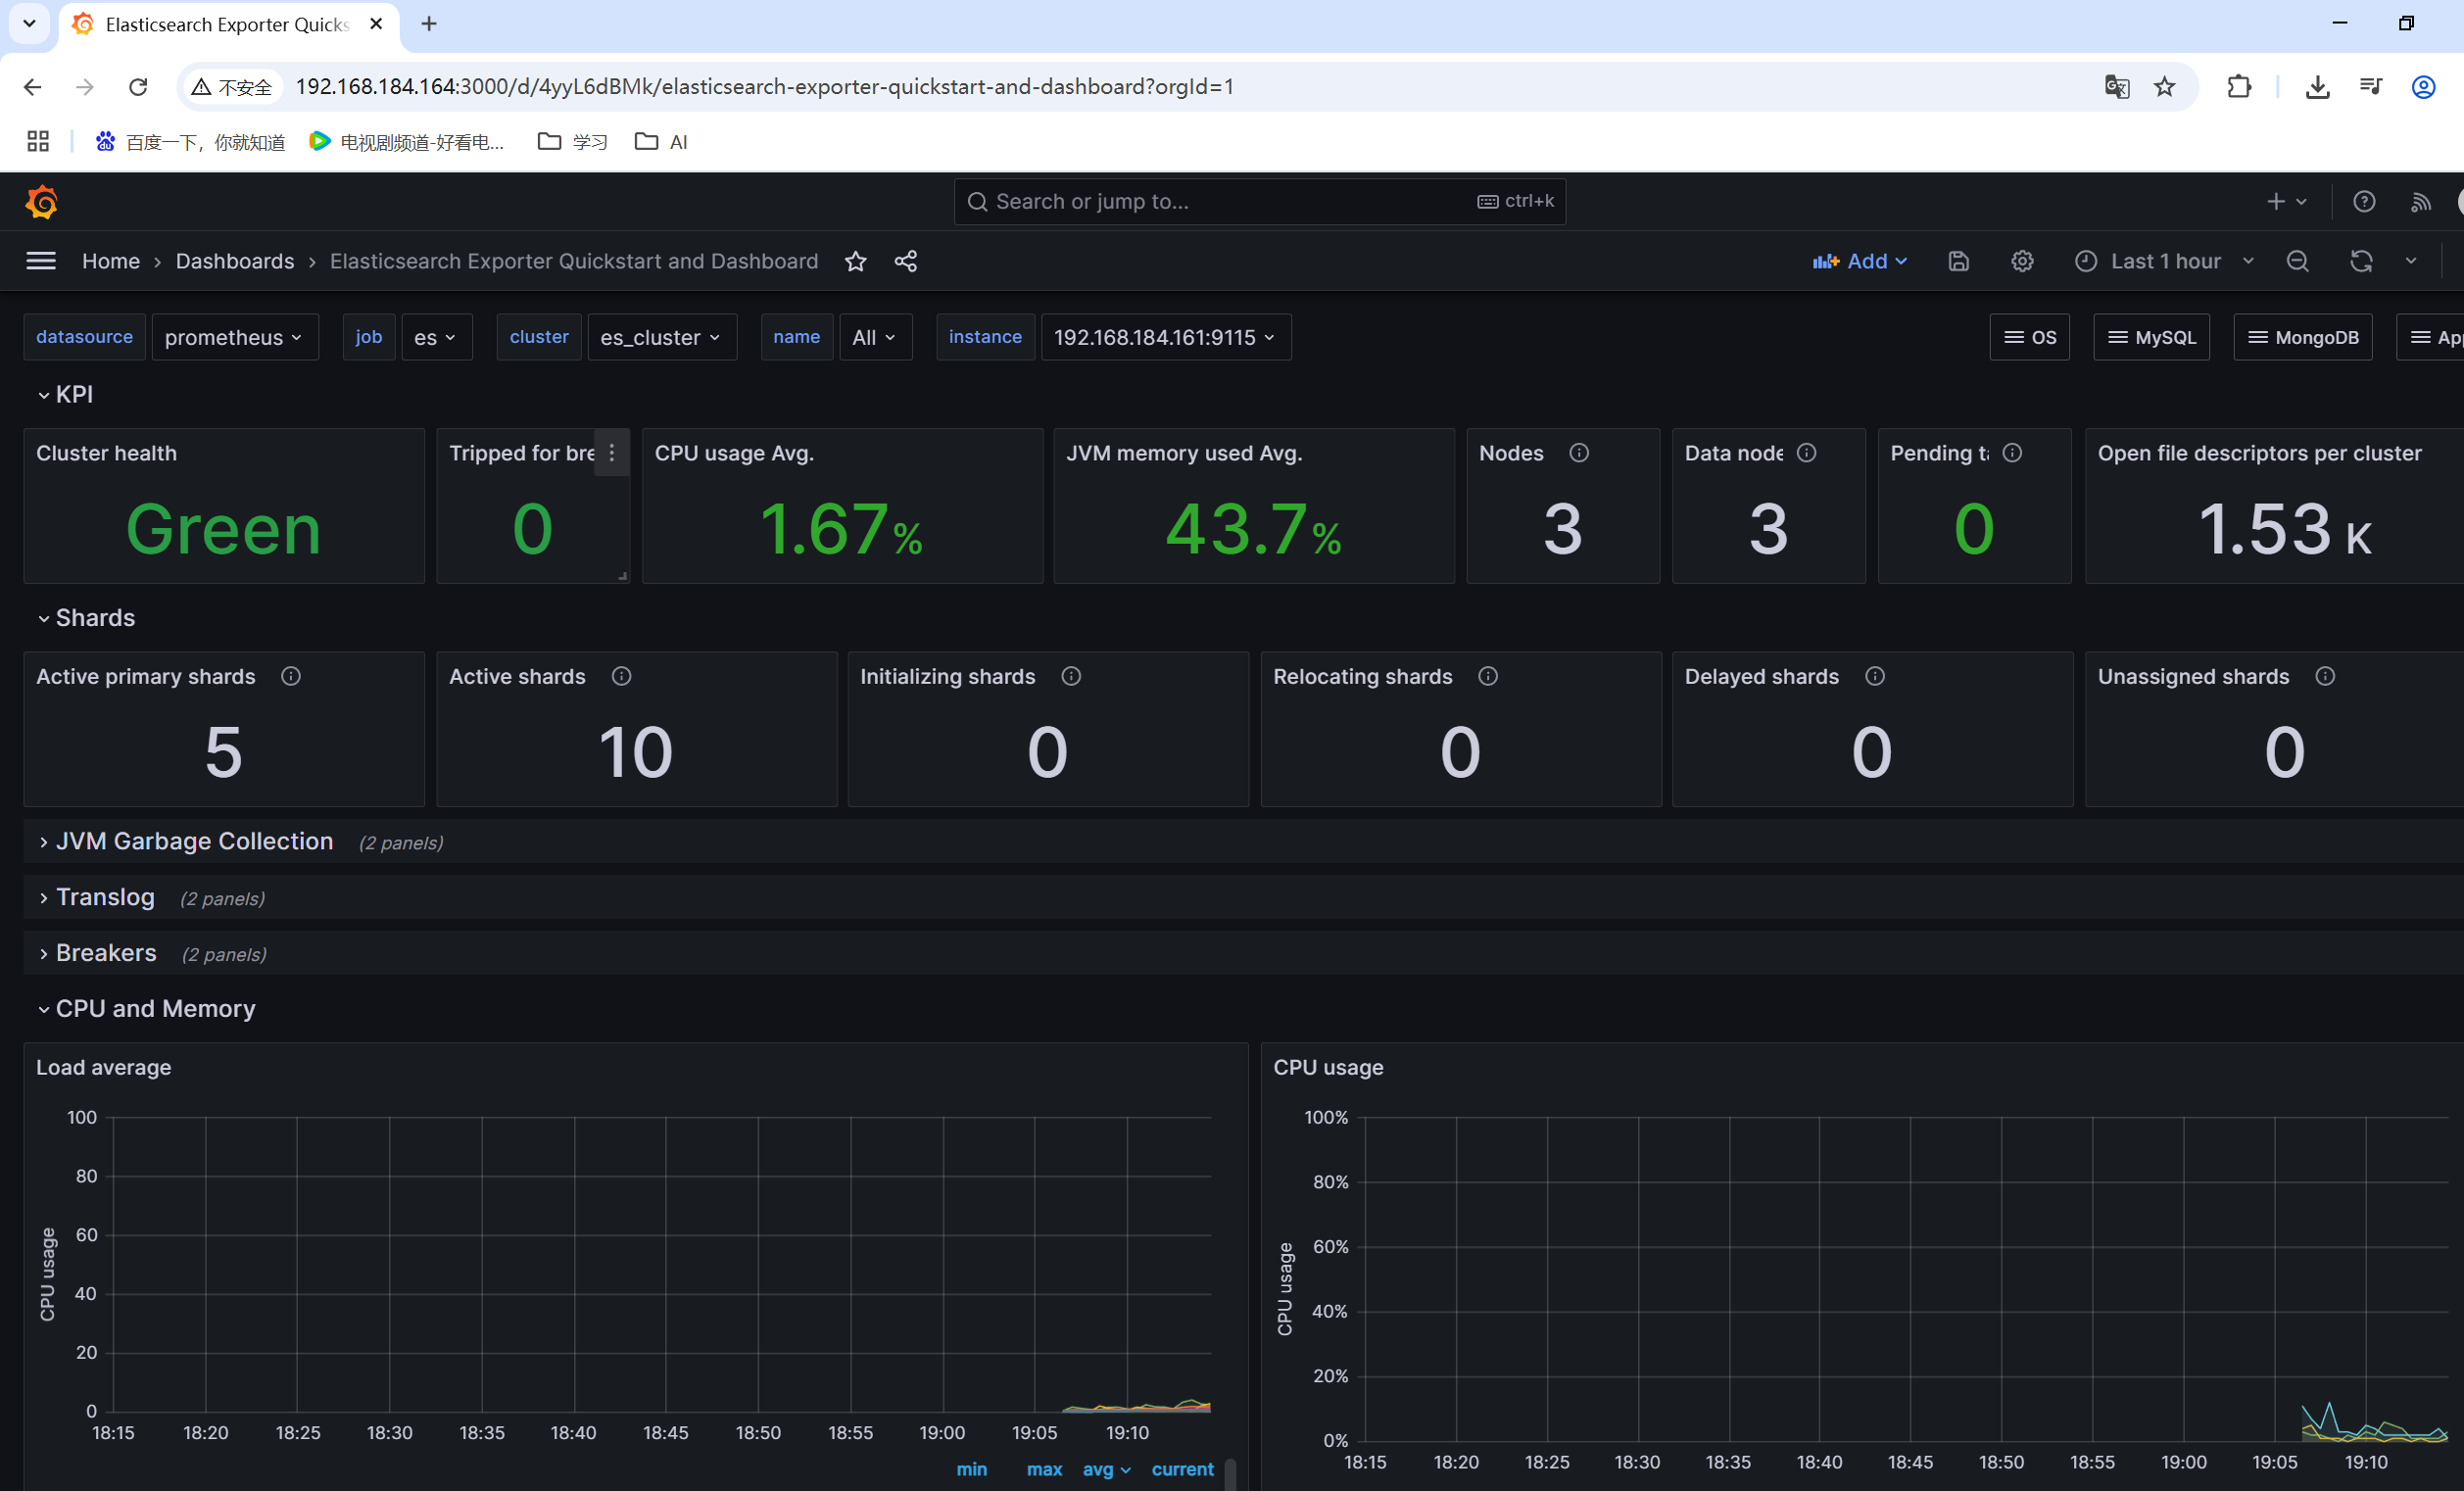
也可以选择其他的模版


 1281
1281

 被折叠的 条评论
为什么被折叠?
被折叠的 条评论
为什么被折叠?
 到【灌水乐园】发言


