


查看服务状态
#查看主程序状态
[root@nagios-server services]# service nagios status
nagios (pid 29350) is running...
#查看NRPE端口
[root@nagios-server services]# netstat -tlnp |grep 5666
tcp        0      0 :::5666                     :::*                        LISTEN      26747/xinetd
#查看NRPE服务状态
[root@nagios-server services]# service xinetd status
xinetd (pid  26747) is running...
重启主服务
修改配置文件
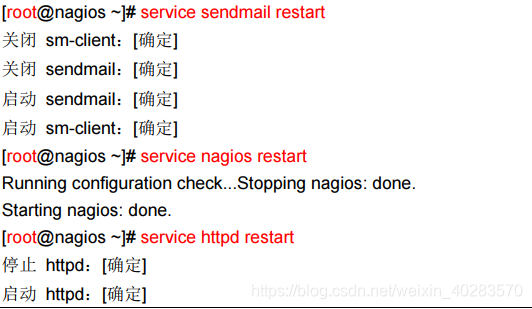
完成修改配置文件后要执行 nagios -v 命令检查主配置文件是否有错误。没有错误则重启 sendmail、nagios、http 服务使监控对象配置文件生效。
[root@nagios-server services]# /usr/local/nagios/bin/nagios -v /usr/local/nagios/etc/nagios.cfg

Nagios Core 4.2.4
Copyright (c) 2009-present Nagios Core Development Team and Community Contributors
Copyright (c) 1999-2009 Ethan Galstad
Last Modified: 12-07-2016
License: GPL

Website: https://www.nagios.org
Reading configuration data...
   Read main config file okay...
   Read object config files okay...

Running pre-flight check on configuration data...

Checking objects...
        Checked 228 services.
        Checked 61 hosts.
        Checked 15 host groups.
        Checked 0 service groups.
        Checked 3 contacts.
        Checked 3 contact groups.
        Checked 29 commands.
        Checked 2 time periods.
        Checked 0 host escalations.
        Checked 0 service escalations.
Checking for circular paths...
        Checked 61 hosts
        Checked 0 service dependencies
        Checked 0 host dependencies
        Checked 2 timeperiods
Checking global event handlers...
Checking obsessive compulsive processor commands...
Checking misc settings...

Total Warnings: 0
Total Errors:   0


Things look okay - No serious problems were detected during the pre-flight check
手动重启NRPE
先关闭xinetd服务,然后手动重启NRPE
service xinetd stop
有时候会起不来
netstat -lantp | grep 5666
查出进程号杀掉进程
kill -9 进程号
手动启动nrpe:/usr/local/nagios/bin/nrpe -c /usr/local/nagios/etc/nrpe.cfg -d
测试NRPE
/usr/local/nagios/libexec/check_nrpe
这个检测NRPE版本的命令,可以用来客户端检测本机的NRPE是否正常,也可以在服务端上面检测客户端的NRPE是否正常,但无法用来检测服务端本身NRPE是否正常。
[root@nagios-server hosts]# /usr/local/nagios/libexec/check_nrpe -H 127.0.0.1
CHECK_NRPE: Error - Could not complete SSL handshake.
本机调试方法
这里主要是指linux 客户端测试本机命令
[root@app1 ~]# cat /usr/local/nagios/etc/nrpe.cfg
内容片段如下,这里都是执行的命令,本地执行看看效果
# 系统启动运行时长
command[check_uptime]=/usr/local/nagios/libexec/check_uptime -v

# 监控CPU负载情况
command[check_load]=/usr/local/nagios/libexec/check_load -w 5.0,4.0,3.0 -c 10.0,6.0,4.0

# 监控交换分区利用率
# 剩余空间少于20%则为WARNING状态,少于10%则为CRITICAL状态。
command[check_swap]=/usr/local/nagios/libexec/check_swap -w 20% -c 10%

# 监控当前登陆用户数
# 有用户登录则为WARNING状态,超过1个用户登录则为CRITICAL状态。
command[check_users]=/usr/local/nagios/libexec/check_users -w 3 -c 5

# 监控/分区使用率
# 剩余空间少于20%则为WARNING状态,少于10%则为CRITICAL状态
command[check_disk_sda3]=/usr/local/nagios/libexec/check_disk -w 20% -c 10% -p /dev/sda3

# 监控/data分区使用率
# 剩余空间少于20%则为WARNING状态,少于10%则为CRITICAL状态
command[check_disk_sdb1]=/usr/local/nagios/libexec/check_disk -w 20% -c 10% -p /dev/sdb1

# 监听所有进程的CPU使用率
# 任何进程CPU使用率超过80%则为WARNING状态,超过90%则为CRITICAL状态。
command[check_procs_cpu]=/usr/local/nagios/libexec/check_procs -w 80 -c 90 --metric=CPU
#check memary
command[check_used_mem]=/usr/local/nagios/libexec/check_used_mem.sh 80 90
以check_uptime为例:
#通过check_nrpe 执行命令
[root@app1 ~]# /usr/local/nagios/libexec/check_nrpe -H 127.0.0.1 -c check_uptime
Uptime OK: 213 day(s) 2 hour(s) 59 minute(s) | uptime=306899.000000;;;
#直接执行命令
[root@app1 ~]# /usr/local/nagios/libexec/check_uptime -v
Uptime OK: 213 day(s) 2 hour(s) 59 minute(s) | uptime=306899.000000;;;


#测试NRPE
[root@app1 ~]# /usr/local/nagios/libexec/check_nrpe -H 127.0.0.1
NRPE v2.15
远程调试命令
#测试客户端的NRPE是否联通
[root@nagios-server services]# /usr/local/nagios/libexec/check_nrpe -H 192.168.12.50
NRPE v2.15
#通过NRPE检查远程客户端的运行时间
[root@nagios-server services]# /usr/local/nagios/libexec/check_nrpe -H 192.168.12.50 -c check_uptime
Uptime OK: 213 day(s) 3 hour(s) 5 minute(s) | uptime=306905.000000;;;
#本地NRPE无法用这个命令检查
[root@nagios-server services]# /usr/local/nagios/libexec/check_nrpe -H 127.0.0.1
CHECK_NRPE: Error - Could not complete SSL handshake.
#通过NRPE检查远程客户端的http服务
[root@nagios-server services]# /usr/local/nagios/libexec/check_http -I 192.168.12.6
HTTP OK: HTTP/1.1 200 OK - 54196 bytes in 0.042 second response time |time=0.041735s;;;0.000000 size=54196B


 被折叠的 条评论
为什么被折叠?
被折叠的 条评论
为什么被折叠?
 到【灌水乐园】发言


