


Global livestock feed data, including concentrates, grasses, stover, and occasional feeds, are available only for the year 20001). For 2000, we estimate that ruminants consumed 33% of the total concentrate feeds (317 Mt), 11% higher than the value given by ref.
Nevertheless, concentrate feeds comprised <10% of the total dry matter consumption by ruminants in the 2000s. The grass feed fraction in 2000 used in this study was directly derived from ref.
In this study, annual FCH4-ruminant was calculated based on IPCC Tier 2 methods. Compared with Tier 1 method that used the livestock population data and default emission factors, Tier 2 approach uses a more detailed country-specific data on gross energy intake and methane conversion factors for specific livestock categories, allowing the consideration of diet quantity and quality2 shows the comparison of the global FCH4-ruminant estimated in this study and those from previous studies for the contemporary period (1980–2012; see also Fig. 3a). Our global estimates are generally within the range of previous estimates using IPCC Tier 1 and Tier 2 methods3a). The highest emission comes from ref.
Table 2 Comparison of the global methane emissions from enteric fermentation of ruminants (FCH4-ruminant) and its trend
The linear trend of global FCH4-ruminant found in this study (0.89 ± 0.11 Tg CH4 yr−2) is much higher than that from FAOSTAT4 yr−2), and is not different from that of ref. 4 yr−2) for the period of 1961–2012. For the period of 1970–1989, we estimate a trend of FCH4-ruminant (0.95 ± 0.09 Tg CH4 yr−2) similar to that from EDGAR v4.3.24 yr−2) and high than those from FAOSTAT2). During 1990s, the emission trend from this study (0.33 ± 0.14 Tg CH4 yr−2) is larger than those from FAOSTAT4 yr−2) and EDGAR v4.3.24 yr−2), but lower than that in ref. 4 yr−2). For the period of 2000–2012, we estimate a trend of (1.61 ± 0.20 Tg CH4 yr−2) which is higher than those from FAOSTAT4 yr−2) using IPCC Tier 2 method. The differences of the trend estimates could come from several factors such as trends in milk yield and carcass weight, the statistics of ruminant numbers, and the assumptions of digestibility.
First, the trends from FAOSTAT
Second, ruminant livestock numbers used in this study and EDGAR v4.3.2FCH4-ruminant and its trend.
Third, the method used to calculate FCH4-ruminant can affect the trend estimate. Time invariant default emission factors of IPCC Tier 1 method were used by FAOSTAT10)) while ref.
Using IPCC Tier 2 method, our estimate and that from ref. 4 yr−1 in ref. 4 yr−1 for enteric emissions only), 8.6 Tg CH4 yr−1 in ref. 4 yr−1 in this study. These increases are larger than the estimate of in previous studies4 yr−1; Table S5 of ref. δ13C of atmospheric methane (lighter δ13CCH4-atm) given the lighter δ13CCH4-ruminant than δ13CCH4-atm (see Methods). It should be noted that there is larger trend of FCH4-ruminant in the period of 1999–2006 (1.7 ± 0.2 Tg CH4 yr−2) and that in the period of 2008–2012 (1.0 ± 0.1 Tg CH4 yr−2). The plateau of atmospheric methane concentration observed between late-1990s and mid-2000s therefore comes from other sources with larger emission decrease
At regional scale, FCH4-ruminant estimated in this study is generally in agreement with those from FAOSTAT4). One major difference comes from Latin America and Caribbean, where we estimate a lower FCH4-ruminant than those from FAOSTAT4 in 1998, which is similar to the estimates of this study (6.7 ± 0.8 Tg CH4 for all ruminants). Reference 4 in 2012 using revised emission factors, which is similar to that of ref. 4) and our estimate (7.4 ± 0.9 Tg CH4). Using subnational livestock data and IPCC Tier 2 method, ref. 4 in 1998, and 9.9 Tg CH4 in 2012; also in Fig. 4).
Tropical and sub-tropical regions experienced much higher population growth than temperate regions in the past five decades1). In addition to the local consumption, international trade also contributes to the feed requirement and FCH4-ruminant increase in regions like Latin America and Caribbean. Net export of ruminant meat increase from 0.65 million ton in 1961 to 2.1 million ton in 2012
Latin America and Caribbean has the highest C4 diet fraction (Supplementary Fig. 1), and also has the largest increase in C4 diet fraction (from 43.9% [43.5–45.1%] in 1961 to 54.6% [54.2–54.9%] in 2012. This region makes the major contribution to the global increase in C4 diet fraction. The C4 diet also comprises a significant part of ruminant diet in the United States, Sub-Saharan Africa, South Asia, and East and Southeast Asia. Local C4 feeds are the dominant component of the C4 diet in these regions except the United States and China. C4 concentrates comprise 19% and 21% of the total ruminant feeds in the United States and China during the 1980s, respectively. However, due to the fast growth of poultry and pig numbers, more C4 concentrates in these two countries are used for poultry and pigs with less for ruminants simulated by our simple feed model. Thus, the C4 diet fractions in these two countries decreased in the past two decades.
The regional evolution of FCH4-ruminant follows the regional growth of ruminant numbers and feed consumptions, which is also a result of population growth and diet shift. In opposite to the vast FCH4-ruminant increase in most regions, large decreases in FCH4-ruminant are found in Europe and Russia between 1990 and 2012. For eastern Europe and Russia, the collapse of the Former USSR in early 1990s caused large decrease in livestock numbers and thus FCH4-ruminant. In western Europe, the decrease in livestock numbers and FCH4-ruminant comes from a series of policies: (1) the European Union has provided various incentives to farmers through the Common Agricultural Policy (CAP−1, which caps livestock density in pasture at some 1.7 livestock unit per ha (Annex 1 in ref.
Large scatters exist in the data shown in Fig. 2. Due to lack of a more plausible relationship, the choice of linear relationship is a reasonable assumption and an interpretation of the data. Interestingly, the resulted equation is similar to the usual isotope effects modeled with first-order kinetics
$$\alpha = \frac{{R_{{\mathrm{diet}}}}}{{R_{{\mathrm{CH4}}}}}$$
(2)
where α denotes the isotope effects, where α ≅ 1 and is denoted as (1+ε); Rdiet and RCH4 denote the 13C/12C molar ratio of diet (reactant) and ruminant enteric CH4 emissions (products of reaction), respectively. Using δ13Cdiet and δ13CCH4 (Rdiet/RVPDB-standard−1 and RCH4/RVPDB-standard−1, respectively) instead of Rdiet and RCH4, the Eq. (2) can be transformed to:
$$1 + \varepsilon = \frac{{1 + {\mathrm{\delta }}^{13}{\mathrm{C}}_{{\mathrm{diet}}}}}{{1 + {\mathrm{\delta }}^{13}{\mathrm{C}}_{{\mathrm{CH4}}}}}$$
(3)
Eq. (3) can lead to:
$${\mathrm{\delta }}^{13}{\mathrm{C}}_{{\mathrm{CH4}}} = \frac{{{\mathrm{\delta }}^{13}{\mathrm{C}}_{{\mathrm{diet}}}}}{{1 + \varepsilon }} + \frac{\varepsilon }{{1 + \varepsilon }}$$
(4)
which is usually linearized to:
$${\mathrm{\delta }}^{13}{\mathrm{C}}_{{\mathrm{CH4}}} = {\mathrm{\delta }}^{13}{\mathrm{C}}_{{\mathrm{diet}}} + \varepsilon$$
(5)
Given the uncertainties in our regression coefficient for slope (0.91 ± 0.12), our linear regression (Eq. (1)) is compatible with Eq. (5) with a ε = 43.49 ± 2.86‰, where the resulted ε can be seen as the isotopic discrimination factor of the fermentation processes of livestock rumen. The resulted equation reflects the biochemical reactions for stable isotopes, which always produce depleted products (13C) while enriching the remaining substrates (12C) owing to the preference of enzyme systems to use lighter isotope substrates 12C.
Different δ13CCH4-ruminantdespite the same δ13Cdiet was found in the collected data (i.e., the large vertical scatter in Fig. 2). This isotopic variability could be due to the differences in first, exact feed composition (e.g., C3 feed: barley, wheat, soybean, alfalfa, straw, or C3 grass; C4 feed: maize grain, maize silage, or C4 grass), second, variation of feed δ13C in space and time, plant isotopic fractionation related to water use efficiency (WUE), and growing season δ13CCO2-atm when CO2 is fixed by plants and incorporated into biomass, third, energy content of feed, and fourth, the different ruminant species (cow, steer, goat, or sheep). For example, the feed composition given by the literature is sometimes coarse for some data points (i.e., points reporting a general C3 or C4 diet in Supplementary Table 2). In this study, we estimate δ13Cdiet using δ13C data collected for different feed categories, considering their uncertainty, and adjust them to the sampling year of δ13CCH4-ruminant using an adjustment factor derived from historical changes in δ13CCO2-atm from ref. 13Cdiet variability caused by different feed composition and different years of measurements. Spatial and temporal variability of δ13C in feed plants cannot be addressed given the sparse data. Energy content of feed might also affect the isotopic variability, through its relation to gut microbes conversion of intake into CH4. Given the fact that gut microbes preferably break down 12C components, high energy content of feed could potentially increase the conversion to CH4 by gut microbes, and cause heavier enteric CH4 emissions. Ruminant species and even the characteristics of individual animal could also be a source of the variations in δ13CCH4-ruminant. For example, as shown in Fig. 2, between animals fed by diet with similar δ13Cdiet, the δ13CCH4-ruminant can vary between different ruminant species (shown with different colors in Fig. 2) and within the same species (the dispersion of δ13CCH4-ruminant with similar δ13Cdiet shown with the same color in Fig. 2). The variation in δ13CCH4-ruminant caused by different ruminant species was also observed in a study using identical feed conditions for cows, sheep, and camels13CCH4-ruminant variation within each species.
We estimate that the annual mean δ13CCH4-ruminant slightly decreased from −64.49‰ [−67.36 to −61.62‰] in 1961 to −64.93‰ [−67.68 to −62.17‰] in 2012. This net small trend over 50 years is the result of two opposite mechanisms the increasing proportion of C4 grass and feeds (occasional and stover) consumed by ruminants (Fig. 1), and the decreasing δ13CCO2-atm that is incorporated in the biomass consumed by ruminants. The first mechanism tends to increase δ13Cdiet (less negative) of +0.74‰ over the last 50 years, while the second effect causes a decrease of δ13Cdiet of 1.18‰. Note that the magnitude of the decreasing trend of δ13C of biomass is not only parallel with the decreasing δ13CCO2-atm, but it is also controlled by trends of WUE over that period. There is evidence for an increase of WUE in temperate, boreal, and tropical forests2 in the atmosphere, but less so for C3 crops and grasses consumed by livestock2, we assumed conservatively that WUE is constant, which may overestimate the negative trend of δ13CCH4-ruminant reflecting the trend of δ13CCO2-atm.
Our estimate is significantly lower than the data compilation from ref. 13CCH4-ruminant obtained in local studies were not weighted by the proportion of C3- versus C4-eating ruminants. The value estimated by ref. 13CCH4-ruminant estimates of −54.6 ± 3.1‰ for C4 plant-based diet, and of −69.4 ± 3.1‰ for C3 plant-based diet, and a global weighted average C4 diet fraction ranging from 1.5 to 19.6% (uniform distribution). The range is simply estimated by using the estimated C4 emission fraction of the United States (19.6%) as a global upper bound (i.e., the rest of the world have the same C4 emission fraction as the United States) and zero C4 emission fraction except the United States as a global lower bound (i.e., 1.5%). As comparison, our estimate is based on first, the refined national C3:C4 feed fraction and its associated δ13Cdiet considering the observation-based uncertainties in the δ13C of different feed categories and the impact of decreasing δ13CCO2-atm on the δ13C of feeds, and second, a data-driven relationship between δ13Cdiet and δ13CCH4-ruminant (see Methods). For the United States, we estimated a C4 feed fraction of 22.2 ± 0.3% for the period of 1980–2012, which is higher but within the uncertainty of the fraction assumed by ref.
In this study, we assess the uncertainties of the composition and the δ13C of ruminant diet (δ13Cdiet), ruminant enteric methane emission (FCH4-ruminant), and its weighted δ13C (δ13CCH4-ruminant) through Monte Carlo ensembles (n = 1000) considering the uncertainties of the parameters used in calculation (see Methods and Supplementary Table 3). The parameters’ uncertainties considered here include the feed digestibility, the fraction of digestible energy available in diet used for maintenance (REMs), the methane conversion factor (Ym), the δ13C of feed categories, and the fitted linear regression between δ13Cdiet and δ13CCH4-ruminant constructed from observations.
We also acknowledge other uncertainties that are beyond our capacity of more precise estimation at current stage.
When estimating concentrate feeds intake by pigs and poultry, we account for the national livestock productivity, the different feed conversion ratio (converting production to feed requirement) and farming intensity (industrialized vs. backyard production) for developing and developed countries. Uncertainties in the feed conversion ratio have been discussed above. Besides, there could be uncertainties from other aspects. For example, the simple feed model is based on diet composition of Germany, which could cause inevitable uncertainties in the C3–C4 feed composition of pigs and poultry, and further affects uncertainties in C3–C4 concentrate feed for ruminants. There are also uncertainties in our assumptions on the logistic intensification and constant farming intensity of pig and poultry production in developing and developed countries, respectively, which will affect the time evolution of the concentrate feeds consumption by pigs and poultry. However, these uncertainties are currently not accessible due to lack of national-specific information on diet and farming intensity, and their historical changes.
In this study, we account for the impact of the global annual mean δ13CCO2-atm trend on the trend of δ13C of feed, δ13Cdiet and δ13CCH4-ruminant, while the potential effects of the latitudinal gradient and seasonality of δ13CCO2-atm (http://scrippsco2.ucsd.edu/graphics_gallery/isotopic_data/global_stations_isotopic_c13_trends) on the δ13C of feed (plants) are not considered. C4 photosynthesis is competitive under low atmospheric CO2 or high temperature/low water availability2 (~76 ppm during 1961–2012) on the C3–C4 grass distribution is not considered due to lack of evaluated global estimation. Based on leaf photosynthetic rates, one may expect an increase in C3 grass species due to elevated CO2, thus a lower δ13Cdiet and a lower δ13CCH4-ruminant. But long-term CO2 enrichment experiments have not consistently shown a decrease of C4 species in mixed grasslands2. In addition, δ13C of C3 plants may have a dependence on mean annual precipitation13C. However, a through meta-analysis on the effect on crops and grasses is needed before such relationship can be applied for assessing δ13C of feeds.
In the following section, we examine more in details the impact of our revised estimates FCH4-ruminant and δ13CCH4-ruminant on the trends of global atmospheric CH4 concentration and its isotopic composition using the time-dependent one-box model of the CH4 budget from refs. 12CH4 and 13CH4 to match atmospheric observations. Enteric methane emissions from EDGAR v4.3.2 were used in this baseline simulation as it is the most widely used prior inventory of atmospheric inversionsFCH4-ruminant, revised δ13CCH4-ruminant and revised δ13CCH4-ruminant changes between 1961 and 2012, respectively (see Methods for details in the model and the simulations). The purpose of the box-model simulations is to show the impact of our new estimates of livestock emissions on atmospheric trends, not to provide closure or re-analysis of recent changes in the budget for which adjustment of other sources (wetlands, fossil fuels) would be required.
With our revised FCH4-ruminant emissions and all other sources and sinks unchanged to their values from the baseline run, we simulate different trends in atmospheric CH4 compared with the baseline (Fig. 6a). During the period 1970–1989, our revised FCH4-ruminant produces a slightly smaller simulated trend of CH4 (15.8 ppb yr−1) than the baseline (16.2 ppb yr−1). For the period 1990–1999, our estimate of FCH4-ruminant (Table 2) produces similar trends of CH4 than the baseline. For the period after 2000, we obtain a larger trend of 4.1 ppb yr−1 compared with 3.0 ppb yr−1 in the baseline. This result suggests that our revised livestock emissions can explain a larger portion of the observed CH4 increase during 2000–2012, but that another source should be revised downwards by the same amount—or OH sink increased—to match with the observed CH4 trend.
Fig. 6
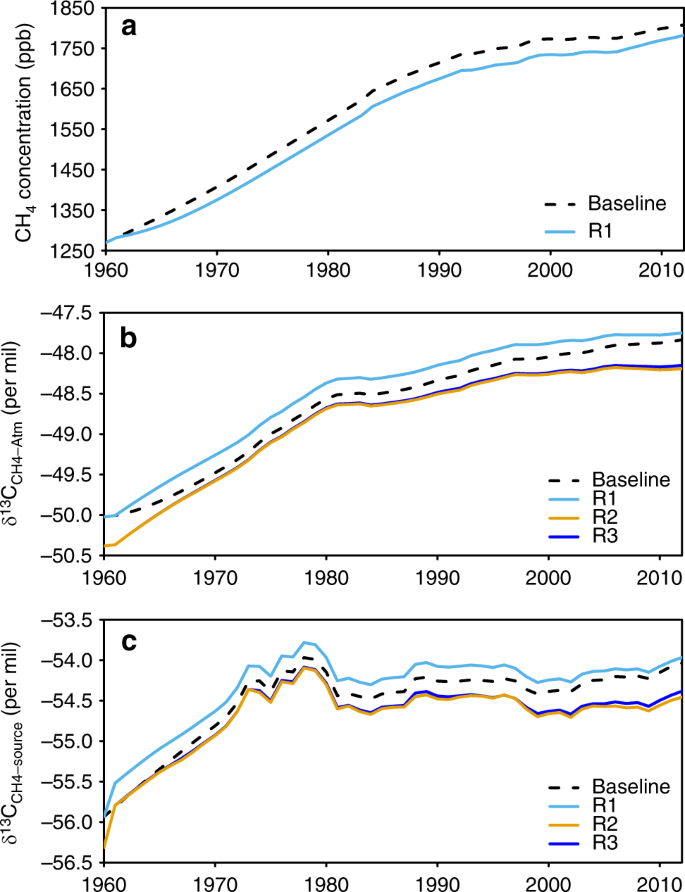
Global box model simulations of atmospheric CH4 concentration, the box model results on δ13CCH4-atm, and the isotopic source signature weighted by all sources (δ13CCH4-source). In the simulation of R1, only the revised FCH4-ruminant is used and δ13CCH4-ruminant set to default value of −62‰ previously used by ref. FCH4-ruminant and δ13CCH4-ruminant are used (see Methods). R3 is the same as R2 but with constant δ13CCH4-ruminant at −64.49‰ for the period of 1961–2012. The differences between R1 and baseline are the effects of the revised FCH4-ruminant; the differences between R2 and R1 are the effects of the revised δ13CCH4-ruminant; the differences between R3 and R2 are the effects of the δ13CCH4-ruminant variation (i.e., the slightly decrease from −64.49‰ in 1961 to −64.93‰ in 2012). Source data are provided as a Source Data file
Our revised FCH4-ruminant (light blue line in Fig. 6c) alone, with δ13CCH4-ruminant set the default value from ref. 13CCH4-source weighted by all sources) due to our lower emissions than in EDGAR v4.3.213CCH4-source differences with the baseline range from +0.11‰ in the 2000s to +0.18‰ in the 1970s. The smaller δ13CCH4-source difference in the 2000s comes from the fact that the revised FCH4-ruminant is closer to that of EDGAR v4.3.213CCH4-ruminant value shifts the global δ13CCH4-source by −0.38‰ during 1980–2012 (difference between brown and light blue lines in Fig. 6c), which counterbalances the effect of our lower FCH4-ruminant. This result suggests that both FCH4-ruminant and δ13CCH4-ruminant revisions have significant impacts on δ13CCH4-source. Further studies using isotopic mass balances should thus not only include the revised source estimates for ruminants, but also revised δ13CCH4-ruminant.
Both the revised FCH4-ruminant and δ13CCH4-ruminant affect the mean values and trends of δ13CCH4-atm in the box-model (Fig. 6b). From 1990 to 2012, compared with the baseline, the revised FCH4-ruminant alone (light blue line in Fig. 6c) produces a larger mean δ13CCH4-atm by +0.15‰. The revised δ13CCH4-ruminant alone produces a lower mean value of δ13CCH4-atm than the baseline by −0.37‰. The combined revised source and isotopic signature make the mean δ13CCH4-atm smaller than the baseline by −0.22‰. However, the decreasing δ13CCH4-ruminant has a very small effect on reconstructed δ13CCH4-atm (by −0.02‰ only). This finding implies that even with substantial shifts in diet and geographical distribution on ruminant CH4 emissions, the temporal changes in δ13CCH4-ruminant in the recent decades alone do not have significant effect on the reconstructed δ13CCH4-atm.
From 1990 to 2012, the box model prescribed with the revised FCH4-ruminant simulates a smaller increase in δ13CCH4-atm (change of +0.40‰ during 1990–2012; trend of +0.017‰ yr−1) compared with the baseline (change of +0.50‰; trend of +0.022‰ yr−1). Adding the new δ13CCH4-ruminant makes the increase in δ13CCH4-atm even smaller (change +0.31‰; trend of +0.013‰ yr−1). In other words, as compared with the baseline simulation using emissions from EDGAR v4.3.213CCH4-ruminant of −62‰, the updated FCH4-ruminant and δ13CCH4-ruminant from this study are responsible for a lower δ13CCH4-atm by −0.19‰ between 1990 and 2012, and by −0.08‰ after 2006 when the CH4 growth rate became positive again13CCH4-atm (−0.15‰ between 2006 to 2012; derived from Table S4 of ref. 4 emissions from ruminants have compensated δ13CCH4-atm trend that could have otherwise increased more largely driven by the increasing fossil-fuel-related emissions. Secondly, the revised δ13CCH4-ruminant to lower values gives a larger role of ruminant emissions in the recent δ13CCH4-atm trend than previously estimated, consistent with the results from ref.


 被折叠的 条评论
为什么被折叠?
被折叠的 条评论
为什么被折叠?
 到【灌水乐园】发言


