


 本文展示了如何使用gnuplot从MySQL数据库读取天气数据,并绘制实时的温度、湿度、风速和大气压变化曲线,提供了一个LAMOST气象站的数据实例,通过设置时间格式和中文字体,生成PNG图像文件。
时序图是常见的一种数据绘图,最典型的时序数据是天气数据,天气温度、湿度等都是随着时间变化的,本文给出一个例子是以LAMOST气象站采集的一段时间数据,使用gnuplot绘出实时温湿度变化曲线。
天气数据:
timemjdtemp rhumpres wind_avgwind_max wind_dir dewpoint
2008-12-14 18:02:0078933242 -2.433915.52.64.276-16.46
2008-12-14 18:04:0078933244 -2.333915.62.84.675-16.38
2008-12-14 18:06:0078933246 -2.433915.62.74.680-16.46
2008-12-14 18:08:0078933248 -2.433915.62.75.275-16.46
2008-12-14 18:10:0078933250 -2.433915.53.87.178-16.46
2008-12-14 18:12:0078933252 -2.333915.63.36.476-16.38
2008-12-14 18:14:0078933254 -2.333915.62.85.974-16.38
2008-12-14 18:16:0078933256 -2.333915.53.5874-16.38
2008-12-14 18:18:0078933258 -2.333915.63.17.479-16.38
2008-12-14 18:20:0078933260 -2.333915.72.85.974-16.38
2008-12-14 18:22:0078933262 -2.334915.71.7480-16.02
2008-12-14 18:24:0078933264 -2.434915.72.64.176-16.11
2008-12-14 18:26:0078933266 -2.434915.82.5474-16.11
2008-12-14 18:28:0078933268 -2.333915.82.73.775-16.38
2008-12-14 18:30:0078933270 -2.233915.84.26.375-16.29
2008-12-14 18:32:0078933272 -2.133915.92.95.677-16.2
2008-12-14 18:34:0078933274 -2.234915.93.35.373-15.93
2008-12-14 18:36:0078933276 -2.234915.93.34.975-15.93
2008-12-14 18:38:0078933278 -2.234915.92.74.371-15.93
2008-12-14 18:40:0078933280 -2.234915.945.673-15.93
2008-12-14 18:42:0078933282 -2.133915.93.85.173-16.2
2008-12-14 18:44:0078933284 -2.133915.93.65.473-16.2
...............
曲线图中需要有中文的内容,因此必须先指定中文字体,下面例子是方正黑体,字号11,绘出的图是png格式,文件名w.png,图像大小1000x1000。
时序数据必须指定时间的格式,下面例子的格式是:
set timefmt "%Y-%m-%d %H:%M:%S"
更多的时间格式为:
格式说明
%d
日期:1-31
%m
月份:1-12
%y
年:0-99
%Y
年,四位数
%j
一年中的天数:1-365
%H
小时:0-23
%M
分钟:0-59
%s
UNIX时间
%S
秒:0-59
%b
三个字母的月份缩写
%B
月份名称
程序如下:
set terminal png font './font/fzht.ttf,11' size 1000,1000
set output "w.png"
set multiplot layout 2, 1 title "LAMOST 天气信息"
#
set size ratio 0.4
set title "LAMOST 天气信息 - 温度 露点温度 相对湿度图" font './font/fzht.ttf,13'
set xdata time
set xlabel "\n时间"
set ylabel "温度 / 露点温度 (C)"
set timefmt "%Y-%m-%d %H:%M:%S"
set grid
#set yrange [-3:6]
set y2label "相对湿度 (%)"
set y2tics
plot 'w.dat' using 1:4 with line title "温度", \
'w.dat' using 1:10 with line title "露点温度", \
'w.dat' using 1:5 axes x1y2 with line title "相对湿度"
#
set title "LAMOST 天气信息 - 风速 大气压图" font './font/fzht.ttf,13'
set xdata time
set xlabel "\n时间"
set ylabel "风速 (m/s)"
set timefmt "%Y-%m-%d %H:%M:%S"
set grid
#set nokey
set y2label "大气压 (hPa)"
set y2tics
plot 'w.dat' using 1:8 with line title "瞬时最大风速", \
'w.dat' using 1:7 with line title "平均风速", \
'w.dat' using 1:6 axes x1y2 with line title "大气压"
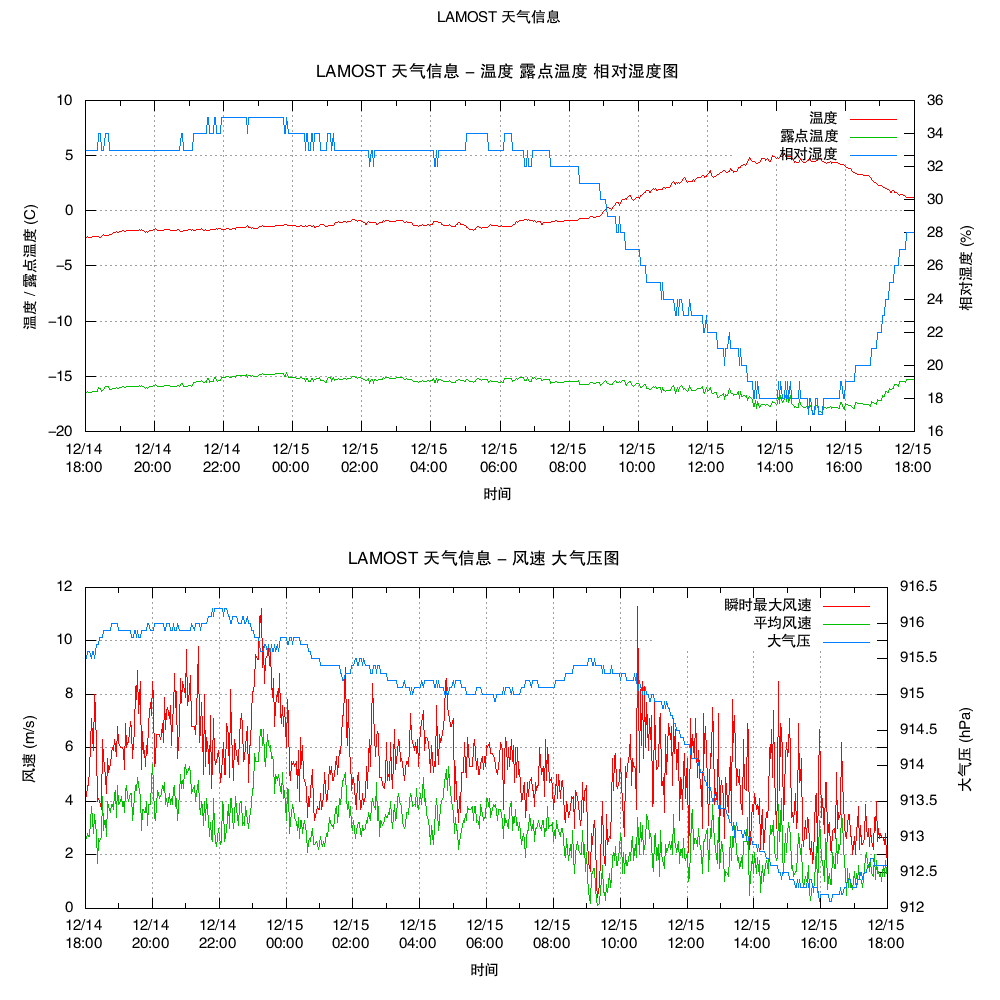
程序名称demo.gp,运行程序:
gnuplot demo.gp
效果图


 被折叠的 条评论
为什么被折叠?
被折叠的 条评论
为什么被折叠?
 到【灌水乐园】发言


