


 该博客介绍了一个MATLAB函数,用于将图形的坐标轴移动到图形的中间位置,使得坐标轴与数学作图习惯一致。通过创建新的坐标轴并调整其位置,实现了坐标轴的居中效果。
某位PKU前辈的工作,很赞。移动坐标轴就先隐藏之前的坐标轴,再用axis('position')属性重新生成新轴,很巧妙。
function new_fig_handle = shift_axis_to_origin( fig_handle )
% 本函数目的是把 matlab 做的图坐标轴移到图形的中间部分去(与数学的做图习惯一致)
% 2008.10.10 in pku
%%%%%%%%%%%%%%%%%%%%%%%%%%%%%%%%%%
figure('Name','shift_axis_to_origin','NumberTitle','off') % Create a new figure
% 拷贝图形到一个新的窗口
new_fig_handle = copyobj( fig_handle , gcf );
xL=xlim ;
yL=ylim ;
xt=get(gca,'xtick') ;
yt=get(gca,'ytick') ;
set(gca,'XTick',[],'XColor','w') ;
set(gca,'YTick',[],'YColor','w') ;
% 把 x 和 y 坐标轴的两个方向各延长 10% (为了视觉上好看)
extend_x = ( xL(2)-xL(1) ) * 0.1 ;
extend_y = ( yL(2)-yL(1) ) * 0.1 ;
xxL = xL + [ -extend_x extend_x] ;
yyL = yL + [ -extend_y extend_y] ;
set(gca,'xlim', xxL) ;
set(gca,'ylim', yyL) ;
pos = get(gca,'Position') ;
box off;
x_shift = abs( yyL(1)/(yyL(2)-yyL(1)) ) ;
y_shift = abs( xxL(1)/(xxL(2)-xxL(1)) ) ;
temp_1 = axes( 'Position', pos + [ 0 , pos(4) * x_shift , 0 , - pos(4)* x_shift*0.99999 ] ) ;
xlim(xxL) ;
box off ;
set(temp_1,'XTick',xt,'Color','None','YTick',[]) ;
set(temp_1,'YColor','w') ;
temp_2 = axes( 'Position', pos + [ pos(3) * y_shift , 0 , -pos(3)* y_shift*0.99999 , 0 ] ) ;
ylim(yyL) ;
box off ;
set(temp_2,'YTick',yt,'Color','None','XTick',[]) ;
set(temp_2,'XColor','w') ;
Base_pos = get(new_fig_handle,'Position') ;
arrow_pos_in_x_dircetion = Base_pos(2) - Base_pos(4) * yyL(1)/(yyL(2)-yyL(1)) ;
arrow_pos_in_y_dircetion = Base_pos(1) - Base_pos(3) * xxL(1)/(xxL(2)-xxL(1)) ;
annotation('arrow',[Base_pos(1) , Base_pos(1)+Base_pos(3)] , [arrow_pos_in_x_dircetion , arrow_pos_in_x_dircetion ] , 'Color','k');
annotation('arrow',[arrow_pos_in_y_dircetion , arrow_pos_in_y_dircetion ] , [Base_pos(2) , Base_pos(2)+Base_pos(4)] , 'Color','k');
end
%%%%%%%%%%%%%%%%%%%%%%%%%%%%%%%%%%
下面是一个例子:
% 本程序目的是把 matlab 做的图坐标轴移到图形的中间部分去(与数学的做图习惯一致)
% 2008.10.08
%
clc;clear;close all;
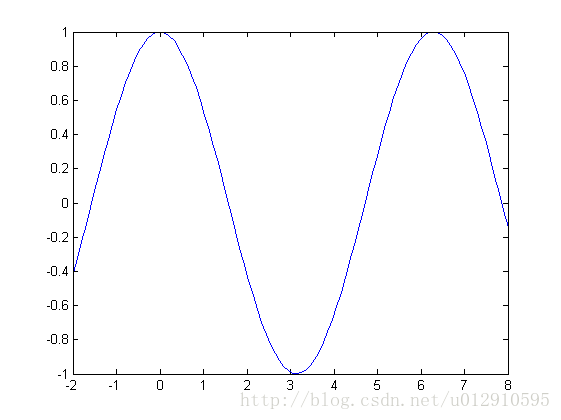
t=linspace(-2,8,100);
a1=axes;
plot(t,cos(t));
% xt=get(gca,'xtick');
% set(gca,'XTick',[],'XColor','w');
% xL=xlim;
% p=get(gca,'Position');
% box off;
% a2=axes('Position',p+[0,p(4)/2,0,-p(4)/2]);
% xlim(xL);box off;
% set(gca,'XTick',xt,'Color','None','YTick',[]);
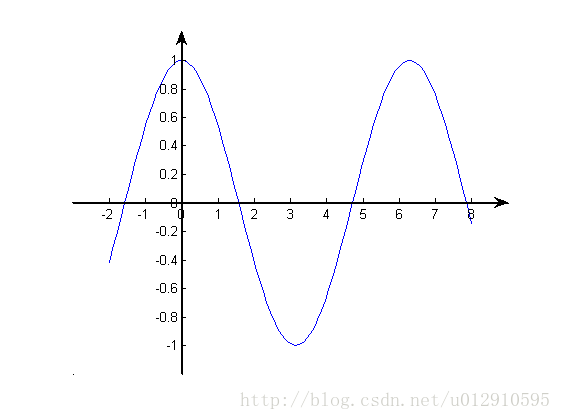
new_fig_handle = shift_axis_to_origin( gca ) ;
%%%%%%%%%%%%%%%%%%%%%%%%%%%%%%%%%%
此例子的实现效果如下两个图所示:


 被折叠的 条评论
为什么被折叠?
被折叠的 条评论
为什么被折叠?
 到【灌水乐园】发言


