


散点图
Plotly Express可以用于很多种类型的数据。
import plotly.express as pxx,y是类array格式的数据时
fig = pix.scatter(
    x = [0,1,2,3,4],
    y = [0,1,4,9,16]
)
fig.show()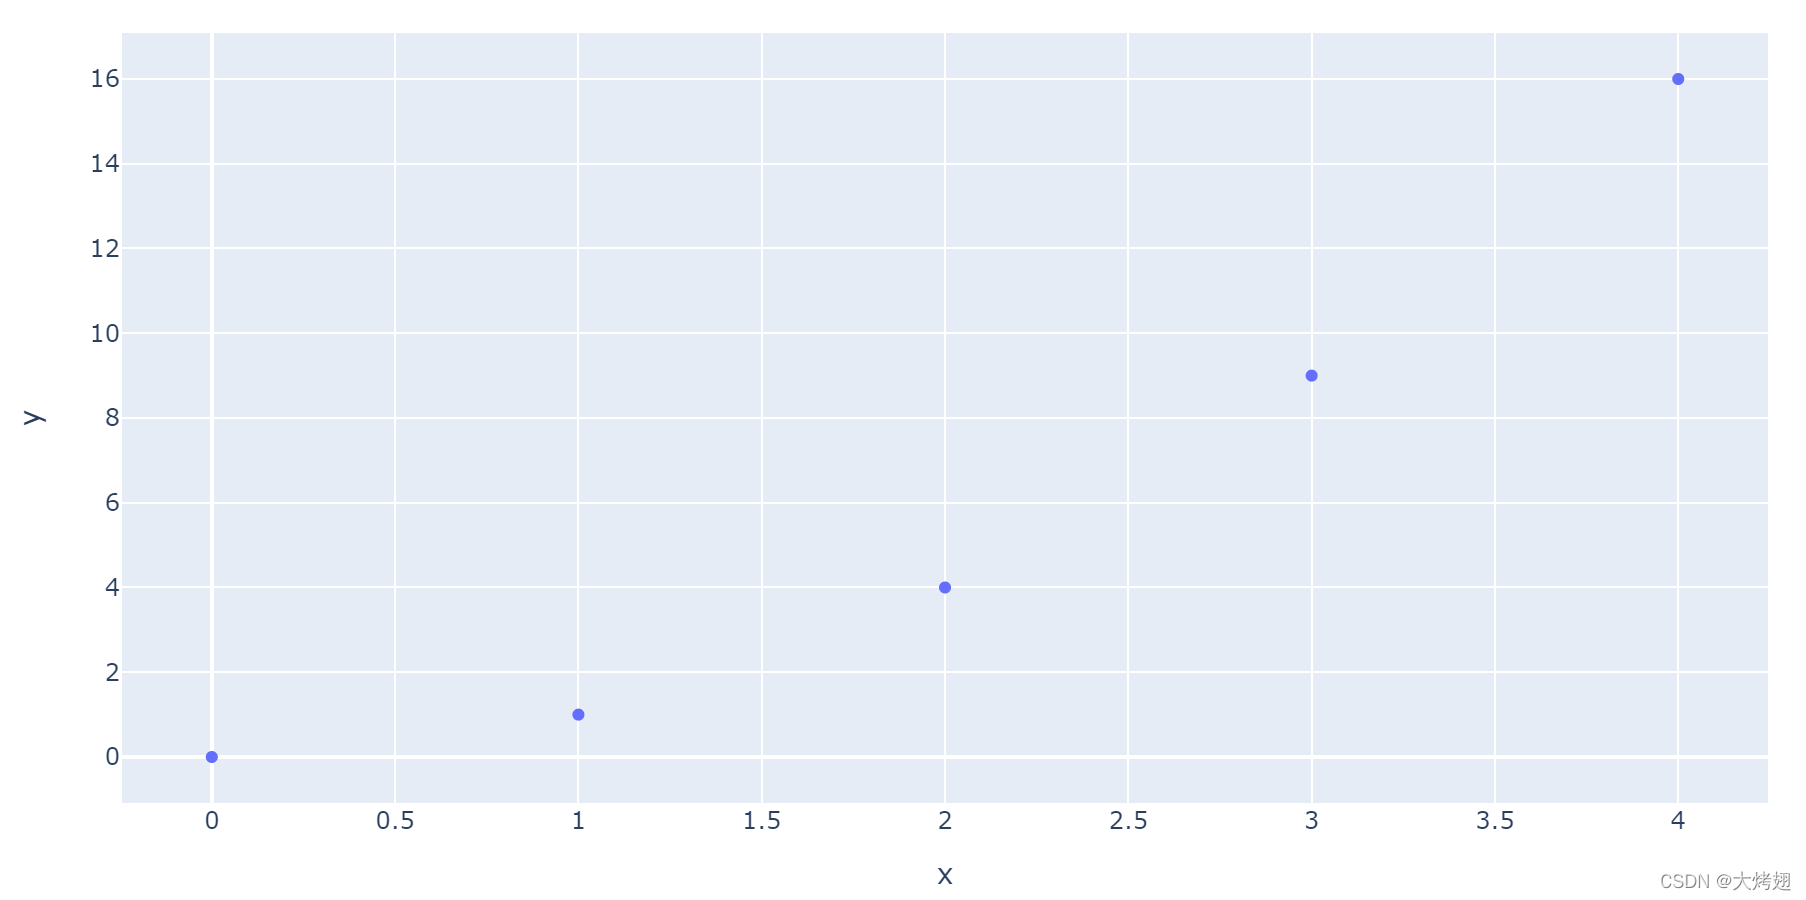
x,y是pandas 的 DataFrame的column时
df = px.data.iris()
fig = px.scatter(
    df, x = "sepal_width", y = "sepal_length"
)
fig.show()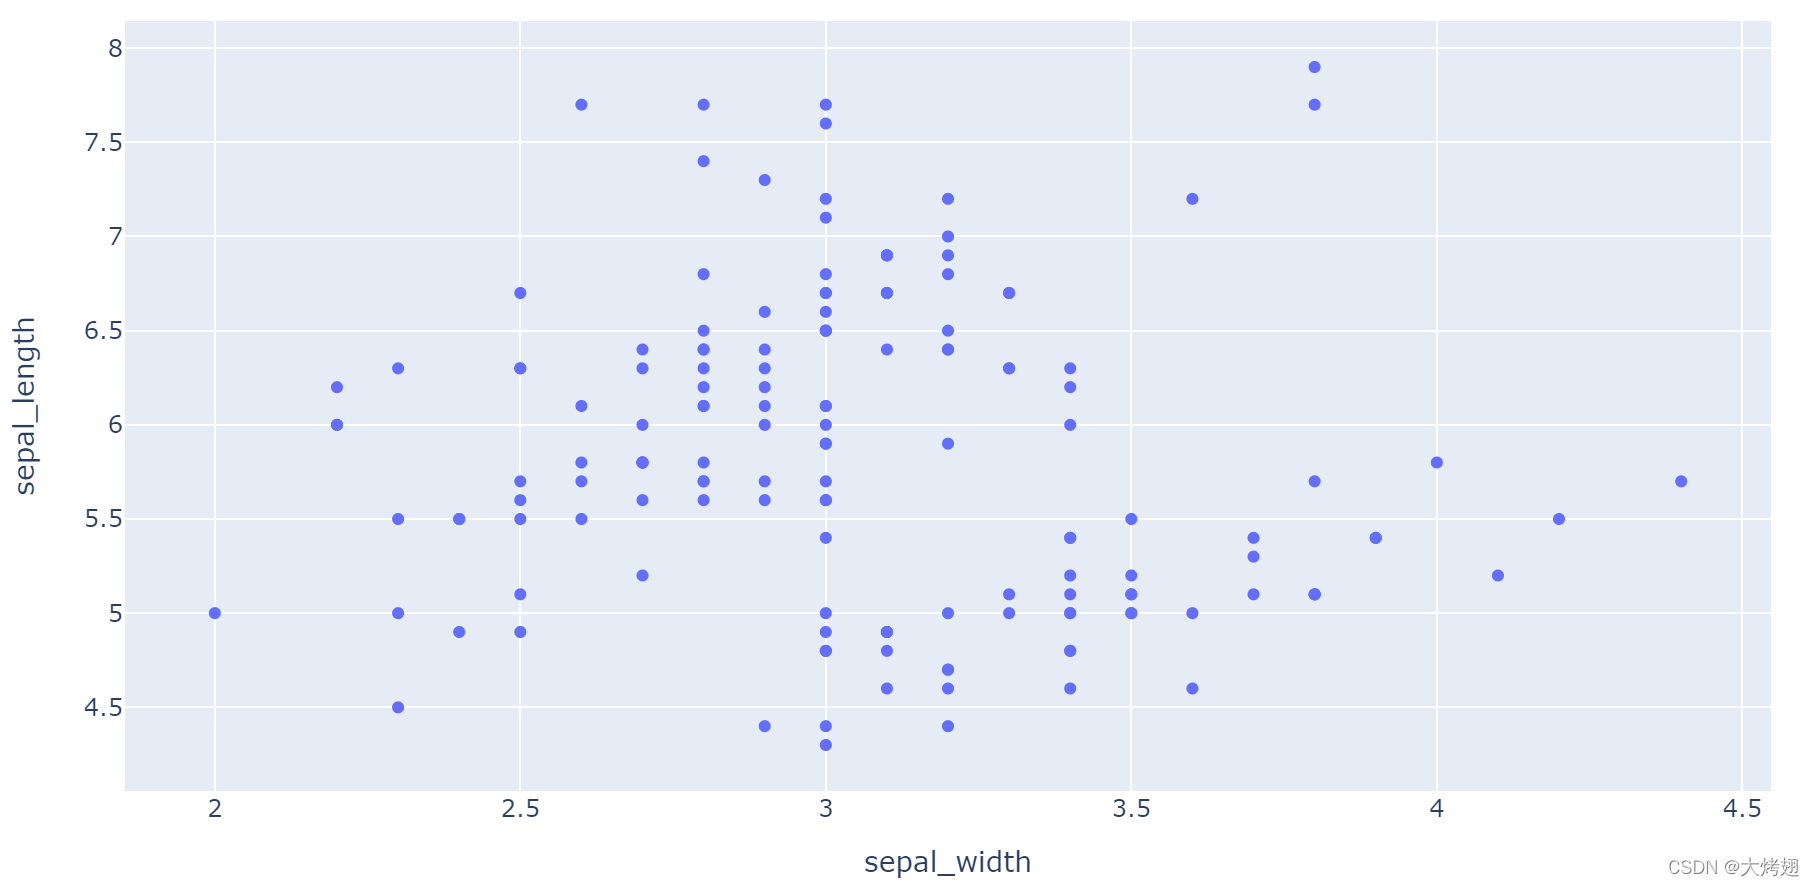
带有可变大小圆形标记的散点图通常称为
 最低0.47元/天 解锁文章


 1109
1109

 被折叠的 条评论
为什么被折叠?
被折叠的 条评论
为什么被折叠?
 到【灌水乐园】发言


