


地图(六)利用python绘制连接地图
连接地图(Connection Map)简介
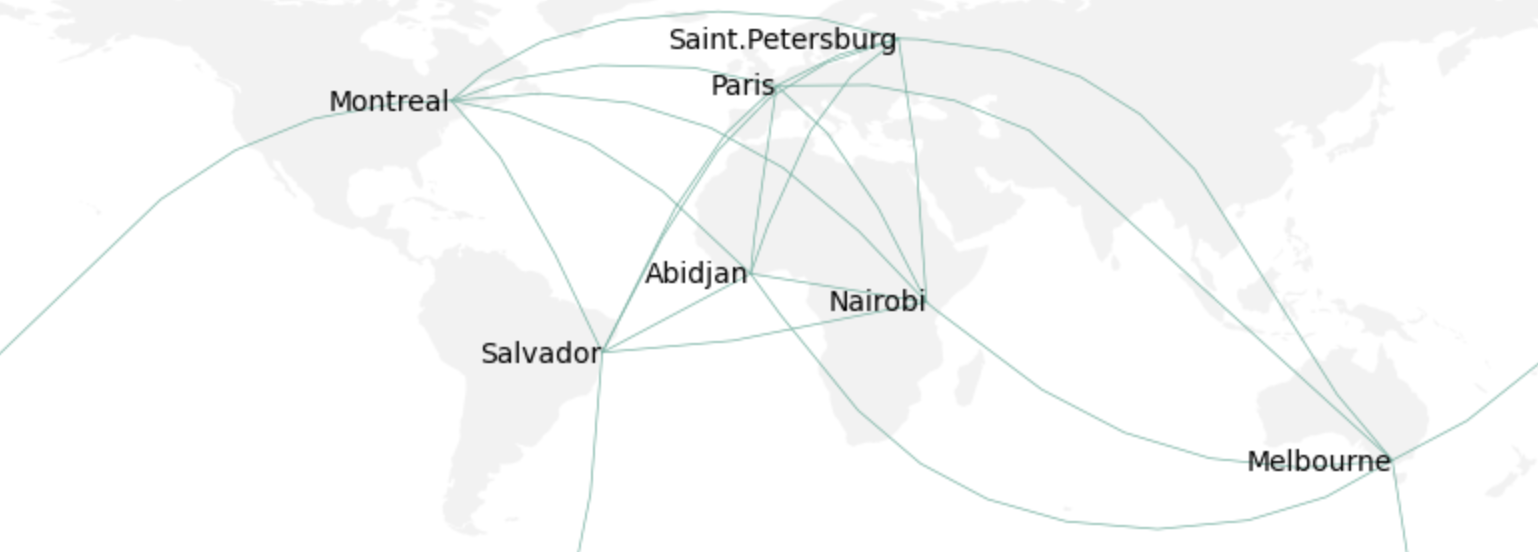
连接地图可以将地图上相关信息连接起来以呈现关联或对比关系,例如常见的航班线绘制。
快速绘制
-
基于cartopy和matplotlib
import matplotlib.pyplot as plt
import cartopy.feature as cfeature
import cartopy.crs as ccrs
import pandas as pd

cities = {
    'city': ["Paris", "Melbourne", "Saint.Petersburg", "Abidjan", "Montreal", "Nairobi", "Salvador"],
    'lon': [2, 145, 30.32, -4.03, -73.57, 36.82, -38.5],
    'lat': [49, -38, 59.93, 5.33, 45.52, -1.29, -12.97]
}
df = pd.DataFrame(cities, columns = ['city', 'lon', 'lat'])

# 创建一个地图
plt.figure(figsize=[10, 5])
ax = plt.axes(projection=ccrs.PlateCarree())
ax.set_extent([-179, 179, -60, 70])    #  设置地图边界
ax.add_feature(cfeature.LAND, facecolor='#f2f2f2')  # 填充大陆
ax.add_feature(cfeature.COASTLINE, edgecolor="white", linewidth=0.1) # 改变海岸线边缘

# 绘制连线
for startIndex, startRow in df.iterrows():
    for endIndex in range(startIndex, len(df.index)):
        endRow = df.iloc[endIndex]
        plt.plot([startRow.lon, endRow.lon], [startRow.lat, endRow.lat], color='#69b3a2', linewidth=0.5, transform=ccrs.Geodetic())

# 添加城市名
for i, row in df.iterrows():
    plt.text(row.lon, row.lat, row.city, verticalalignment='center', horizontalalignment='right', transform=ccrs.Geodetic())

plt.show()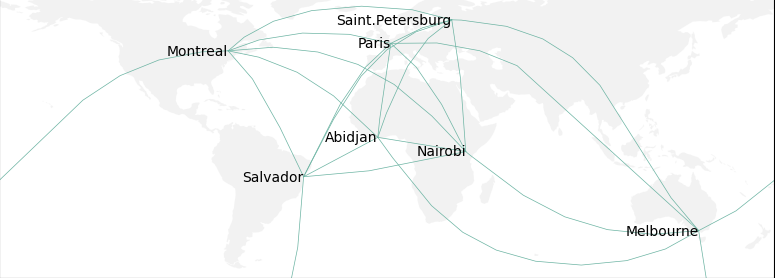
-
基于pyecharts
from pyecharts.charts import *
from pyecharts import options as opts
import requests
import json

geo = Geo(init_opts=opts.InitOpts(theme='dark', bg_color='#000000', width='1000px', height='600px'))

# 导入数据
url = "https://raw.githubusercontent.com/HsuHeinrich/data-collection/master/graph/flights.json"
response = requests.get(url)
data = json.loads(response.text)

airports = data['airports']
airlines = data['airlines']
routes = data['routes']

# 添加机场的坐标点
for idx, item in enumerate(airports):
    geo.add_coordinate("airpots"+str(idx), item[3], item[4])


geo.add_schema(maptype="world", is_roam=False, zoom=1.1,
               itemstyle_opts=opts.ItemStyleOpts(color="#000000", border_color="#1E90FF"),
               emphasis_label_opts=opts.LabelOpts(is_show=False),
               emphasis_itemstyle_opts=opts.ItemStyleOpts(color="#323c48"))

# 创建一个新的列表,用于在循环中添加航线信息
routes_info = []

idx = routes[0][0]
for item in routes:
    if item[0] == idx:
        routes_info.append(["airpots"+str(item[1]), "airpots"+str(item[2])])
    else:
        geo.add(airlines[idx][0],
                routes_info[:2000],
                type_='lines',
#                 is_selected=True if airlines[idx][0]=='Air China' else False,
                symbol_size=1,
                is_large=True,
                linestyle_opts=opts.LineStyleOpts(curve=0.2, opacity=0.03, color='#1E90FF', width=0.2),
                effect_opts=opts.EffectOpts(symbol='pin', period=5, symbol_size=[1, 3], trail_length=0.5, color="#E1FFFF"),
                )
        routes_info = []
        idx = item[0]

geo.set_series_opts(label_opts=opts.LabelOpts(is_show=False))

geo.set_global_opts(
    title_opts=opts.TitleOpts(title="航线图", pos_top='3%', pos_left='center'),
    tooltip_opts=opts.TooltipOpts(is_show=False),
    legend_opts=opts.LegendOpts(is_show=True, pos_left='left', pos_top='50%', orient='vertical', selected_mode='single')
    )

geo.render_notebook()
总结
以上利用cartopy结合matplotlib快速绘制变形地图,也可通过pyecharts绘制漂亮的航班线。
共勉~


 被折叠的 条评论
为什么被折叠?
被折叠的 条评论
为什么被折叠?
 到【灌水乐园】发言


