


什么是堆Dump
dump文件是进程的内存副本。堆Dump是反映Java堆使用的内存镜像,其中主要包括系统信息、虚拟机属性、完整的线程Dump、所有类和对象的状态等。一般,在内存不足、GC异常等情况下,我们就会怀疑有内存泄漏。这个时候我们就可以制作堆Dump来查看具体情况,分析原因。
常见内存错误:
outOfMemoryError 年老代内存不足。
outOfMemoryError:PermGen Space 永久代内存不足。
outOfMemoryError:GC overhead limit exceed 垃圾回收时间占用系统运行时间的98%或以上。
jmap语法
jmap
Usage:
jmap [option] <pid>
(to connect to running process)
jmap [option] <executable <core>
(to connect to a core file)
jmap [option] [server_id@]<remote server IP or hostname>
(to connect to remote debug server)
where <option> is one of:
<none> to print same info as Solaris pmap
-heap to print java heap summary
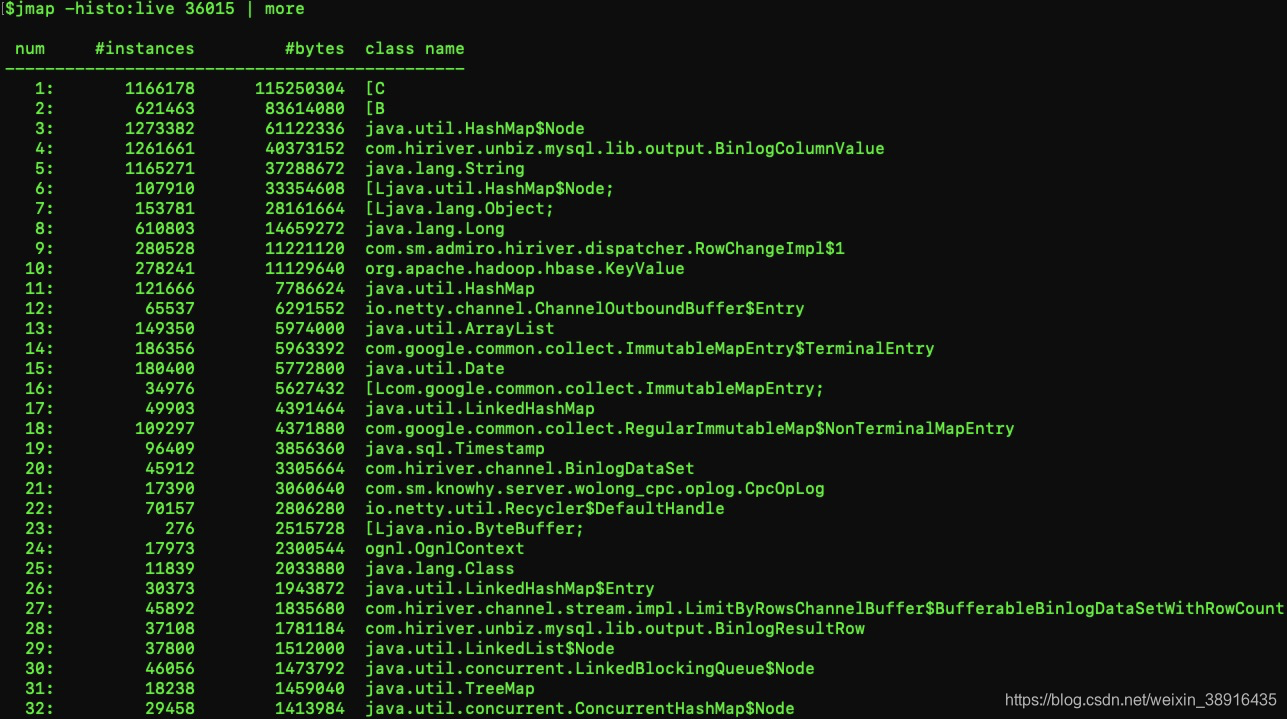
-histo[:live] to print histogram of java object heap; if the "live"
suboption is specified, only count live objects
-clstats to print class loader statistics
-finalizerinfo to print information on objects awaiting finalization
-dump:<dump-options> to dump java heap in hprof binary format
dump-options:
live dump only live objects; if not specified,
all objects in the heap are dumped.
format=b binary format
file=<file> dump heap to <file>
Example: jmap -dump:live,format=b,file=heap.bin <pid>
-F force. Use with -dump:<dump-options> <pid> or -histo
to force a heap dump or histogram when <pid> does not
respond. The "live" suboption is not supported
in this mode.
-h | -help to print this help message
-J<flag> to pass <flag> directly to the runtime systemoption的可选项
<no option>如果使用不带选项参数的jmap打印共享对象映射,将会打印目标虚拟机中加载的每个共享对象的起始地址、映射大小以及共享对象文件的路径全称。这与Solaris的pmap工具比较相似。-dump:[live,]format=b,file=<filename>以hprof二进制格式转储Java堆到指定filename的文 件中 。live子选项是可选的。如果指定了live子选项,堆中只有活动的对象会被转储。想要浏览heapdump, 你 可以使用jhat(Java堆分析工具)读取生成的文件。-finalizerinfo打印等待终结的对象信息。-heap打印一个堆的摘要信息,包括使用的GC算法、堆配置信息和generation wise heap usage。-histo[:live]打印堆的柱状图。其中包括每个Java类、对象数量、内存大小(单位:字节)、完全限定的类名。打印的虚拟机内部的类名称将会带有一个’*’前缀。如果指定了live子选项,则只计算活动的对象。-permstat打印Java堆内存的永久保存区域的类加载器的智能统计信息。对于每个类加载器而言,它的名称、活跃度、地址、父类加载器、它所加载的类的数量和大小都会被打印。此外,包含的字符串数量和大小也会被打印。-F强制模式。如果指定的pid没有响应,请使用jmap -dump或jmap -histo选项。此模式下,不支持live子 选项。
以下命令基于jdk1.8
常用命令
jmap -heap 36015
Attaching to process ID 36015, please wait...
Debugger attached successfully.
Server compiler detected.
JVM version is 25.66-b60

using thread-local object allocation.
Garbage-First (G1) GC with 63 thread(s)

Heap Configuration:
   MinHeapFreeRatio         = 40
   MaxHeapFreeRatio         = 70
   MaxHeapSize              = 34359738368 (32768.0MB)
   NewSize                  = 1363144 (1.2999954223632812MB)
   MaxNewSize               = 20602421248 (19648.0MB)
   OldSize                  = 5452592 (5.1999969482421875MB)
   NewRatio                 = 2
   SurvivorRatio            = 8
   MetaspaceSize            = 268435456 (256.0MB)
   CompressedClassSpaceSize = 1073741824 (1024.0MB)
   MaxMetaspaceSize         = 268435456 (256.0MB)
   G1HeapRegionSize         = 16777216 (16.0MB)

Heap Usage:
G1 Heap:
   regions  = 2048
   capacity = 34359738368 (32768.0MB)
   used     = 10335090376 (9856.310249328613MB)
   free     = 24024647992 (22911.689750671387MB)
   30.07907180581242% used
G1 Young Generation:
Eden Space:
   regions  = 8
   capacity = 21088960512 (20112.0MB)
   used     = 134217728 (128.0MB)
   free     = 20954742784 (19984.0MB)
   0.6364359586316627% used
Survivor Space:
   regions  = 33
   capacity = 553648128 (528.0MB)
   used     = 553648128 (528.0MB)
   free     = 0 (0.0MB)
   100.0% used
G1 Old Generation:
   regions  = 576
   capacity = 12717129728 (12128.0MB)
   used     = 9647224520 (9200.310249328613MB)
   free     = 3069905208 (2927.6897506713867MB)
   75.86007791332959% used

30281 interned Strings occupying 3955928 bytes.
jmap -histo 36015 | more


 873
873

 被折叠的 条评论
为什么被折叠?
被折叠的 条评论
为什么被折叠?
 到【灌水乐园】发言


