实战
from bokeh.core.properties import value
import pymysql as py_df
import pandas as pd
from bokeh.models import ColumnDataSource
from bokeh.plotting import figure, show, output_file

fruits = ['Apples', 'Pears', 'Nectarines', 'Plums', 'Grapes', 'Strawberries']
years = ["2015", "2016", "2017"]
colors = ["#c9d9d3", "#718dbf", "#e84d60"]
data = {'fruits' : fruits,
        '2015'   : [2, 1, 4, 3, 2, 4],
        '2016'   : [5, 3, 4, 2, 4, 6],
        '2017'   : [3, 2, 4, 4, 5, 3]}

source = ColumnDataSource(data=data)

p = figure(x_range=fruits, plot_height=350, title="Fruit Counts by Year",tools="")
p.vbar_stack(["2015", "2016", "2017"], #可以用years代替,就是上边设置的变量 # 设置堆叠值,这里source中包含了不同年份的值,years变量用于识别不同堆叠层
                         x='fruits',     # 设置x坐标
                         source=source, #包含了2015/2016/2017的数据的;  主要设置的就是这3个参数
                         width=0.9, color=colors,
                         legend=[value(x) for x in years], name=years) #对整个数据做一个分组集合变成一个列表

show(p)
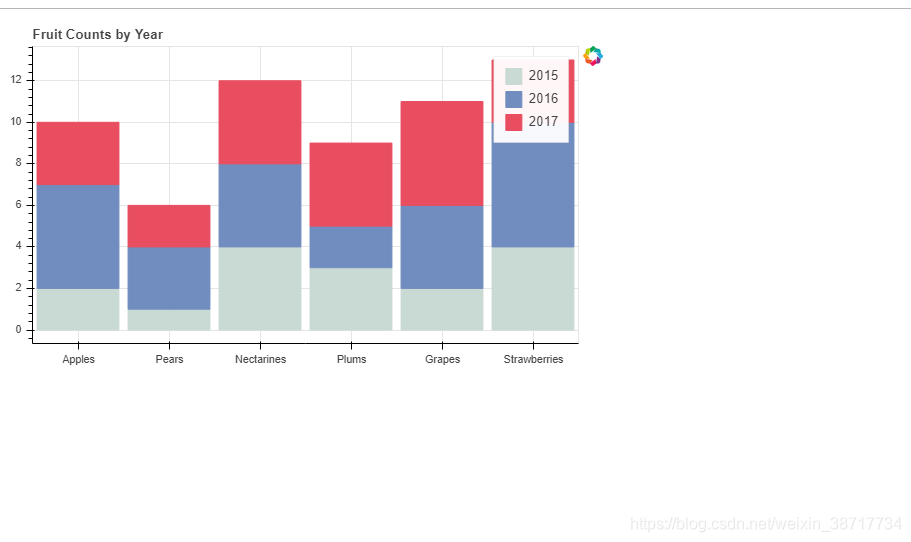


 本文通过使用Bokeh库进行数据可视化,展示了不同年份各种水果的产量对比。采用堆叠柱状图的形式,清晰地呈现了Apples、Pears等六种水果在2015年至2017年的产量变化趋势。


 1272
1272

 被折叠的 条评论
为什么被折叠?
被折叠的 条评论
为什么被折叠?
 到【灌水乐园】发言


