官网
一、安装包下载
npm install @antv/f2@3.8.10
或者
HBuilderX 导入插件
二、代码块
<template>
	<view style="height:  750rpx">
		<l-f2 ref="chart"></l-f2>
	</view>
</template>

<script>
	import F2 from '@/uni_modules/lime-f2/components/l-f2/f2-all.min.js';
	export default {
		data() {
			return {
				data: [{
					time: '2016-08-08 00:00:00',
					tem: 10
				}, {
					time: '2016-08-08 00:10:00',
					tem: 22
				}, {
					time: '2016-08-08 00:30:00',
					tem: 16
				}, {
					time: '2016-08-09 00:35:00',
					tem: 26
				}, {
					time: '2016-08-09 01:00:00',
					tem: 12
				}, {
					time: '2016-08-09 01:20:00',
					tem: 26
				}, {
					time: '2016-08-10 01:40:00',
					tem: 18
				}, {
					time: '2016-08-10 02:00:00',
					tem: 26
				}, {
					time: '2016-08-10 02:20:00',
					tem: 12
				}]
			};
		},
		mounted() {
			this.$refs.chart.init(config => {
				const chart = new F2.Chart(config);
				chart.source(this.data, {
					time: {
						type: 'timeCat',
						tickCount: 3,
						range: [0, 1]
					},
					tem: {
						tickCount: 5,
						min: 0
					}
				});
				chart.axis('time', {
					label: function label(text, index, total) {
						const textCfg = {};
						if (index === 0) {
							textCfg.textAlign = 'left';
						} else if (index === total - 1) {
							textCfg.textAlign = 'right';
						}
						return textCfg;
					}
				});
				chart.tooltip({
					showCrosshairs: true
				});

				chart.area()
					.position('time*tem')
					.color('l(90) 0:#1890FF 1:#f7f7f7')
					.shape('smooth');
				chart.line()
					.position('time*tem')
					.color('l(90) 0:#1890FF 1:#f7f7f7')
					.shape('smooth');
				chart.render();
				return chart;
			});
		}
	}
</script>
三、效果图
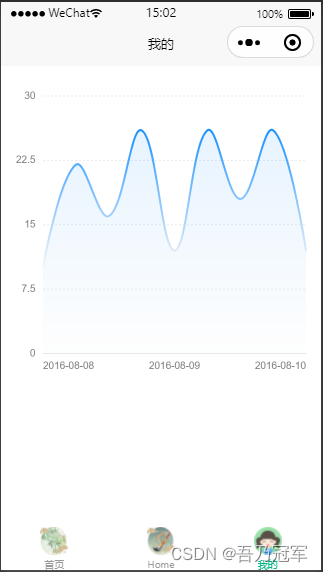


 本文介绍如何利用F2库在HBuilderX中创建一个时间序列图表,并提供了详细的代码示例,包括安装指南、Vue组件模板及图表配置。


 1958
1958

 被折叠的 条评论
为什么被折叠?
被折叠的 条评论
为什么被折叠?
 到【灌水乐园】发言


