


1.背景
Arthas 是 Alibaba 在 2018 年 9 月开源的 Java 诊断 工具。
2.解决问题
得益于 Arthas 强大且丰富的功能,让 Arthas 能做的事情超乎想象。下面仅仅列举几项常见的使用情况,更多的使用场景可以在熟悉了 Arthas 之后自行探索。
- 是否有一个全局视角来查看系统的运行状况?
- 为什么 CPU 又升高了,到底是哪里占用了 CPU ?
- 运行的多线程有死锁吗?有阻塞吗?
- 程序运行耗时很长,是哪里耗时比较长呢?如何监测呢?
- 这个类从哪个 jar 包加载的?为什么会报各种类相关的 Exception?
- 我改的代码为什么没有执行到?难道是我没 commit?分支搞错了?
- 遇到问题无法在线上 debug,难道只能通过加日志再重新发布吗?
- 有什么办法可以监控到 JVM 的实时运行状态?
3.常用命令
cls: 清屏命令;
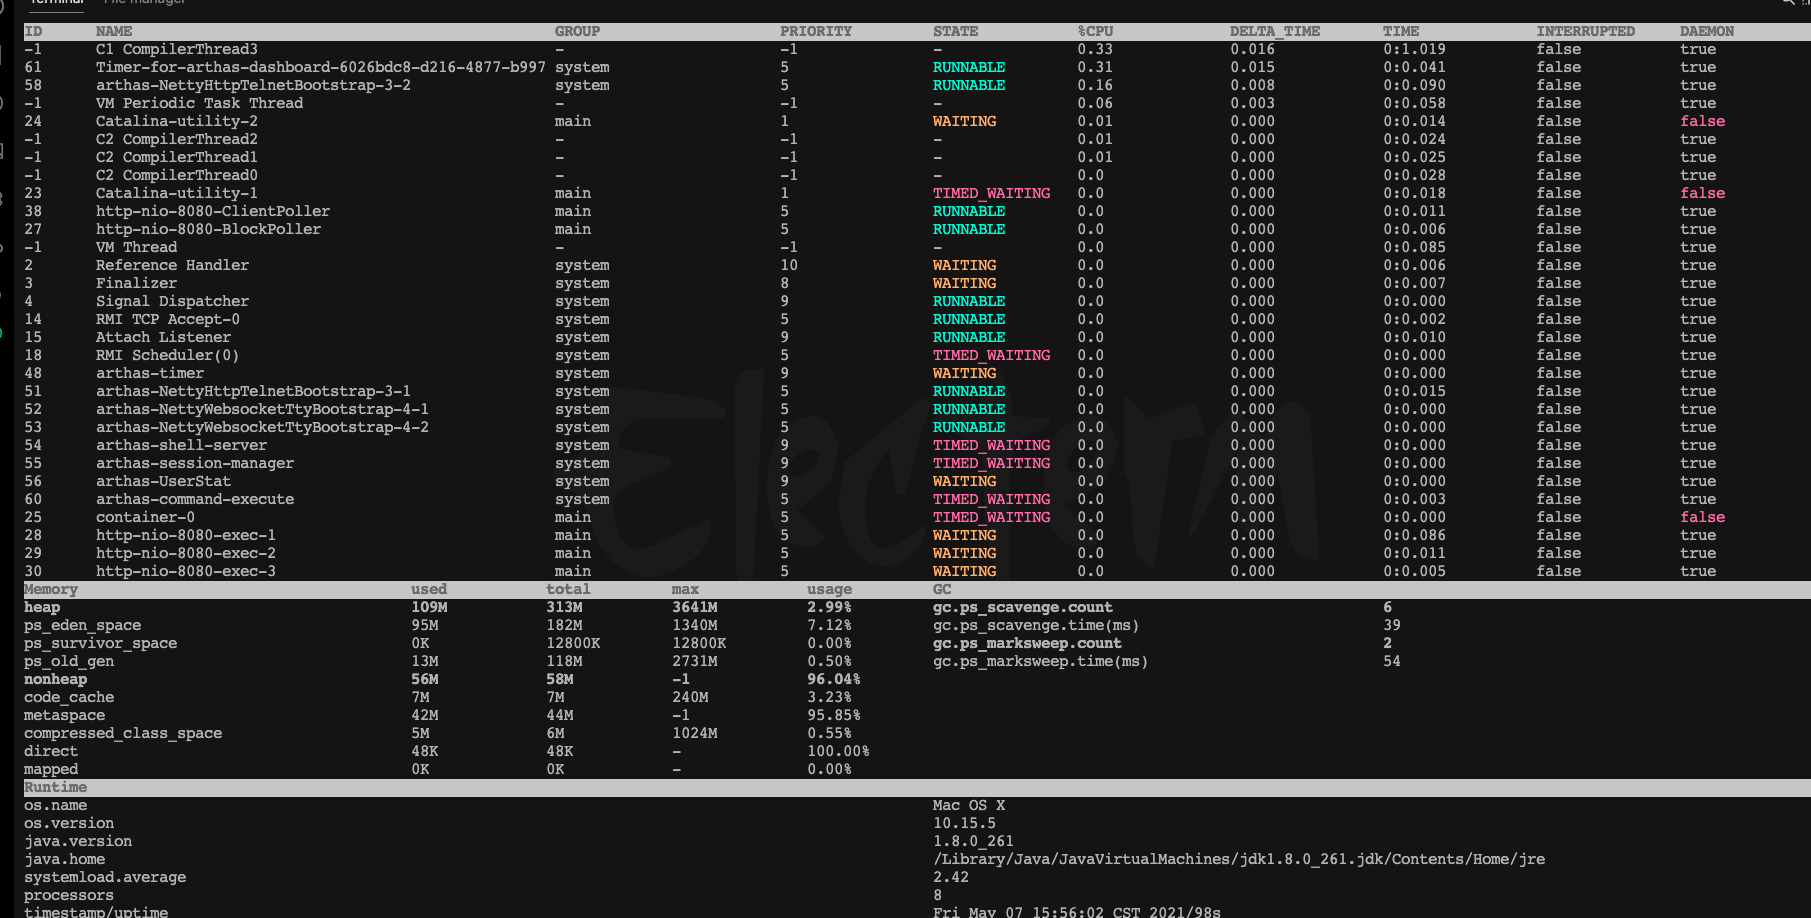
dashboard:会展示当前进程的信息,包含了进程信息,堆栈信息,系统信息,jdk版本信息;退出命令: ctrl+c可以中断执行。
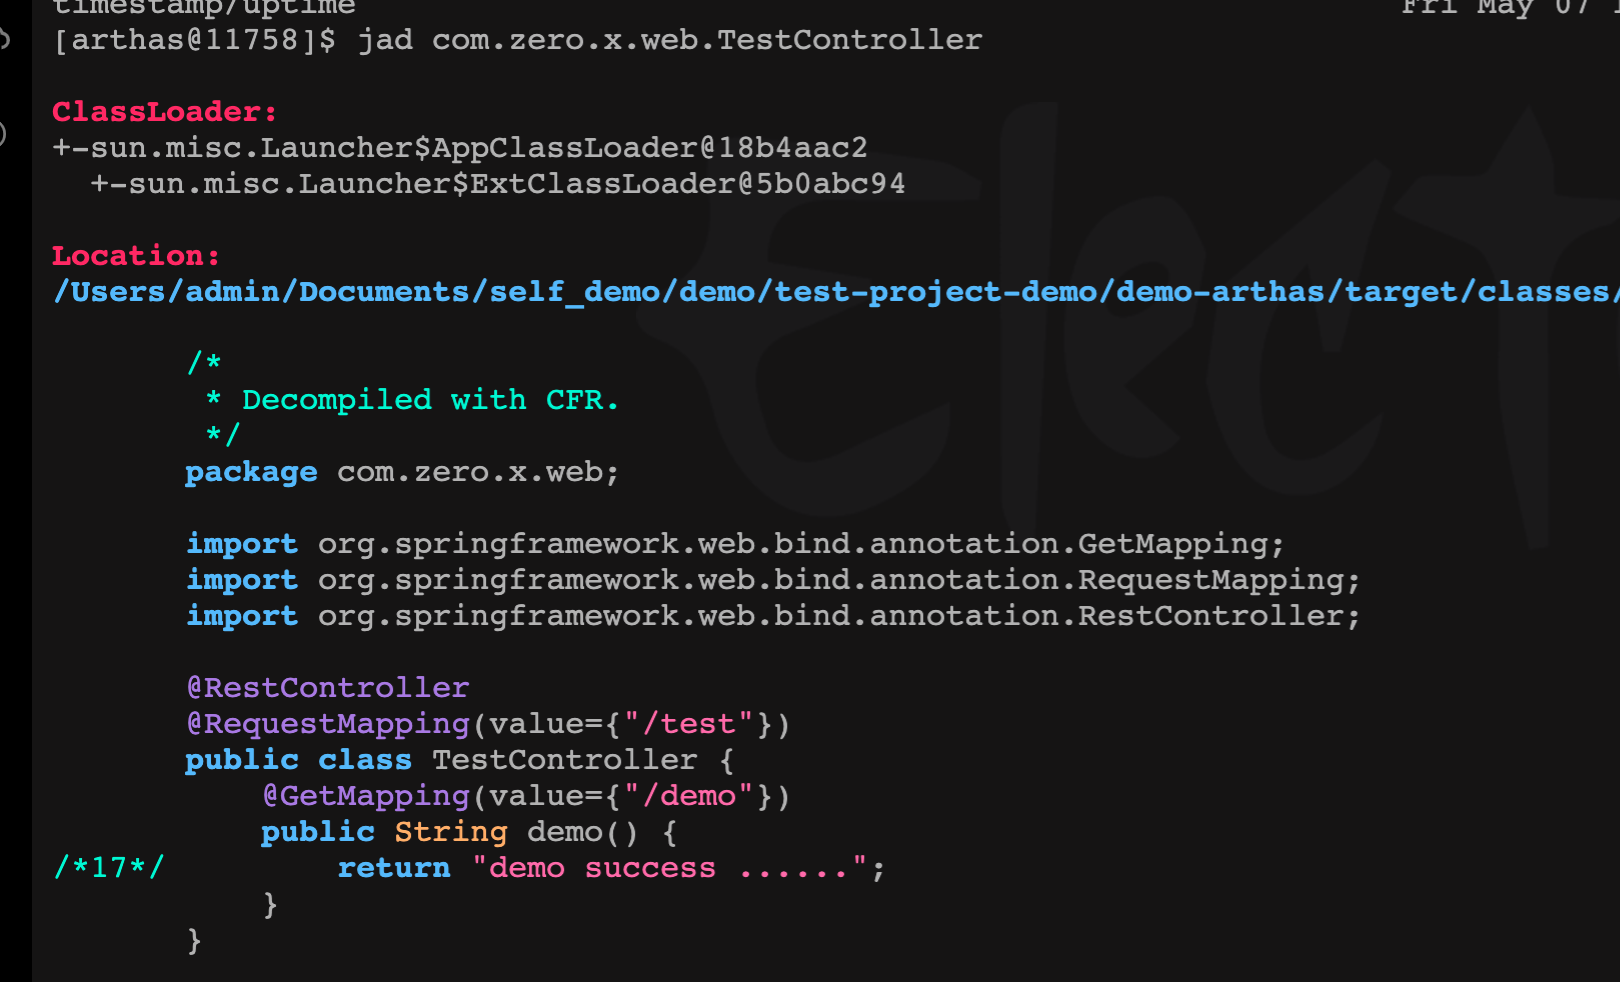
jad来反编译: jad 类全路径
退出arthas: 可以用 quit 或者 exit 命令。完全退出arthas,可以执行 stop 命令。
4.常见问题使用
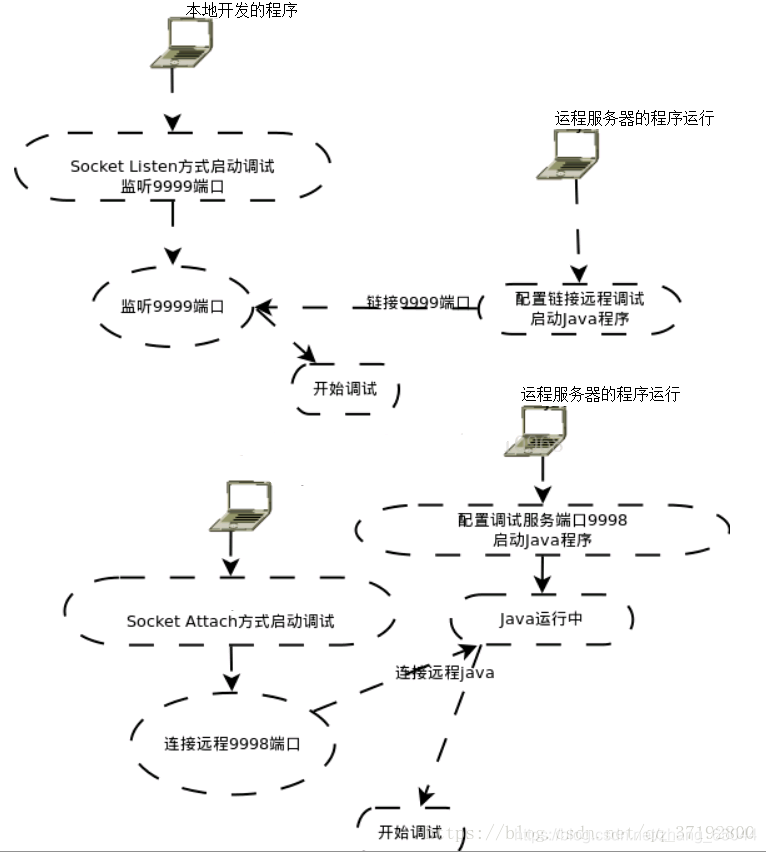
1. 远程联调:在日常开发中,我们在联调阶段,发现在我们程序代码上没有任何异常,但是就是结果不对。一定是程序没有按照我们编写流程走。由于某些场景有难以复现,所以调试很麻烦。此刻我们可以使用 Arthas + Remote 远程调用方式。
Remote工具
remote是一个xdebug工具,它有一个强大的功能,就是链接远程服务代码,但是一定要保证本地代码和远程服务器代码一致。如此强大的功能却有一个致命的问题,稍后在说。
具体做法:https://blog.youkuaiyun.com/lbh199466/article/details/105661739
缺点:
a. 未知问题:使用remote 工具,有一个非常不好的弊端,但是可以理解。就是会产生debug阻塞,所以根本不适合线上环境。当我们有些接口在做高性能测试的时候,你的接口使用了remote工具,可能调试的某个方法被在做压力测试接口使用,那么会严重影响压力测试的结果。还有一种情况,已经上线的接口在测试环境做全链路回归时,发现接口出现超时现象。这些查找原因的时候,发现无法复现。此刻你可以怀疑是你的remote工具带来的不必要的困扰。所以remote工具使用是一定要正确。给一个建议最好不同环境使用不通的端口。
b. 不良习惯养成:过度使用remote(xdebug工具)的人,都会先一个现象,就是日志写的很少。原因是在测试环境,dev环境下,我们可以使用remote工具快速定位。但是生产环境就没有那么简单了。所以说remote不是一个少写日志的理由,恰恰相反是我们必须写日志的理由。
c. 无法定位堆栈信息:这个是xdebug工具的弊端,我可以使用 arthas来实现快速定位(不是唯一的方法,但是是最快且高效的方法)。
这里多说一句:任何工具没有十全十美的,不存在一个工具闯天下的牛叉工具,必然是多种工具组合,每个工具都自己的特性,我们只需要发挥它们特性就好。没有最好,只有最合适的。
回归本文,开始使用arthas实现定位。
在实现arthas 定位的时候,有些基础条件的:
在远程服务器上安装arthas,且启动arthas。链接: https://arthas.aliyun.com/doc/install-detail.html
(非arthas tunnel server 方法,这种非常优秀,但是对源代码有侵入,我觉得没有必要,但是有这个想法的大大可以自己去做。链接:https://arthas.aliyun.com/doc/tunnel.html#arthas-tunnel-server)
启动命令:java -jar arthas-boot.jar --target-ip 远程服务器IP
注意:
a. 远程服务器IP,一定是可以在本地访问到IP,建议使用之前先ping一下。
b. 注意当前arthas-boot.jar 在远程服务器使用的角色一定要和我们诊断的项目角色要一致,不然会出现:
[INFO] arthas-boot version: 3.1.7
[INFO] Can not find java process. Try to pass <pid> in command line.
Please select an available pid.
这样的异常。
c. 开放端口,注意 arthas-boot.jar --target-ip 启动,会开启Web Console功能。那么就会对外暴露2个端口: 8563 和 3658 两个端口。
本地开始链接远程服务器的 arthas。
打开浏览器:可以访问:http://远程服务器IP:8563 或者 3658 端口都行。
接着会出现以下页面:
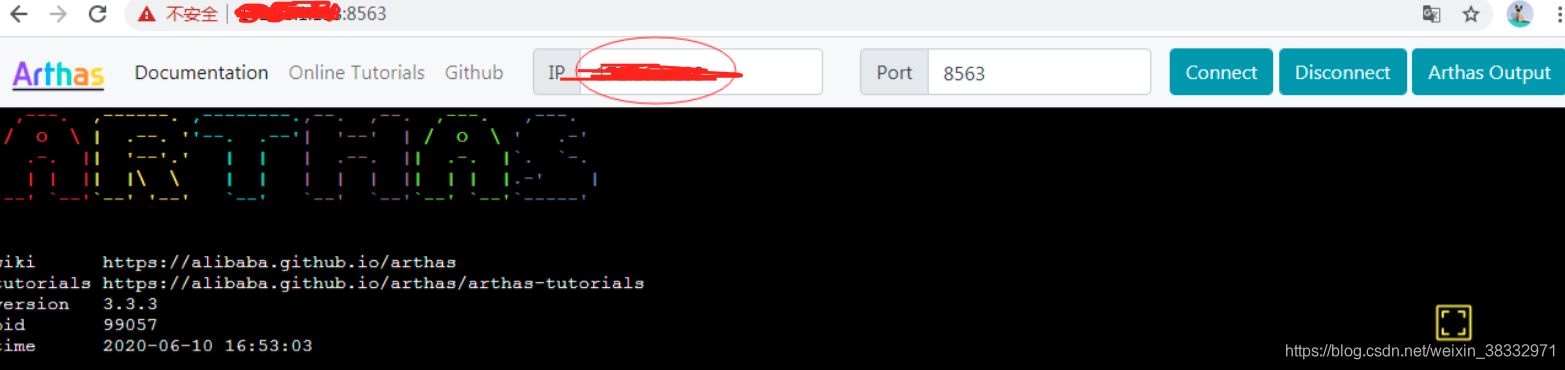
隐藏ip为远程服务器IP。
例如这样一段代码:
package com.zero.x.web;

import java.util.concurrent.atomic.AtomicInteger;

import org.springframework.web.bind.annotation.GetMapping;
import org.springframework.web.bind.annotation.RequestMapping;
import org.springframework.web.bind.annotation.RestController;

/**
 * @author wuxi
 * @date 2021-05-07 3:51 下午
 */
@RestController
@RequestMapping("/test")
public class TestController {

    @GetMapping("/demo")
    public String demo(){
        a();
        d();
        System.out.println("终于执行完了");
        return "demo success ......";
    }


    private void a(){
        System.out.println("执行了a方法");
        b();
    }

    private void b(){
        try {
            Thread.sleep(10);
            System.out.println("b 阻塞10ms......");
        }catch (Exception e){
            e.printStackTrace();
        }
        c();
    }

    private void c(){
        try {

            Thread.sleep(1000);
            System.out.println("c 此方法执行1s......");
        }catch (Exception e){
            e.printStackTrace();
        }
    }

    private void d(){
        System.out.println("d 此方法执行......");
    }
}
建议使用arthas-idea-plugin 工具,我们就没有必要记住那么多命令了。本人很懒。使用教程: https://github.com/WangJi92/arthas-idea-plugin
使用命令:trace com.zero.x.web.TestController demo -v -n 5 --skipJDKMethod false
Condition express: null , result: true
`---ts=2021-05-12 14:06:11;thread_name=http-nio-8888-exec-1;id=1b;is_daemon=true;priority=5;TCCL=org.springframework.boot.web.embedded.tomcat.TomcatEmbeddedWebappClassLoader@2009f9b0
    `---[1014.946463ms] com.zero.x.web.TestController:demo()
        +---[1014.409628ms] com.zero.x.web.TestController:a() #19
        +---[0.041629ms] com.zero.x.web.TestController:d() #20
        `---[0.032494ms] java.io.PrintStream:println() #21
非常明显: +---[1014.409628ms] com.zero.x.web.TestController:a() #19 ,解释一下:+---[1014.409628ms] : 耗时,com.zero.x.web.TestController :类名, a() :方法名, #19 :表示代码行号。
这个类 com.zero.x.web.TestController 中的这个方法 a() 十分耗时
继续使用上述命令:trace com.zero.x.web.TestController a -v -n 5 --skipJDKMethod false
Affect(class count: 1 , method count: 1) cost in 37 ms, listenerId: 2
Condition express: null , result: true
`---ts=2021-05-12 14:09:30;thread_name=http-nio-8888-exec-2;id=1c;is_daemon=true;priority=5;TCCL=org.springframework.boot.web.embedded.tomcat.TomcatEmbeddedWebappClassLoader@2009f9b0
    `---[1016.250778ms] com.zero.x.web.TestController:a()
        +---[0.058073ms] java.io.PrintStream:println() #48
        `---[1016.061931ms] com.zero.x.web.TestController:b() #49
定位到这里: ---[1016.061931ms] com.zero.x.web.TestController:b() #49
继续使用上述命令:trace com.zero.x.web.TestController c -v -n 5 --skipJDKMethod false
Affect(class count: 1 , method count: 1) cost in 32 ms, listenerId: 3
Condition express: null , result: true
`---ts=2021-05-12 14:12:42;thread_name=http-nio-8888-exec-6;id=20;is_daemon=true;priority=5;TCCL=org.springframework.boot.web.embedded.tomcat.TomcatEmbeddedWebappClassLoader@2009f9b0
    `---[1001.125292ms] com.zero.x.web.TestController:c()
        +---[1000.639257ms] java.lang.Thread:sleep() #65
        `---[0.19227ms] java.io.PrintStream:println() #66
这里定位到: +---[1000.639257ms] java.lang.Thread:sleep() #65 这个方法性能极低。到此就可以定位到了。
到此全部诊断全部完成,只剩下我们自己优化了。
2.方法定位:在生产环境下,我们可能需要定位到底哪个方法导致了我们服务器内存效果过高问题,那么我需要怎么做?
还是使用Jstat吗?需要这么麻烦吗?我们可以使用 arthas 优雅的解决。我们使用 火焰图 来处理。
例如:
@GetMapping("/demo1")
    public String demo1(){
        AtomicInteger atomicInteger = new AtomicInteger();
        while (true) {
            new Thread(() -> {
                int num = atomicInteger.incrementAndGet();
                System.out.println(num);

                try {
                    Thread.sleep(60*60*1000);
                } catch (InterruptedException e) {
                    e.printStackTrace();
                }

            }).start();
        }
    }
这样的代码:会导致我们内存增高。
相关文章: https://arthas.aliyun.com/doc/profiler.html?highlight=profiler
命令如下:
profiler start -- 发起收集
profiler getSamples -- 收集数量
profiler stop -- 停止收集
查看效果:
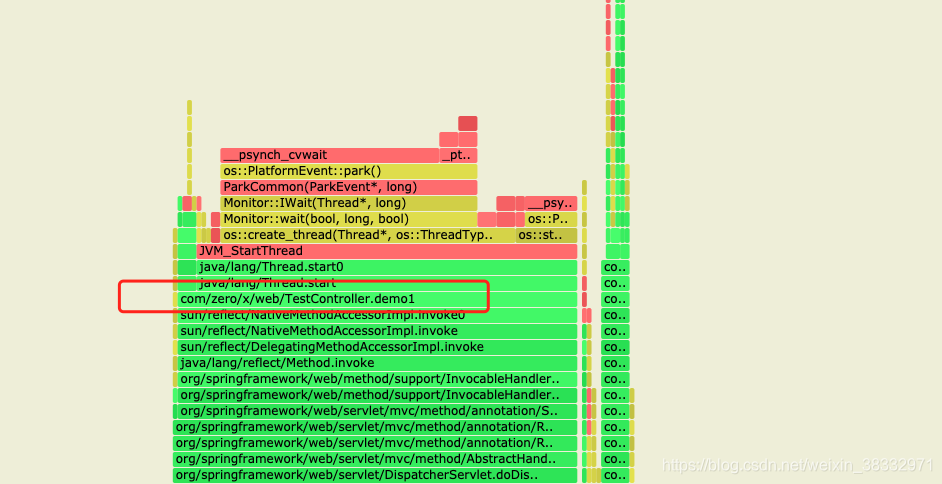
火焰图应该怎么看:https://www.ruanyifeng.com/blog/2017/09/flame-graph.html
火焰图就是看顶层的哪个函数占据的宽度最大。只要有"平顶"(plateaus),就表示该函数可能存在性能问题。
颜色没有特殊含义,因为火焰图表示的是 CPU 的繁忙程度,所以一般选择暖色调。
这样就定位到了那个方法了。非常简单直观
3.如何快速定位服务中那个线程占用cpu很高,且影响性能?
利用thread 命令,这个命令是目前来说入口命令中最快,也是最常用的命令之一。
thread -n 3: 展示当前最忙的前3个线程并打印堆栈。
thread: 默认按照CPU增量时间降序排列,只显示第一页数据。
引用
https://arthas.aliyun.com/doc/spring-boot-starter.html


 75
75

 被折叠的 条评论
为什么被折叠?
被折叠的 条评论
为什么被折叠?
 到【灌水乐园】发言


